

Correlation vs causation in product analytics
Correlation vs causation for product teams: confounders, reverse causality, selection bias, and how to test causality with experiments.
By Sergey BruhPublished 8 min read
Correlation vs causation for product teams: confounders, reverse causality, selection bias, and how to test causality with experiments.
By Sergey BruhPublished 8 min read
A free course for PMs and marketers: short lessons, real product data and exercises with instant feedback.
Start the free course10 min read
Peeking in A/B testing turned a 5% false-positive rate into 27.6% in 100,000 simulated tests. When to stop an A/B test, and how sequential testing helps.
9 min read
How long to run an A/B test: divide the required sample by eligible daily traffic, round up to whole weeks, and plan for novelty effects and sales.
9 min read
What minimum detectable effect (MDE) means, relative vs absolute, and how to set it from business value and your traffic. With a worked example.
Correlation vs causation, answered up front: correlation means two metrics move together; causation means changing one actually changes the other. Product data is full of correlations that are not causal, because users choose which features to use, and the kind of user who chooses a feature is often different from the kind who doesn't. Before you invest in "the feature that drives retention", rule out the three usual suspects (a confounder, reverse causality and selection bias), and then test the idea with a randomised experiment or, if that's impossible, a natural experiment.
CatChow, an online pet-food shop, launched auto-delivery: customers pick a food and a schedule, and it arrives every few weeks. Three months later, a slide appears in the quarterly review:
Customers with auto-delivery: 60% still ordering after six months. Customers without: 27.6%. Auto-delivery more than doubles retention!
The proposed next step: push auto-delivery hard, with pop-ups at checkout and a discount for switching. Revenue projections follow.
The correlation is real. But does auto-delivery cause the retention? Let's split the same customers by how loyal they were before auto-delivery existed:
Within each segment, the gap nearly disappears: 4 points among loyal customers, 2 points among new ones. The big overall gap exists mostly because loyal customers were far more likely to sign up for auto-delivery (800 of the 1,200 loyal customers, versus 200 of the 1,800 new ones). Their loyalty came first; the feature just collected them.
That is a confounder: a third variable, here prior loyalty, that drives both the "cause" and the "effect".
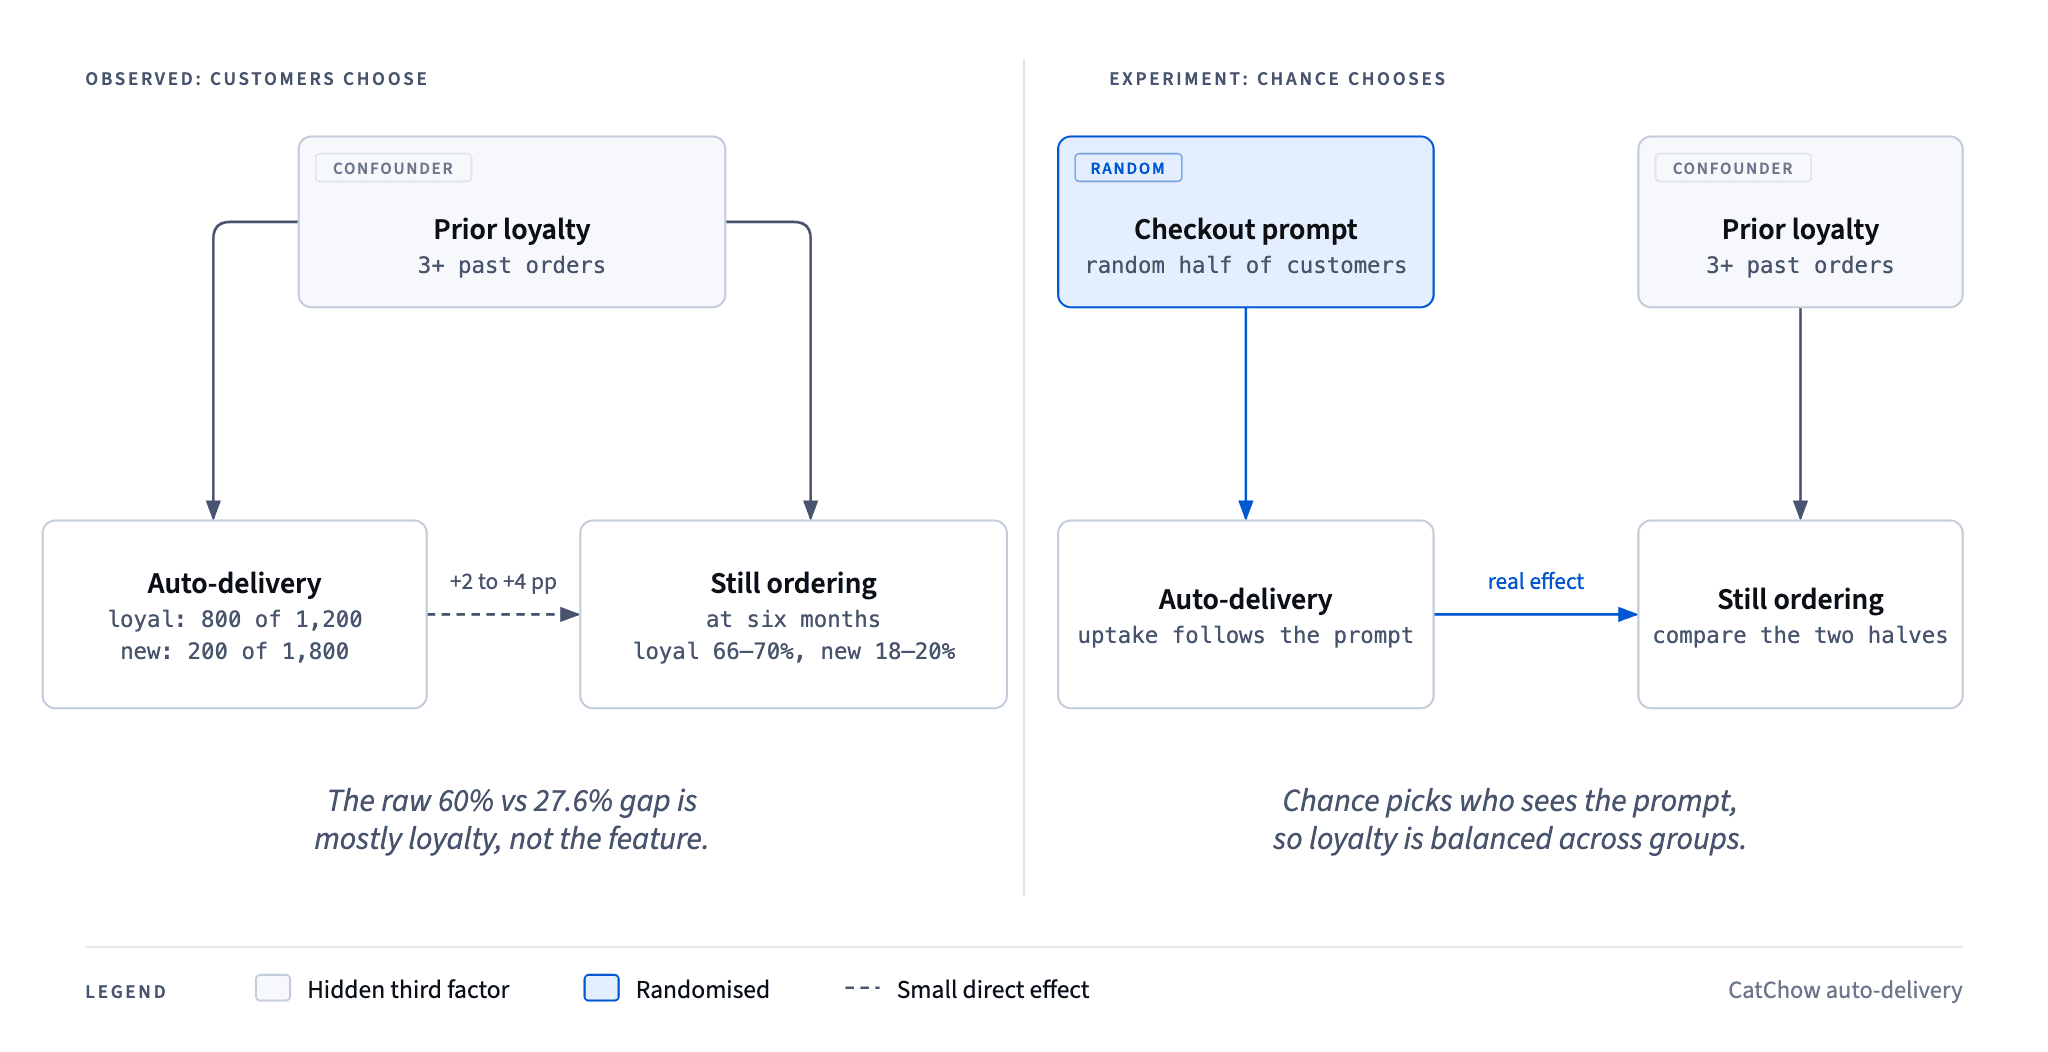
A confounder influences both variables, creating a correlation even when neither affects the other. In product analytics, the most common confounders are:
Sometimes B causes A, not A causes B.
The groups you compare were formed by users' own choices or by a filter, not by chance. Customers who answer an NPS survey are more engaged than those who ignore it. Users who finish onboarding are, by definition, the ones who didn't give up. Any comparison between "did" and "didn't" inherits those differences.
A special case is survivorship: if you only analyse customers still active today, you'll find that everything they did in their first month "predicts" success, because the ones who did those things and left are no longer in the data.
Before arguing about causes, measure the relationship properly. The Pearson correlation coefficient ranges from to : close to means a tight linear relationship, close to 0 means no linear relationship. Two cautions:
And of course, even says nothing about which way the arrow points, or whether there is an arrow at all.
An A/B test is the cleanest tool because randomisation breaks every confounder at once. Chance, not the user, decides who gets the treatment, so loyal and new customers, heavy and light users, and every hidden factor end up spread evenly across groups. Any difference in outcomes is then caused by the treatment, plus noise that statistics can measure.
You often can't force users to use a feature, but you can randomise the invitation. For auto-delivery, CatChow can show the checkout prompt to a random half of customers and compare six-month retention between the halves, regardless of who actually signed up. This is sometimes called an encouragement design: it measures the effect of promoting the feature, which is exactly what the proposed pop-up campaign would do.
When a proper test is impossible, look for situations where something outside the users' control split them into groups:
Regression and segmentation, like the loyalty split above, can adjust for confounders you know about and have measured. That is much better than a raw comparison, but it can't account for the ones you didn't think of. Treat these results as stronger evidence, not proof.
Correlation measures how two variables move together. Causation means that changing one variable produces a change in the other. Two metrics can be strongly correlated because a third factor drives both, because the effect runs the opposite way, or by coincidence.
Not on its own. A correlation becomes evidence for causation when alternative explanations are ruled out: the cause comes before the effect, confounders are controlled or randomised away, and the result replicates. A randomised experiment is the most direct way to get there.
A factor that affects both the thing you think is the cause and the outcome. User engagement is the classic example: engaged users adopt more features and also retain better, so almost every feature looks like it "drives retention" in raw data.
Randomise access to the feature, or randomise the prompt that invites users to it, and compare retention between the randomised groups. If that's impossible, use a staggered rollout and compare the change over time with a group that didn't get the feature yet.
The free lesson Correlation is not causation uses CatChow's ad spend and order data to measure a relationship properly and then take it apart, with quizzes and an AI-checked task. When you want to adjust for several factors at once, continue with Multiple regression. Both are part of the free course Statistics for Product Managers and Marketers.