

Minimum detectable effect (MDE): how to choose it for an A/B test
What minimum detectable effect (MDE) means, relative vs absolute, and how to set it from business value and your traffic. With a worked example.
By Sergey BruhPublished 9 min read
What minimum detectable effect (MDE) means, relative vs absolute, and how to set it from business value and your traffic. With a worked example.
By Sergey BruhPublished 9 min read
A free course for PMs and marketers: short lessons, real product data and exercises with instant feedback.
Start the free course10 min read
Peeking in A/B testing turned a 5% false-positive rate into 27.6% in 100,000 simulated tests. When to stop an A/B test, and how sequential testing helps.
9 min read
How long to run an A/B test: divide the required sample by eligible daily traffic, round up to whole weeks, and plan for novelty effects and sales.
10 min read
How to calculate sample size for an A/B test: the formula, a worked example, how statistical power and MDE change the number, and a free calculator.
The minimum detectable effect (MDE) is the smallest true change in a metric that your A/B test is designed to catch with the power you chose, usually 80%. It describes how sensitive the test is, not what the change will do. You arrive at it from two sides: the business side (the smallest lift that pays for the change) and the traffic side (the smallest lift your visitors and weeks can reveal). When the first number is smaller than the second, no formula closes the gap, and most of this article is about what to do then.
Emily, a product manager at CatChow, an online pet-food shop, wants to add a delivery promise to the cat-food product pages: "Order by 2 pm, get it tomorrow". About 2,000 new visitors a day reach those pages, and 3% of them place an order.
The test brief has a field called "MDE". Emily types 20%, because with 20% the test fits into the two weeks left in the sprint. Nobody on the team believes one line of text will lift orders by a fifth. The number came from the calendar, and a test planned this way was never able to see the effect it was looking for.
"An MDE of 10%" means nothing until you say 10% of what. A relative effect is a share of the baseline. An absolute effect is a difference in percentage points (pp). Here are the same changes written both ways, at 5% significance and 80% power:
"Plus 10%" costs 53,211 users per variant on a 3% baseline and 3,763 on a 30% baseline. "Plus one point" is a dramatic jump for orders and a barely visible one for email opens. Mix the two units up and your sample is wrong by an order of magnitude.
So write the MDE in full: "from 3.0% to 3.3%, which is +0.3 pp or +10% relative".
One formula connects the MDE, the sample, the significance level and the power, and you can run it in either direction. It is explained in how to calculate A/B test sample size; here we only use it.
This is what the sample size calculator answers. For Emily's pages (baseline 3%, 2,000 new visitors a day, split 50/50):
This is what the MDE calculator answers. You enter the baseline conversion, the new participants per day (both variants together) and the number of days; it returns the MDE as a relative uplift and in percentage points, plus the participants per variant.
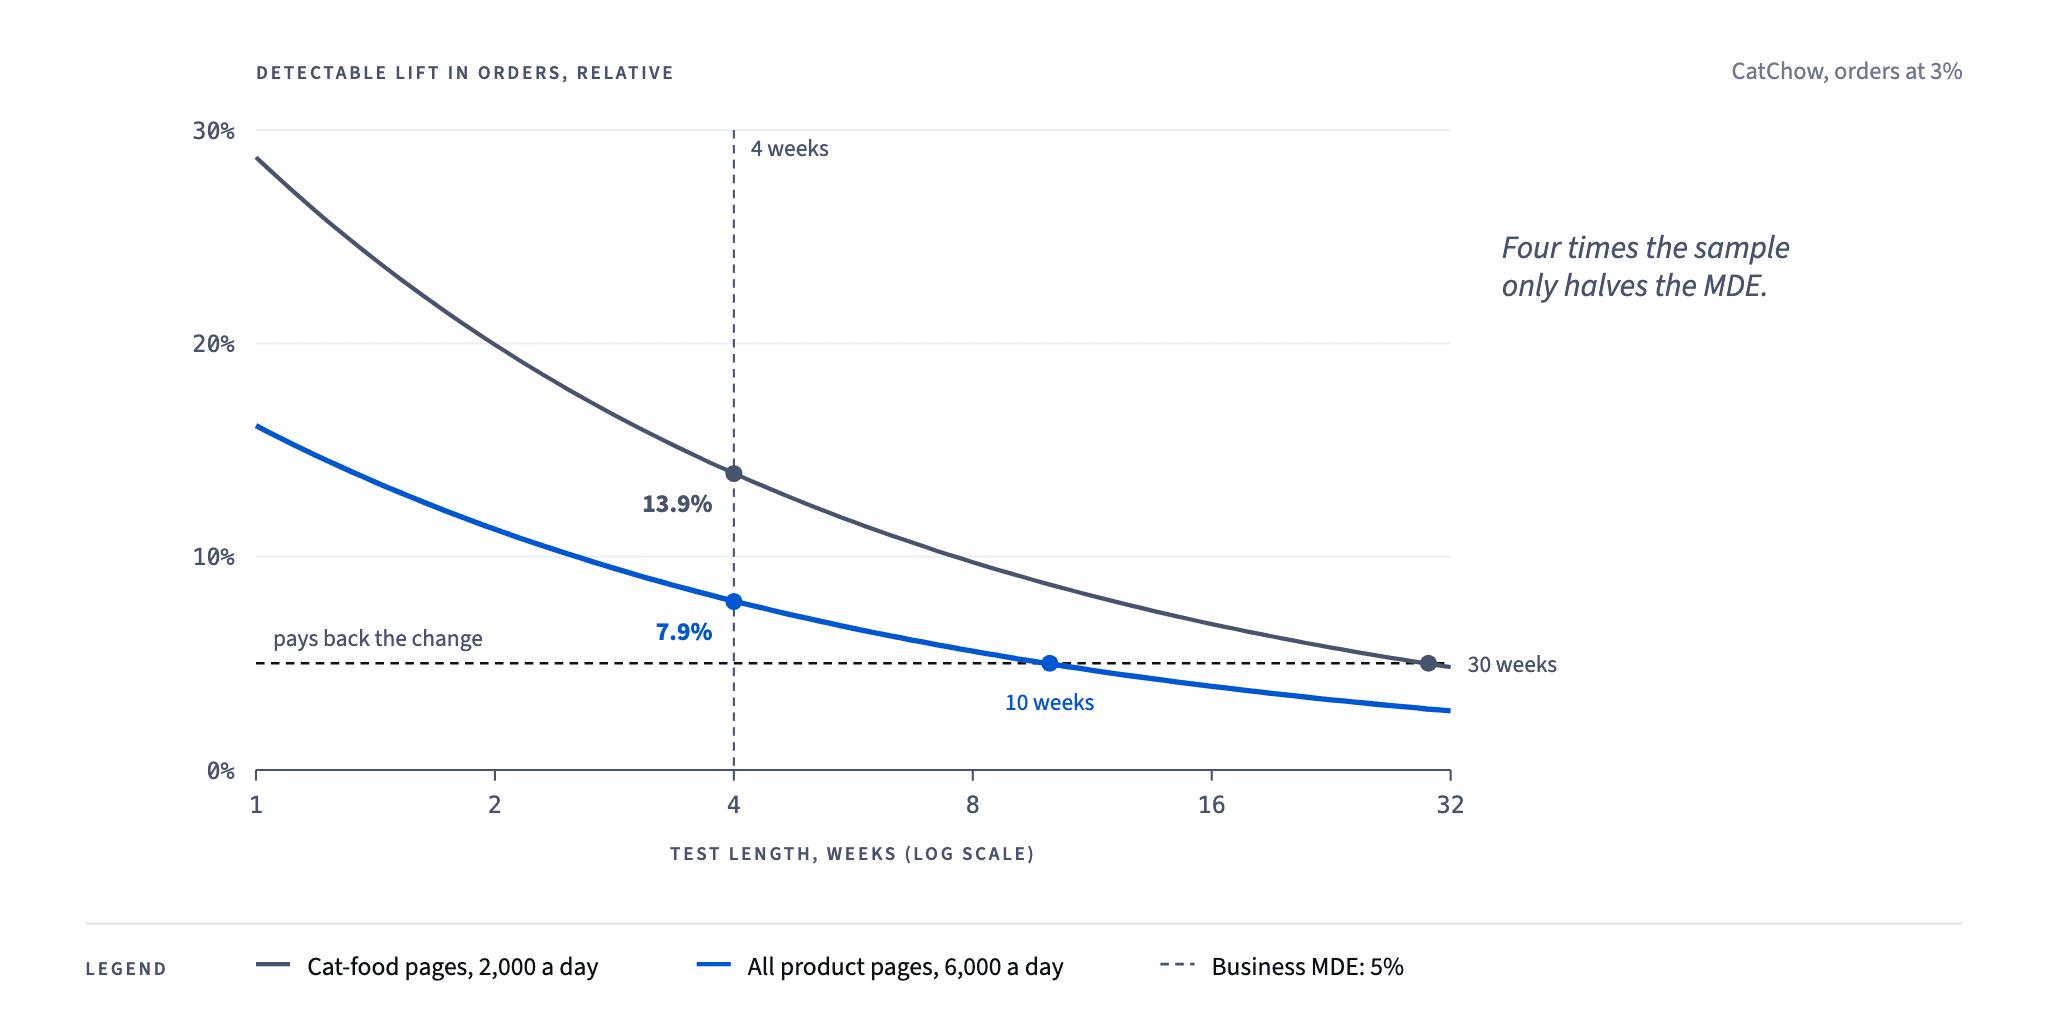
Halving the MDE takes about four times the sample, so a test four times longer only halves the MDE: one week gives 28.7%, four weeks give 13.9%.
Direction 2 tells you what the test can see, not what is worth seeing. For that, find the smallest lift that pays for the change. For the delivery promise:
The cost over the first year is dollars, or 1,080 dollars a month. To cover it, the promise must bring extra orders a month. The pages get visitors a month, so that is percentage points: from 3.00% to 3.15%, a 5% relative lift.
That is the business MDE. A smaller lift loses money even if it is real, so there is no reason to pay for a test that can detect it.
Now compare the two numbers. The business needs to see 5%. Four weeks of traffic can see 13.9%, and reaching 5% would take 30 weeks.
Emily has five honest options.
A page with more traffic. The promise works on every product page, not only cat food. All product pages together get 6,000 new visitors a day at the same 3% conversion. Four weeks now detect a 7.9% lift, and 5% takes 10 weeks instead of 30.
A more sensitive metric. 12% of visitors add something to the cart. On that metric the same four weeks at 2,000 visitors a day detect a 6.5% lift (12% to 12.78%), and on all product pages 3.7%. But an add-to-cart lift is a signal about orders, not proof of them.
A bolder change. Test the promise together with a countdown to the 2 pm cut-off and the delivery date in the cart. A package can plausibly have a larger effect than one line of text. You learn less about which part worked, but the test can see the whole.
A longer test. Eight weeks bring the MDE to 9.7%, but they delay the decision and let seasons and campaigns into the data.
No test. If the change is cheap and easy to undo, ship it on judgement and watch the metrics. If it is expensive and the evidence is weak, don't build it.
Not on the list: lowering the power or loosening the significance level until the number fits. The test gets a nicer MDE by becoming less reliable.
Suppose Emily runs the four-week test anyway, and the promise truly lifts orders by 5%. With 28,000 users per variant, the test has only about an 18% chance of reaching significance. Usually it reports "no significant difference" about a change that works.
The rarer outcome is more dangerous. If control gets 840 orders (3.00%), the variant needs at least 921 (3.29%) before drops below 0.05. That is a lift of 9.6%. This test cannot report a significant lift of 5%; the smallest significant result it can show is almost twice the truth. In our simulation of 400,000 such tests, the ones that reached significance showed an average lift of 12.6%, two and a half times the real one.
So an underpowered test that "wins" hands you an inflated number, and the revenue forecast built on it will not come true. Reading the confidence interval helps: for 840 against 921 orders it runs from about 0% to +19%, a more honest summary than "+9.6%".
There is no universal value. A good MDE is no smaller than the lift that pays for the change and no larger than the effect the change could realistically produce. If nothing fits between those two limits with your traffic, the test is not worth running in this form.
It can be either, which is why you must say which. On a 3% baseline, 10% relative is 0.3 percentage points, while 10 percentage points would mean going from 3% to 13%. Our calculators show both.
Sometimes. The MDE is the effect the test catches with the chosen power, usually 80% of the time. Smaller real effects are caught less often, and when they are, the measured lift is usually overstated.
Choosing an MDE gets easier after you have sized a few tests yourself. The free lesson Power and sample size walks through a CatChow test step by step, with quizzes and a practice task checked by AI. It is part of the free course Statistics for Product Managers and Marketers.