

Theory
Products of shares: funnels and metric trees
Overall conversion as a product of step rates, working a funnel backwards from a goal, ARPU = paying share × ARPPU, revenue per visitor, stickiness, diluted effects, ownership dilution and RICE.
~8 min read · 9 exercises · 250 points
Before you start
A funnel multiplies
Still on Klasna's product team, looking at the trial funnel: visitors book a trial, some of them attend, and some of those buy a package. The tempting move is to add or average the step rates.
You'll see why the steps multiply, how a step rate and the overall rate differ in their base, and how to break a metric into a tree of factors to see which one moved.
A funnel multiplies
In a funnel each share is taken of the previous step, so the step rates multiply. Klasna's trial funnel: 6% of site visitors book a trial, 75% of those attend, 25% of attendees buy a package. From 20,000 visitors: 20,000 × 0.06 = 1,200 bookings; × 0.75 = 900 attend; × 0.25 = 225 buyers.
The overall conversion is the product of the step rates: 0.06 × 0.75 × 0.25 = 0.01125, or 1.125% of visitors.
A step rate and the overall rate are different numbers with different bases: 25% is "of attendees", 1.125% is "of visitors". Mixing them up is the usual funnel mistake, along with adding the rates, which gives a meaningless 106%.
When a report shows a funnel, label each rate with its base and check that the product of the steps matches the overall figure.
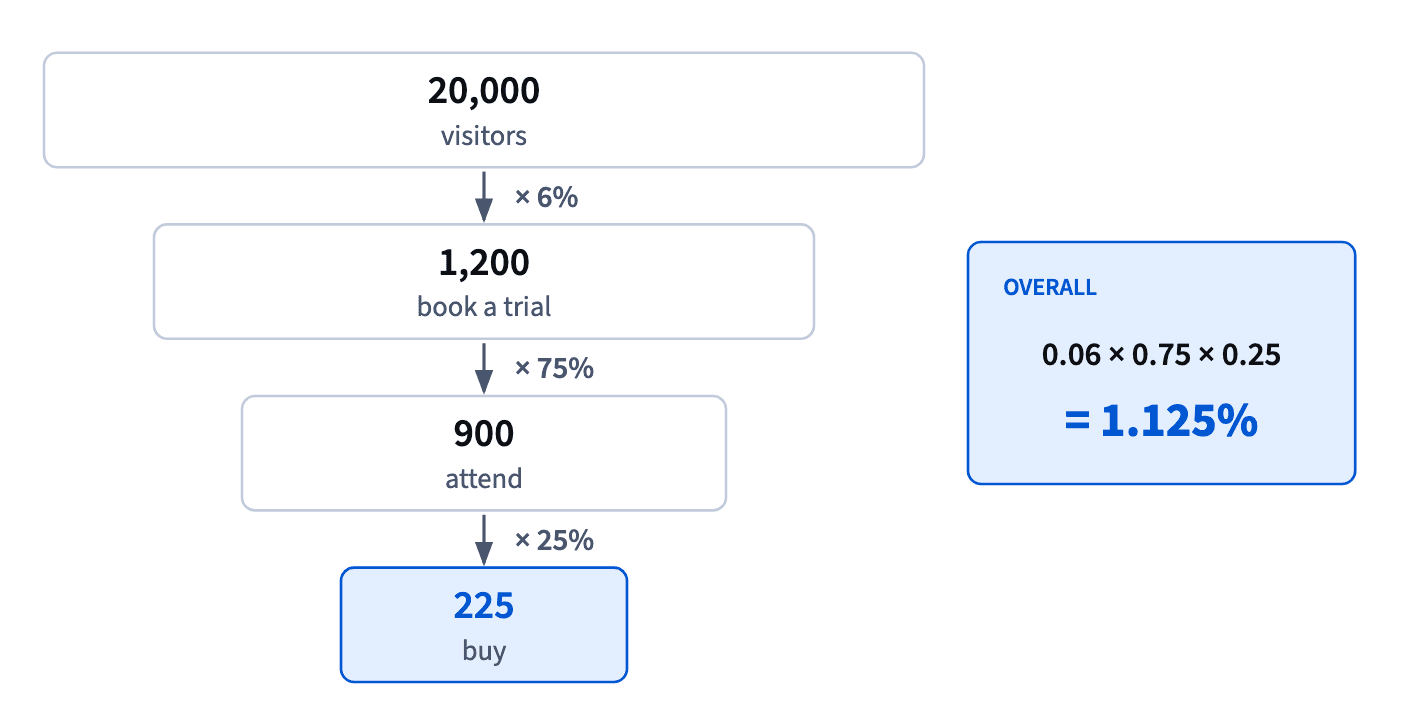
- Do0.06 × 0.75 × 0.25 = 1.125% of visitors
- Don't6% + 75% + 25% = 106%
Shares of different bases can't be added.
A relative lift passes straight through
Because a funnel's overall rate is a product, a relative change at any one step passes straight through to the total. If attendees buy 20% more often, 25% → 30%, overall conversion goes from 0.06 × 0.75 × 0.25 = 1.125% to 0.06 × 0.75 × 0.30 = 1.35%: also +20%.
Picture: Step rates multiply into the overall rate. · shown above
Points don't pass through like that. The +5 pp at the buying step becomes only +0.225 pp overall, because it's multiplied by the steps above it.
This gives a fair way to compare improvements at different steps: compare their relative changes. +4 pp on an 80% step is +5%; +2 pp on a 10% step is +20%, the bigger win despite the smaller points.
So when someone pitches "+4 points at step two", translate it into a relative change at that step before comparing it with anything else.
- Do25% → 30% at one step: overall +20% too
- Don't"+4 pp here beats +2 pp there" without the bases
On different bases, points aren't comparable.
Planning backwards: divide
Reporting runs a funnel forwards and multiplies; planning runs it backwards and divides. Start from the goal and divide by each step's rate, bottom to top.
Leo, Klasna's CEO, wants 300 buyers a month: 300 ÷ 0.25 = 1,200 attendees; ÷ 0.75 = 1,600 bookings; ÷ 0.06 ≈ 26,667 visitors. In one step, 300 ÷ 0.01125 ≈ 26,667, the goal divided by the overall rate. At about 5 UAH per visit from ads, that's a budget of roughly 133,000 UAH.
Two rules keep it honest. Round up, as in module 1: people come in whole numbers, and a plan one visitor short is short of the goal. And remember that the rates are estimates: a plan that needs every step to stay at its best month's rate needs a margin.
The slip to avoid is multiplying the goal by the rates instead of dividing, which shrinks 300 buyers to about 3 visitors.
- Do300 ÷ 0.25 ÷ 0.75 ÷ 0.06 ≈ 26,667 visitors
- Don't300 × 0.06 × 0.75 × 0.25 ≈ 3 visitors
Multiplied where it should divide.
Metric trees: ARPU = paying share × ARPPU
A metric tree is the funnel idea applied to revenue: every node is the product of the nodes under it.
- Revenue = active learners × ARPU, revenue per active learner.
- ARPU = paying share × ARPPU, revenue per paying learner.
If 8% of 12,000 active learners pay for Klasna Club, the school's monthly membership, at 350 UAH a month, ARPU = 0.08 × 350 = 28 UAH, and revenue = 12,000 × 28 = 336,000 UAH a month.
The tree tells you where to look when revenue moves: fewer active learners, a smaller paying share, or less per payer? Because the factors multiply, their relative changes combine: a paying share up 10% and ARPPU down 10% leave ARPU about 1% lower, since 1.1 × 0.9 = 0.99.
Keep ARPU and ARPPU apart: they share a numerator, revenue, and differ only in the denominator.
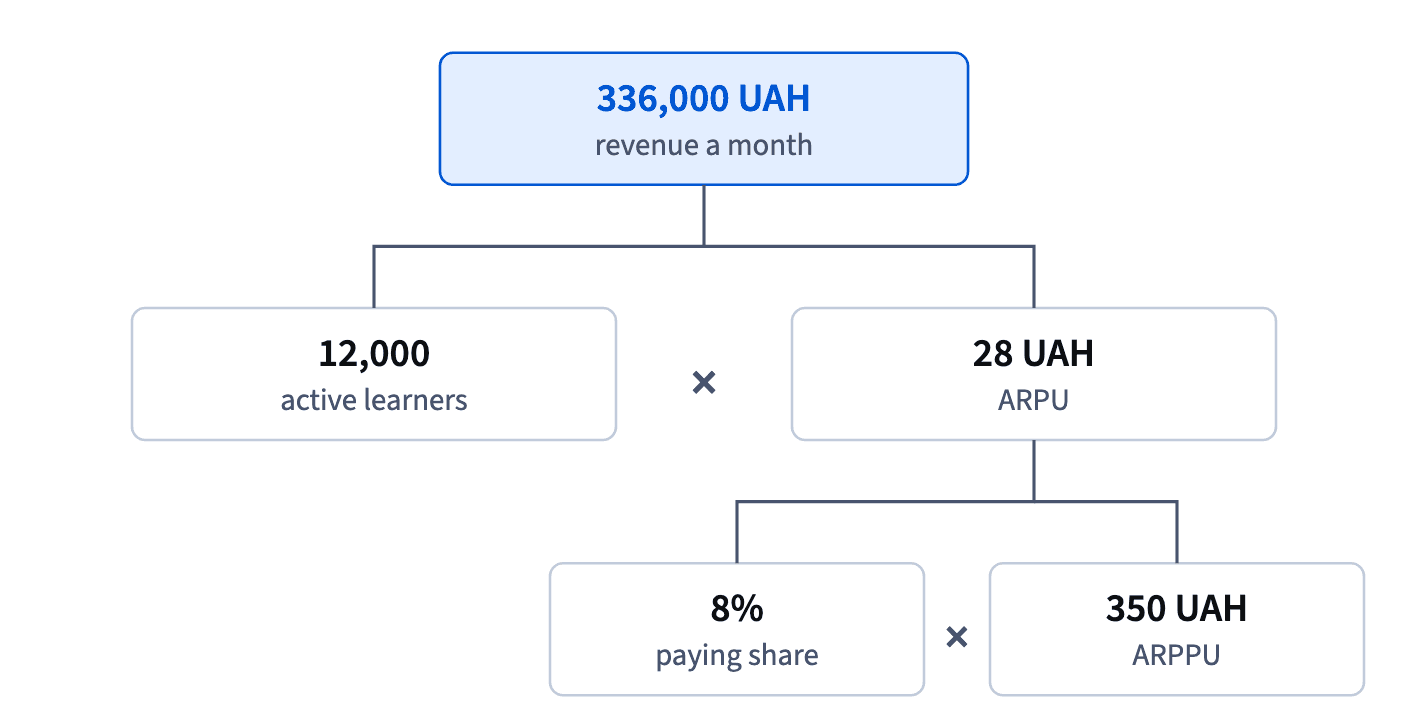
- DoARPU = 0.08 × 350 = 28 UAH
- Don'tComparing one month's ARPU with another month's ARPPU
Same numerator, different denominators.
Two more ratios: RPV and stickiness
The same pattern of shares and products gives two metrics you'll meet in product analytics.
Revenue per visitor, RPV = conversion × price. A page that converts 2% of visitors at 600 UAH earns 0.02 × 600 = 12 UAH per visitor. RPV lets you compare a cheaper offer that converts more with a pricier one that converts less: 3% at 450 UAH gives 13.50 UAH, the better of the two.
Stickiness = average DAU ÷ MAU, the share of the month's users who show up on a typical day. 1,200 a day out of 6,000 a month is 20%: one in five of the month's users is there on an average day.
Both are shares of shares. RPV multiplies a share by an amount; stickiness divides a count by a bigger count that contains it, so it lies between 0 and 100%. Check the denominators: RPV is per visitor, not per buyer, and stickiness divides by the month's users, not the day's.
- DoRPV: 0.03 × 450 = 13.50 UAH beats 0.02 × 600 = 12 UAH
- Don't"Higher price, more revenue per visitor" without the conversion
RPV needs both factors.
RICE: a product with one division
Roadmap scores often follow the metric-tree pattern. RICE = Reach × Impact × Confidence ÷ Effort: how many people an item touches in a period, how much it changes things for each on a small fixed scale, how sure you are (a share from 0 to 1), all divided by the work.
2,000 learners a quarter × impact 2 × confidence 0.8 ÷ 4 person-weeks = 800.
Because the factors multiply, any one of them can sink a score: halving confidence halves the result, and an item that reaches nobody scores zero however big its impact. Effort sits in the denominator, so doubling the work halves the score.
The score is only as good as its inputs. Reach must cover the same period for every item, impact must use the same scale, effort the same unit. A RICE score ranks items against each other; on its own, 800 means nothing.
- Do2,000 × 2 × 0.8 ÷ 4 = 800
- Don'tReach per quarter for one item and per year for another
The scores can't be compared.
Diluted effects: effect × reach
Products also shrink effects. A new booking page lifts conversion by 3 pp for those who see it, but only 15% of visitors ever reach it. The effect on overall conversion is 3 pp × 0.15 = 0.45 pp: reach multiplies the effect.
That's why a change on a page few people see can't move the company total much, and why a test is analyzed only on those who reach the page: inside that group the effect is 3 pp, not 0.45. Analyze it on all visitors and the real effect is buried under the 85% who saw nothing.
The same multiplication sizes the prize before you build: a feature that would lift a step by 10% but touches 5% of users is worth about 0.5% overall.
Slips to avoid: adding the reach to the effect, and reading "+3 pp" from a test as the company-wide gain.
- Do3 pp × 0.15 = 0.45 pp overall
- Don't"The test showed +3 pp, so company conversion is up 3 pp"
Only 15% saw the change.
Ownership dilution
Ownership shrinks by multiplication too. When a company sells a share s of itself in a round, every existing owner keeps (1 − s) of their stake. A founder with 50% after two rounds of 20% keeps 50% × 0.8 × 0.8 = 32%.
Subtracting the rounds, 50 − 20 − 20 = 10%, is wrong: a round takes 20% of the whole company, not 20 points of the founder's stake, so after the first round the founder holds 50% × 0.8 = 40%, not 30%. Every owner's share shrinks by the same factor; the founder's slice gets smaller while, if the round went well, the company is worth more.
How it fits together: shares of shares multiply, so funnels, metric trees, diluted effects and dilution are all products; planning backwards divides; relative changes pass straight through a product. Next lesson: choosing the right denominator.
- Do50% × 0.8 × 0.8 = 32%
- Don't50% − 20% − 20% = 10%
Rounds take shares of the whole company.
Ready to practise?
Answer the lesson's exercises and earn 250 points the first time you finish it.
Start the exercises