

Theory
What do we divide by? Denominator traps
ARPU vs ARPPU, LTV per cohort user vs per survivor, win rate with or without "no decision", gross vs net margin, concentration with the item in the total, and incremental results against a control group.
~8 min read · 10 exercises · 250 points
Before you start
What do we divide by?
Module 3 ends at Klasna with the quietest source of wrong numbers: the denominator. Klasna Club's June revenue is known, and so are the active and the paying learners, but "revenue per learner" depends on which of them you divide by.
You'll see how the choice of denominator decides which question a ratio answers, and how to spot comparisons where two numbers were divided by different things.
One numerator, two denominators
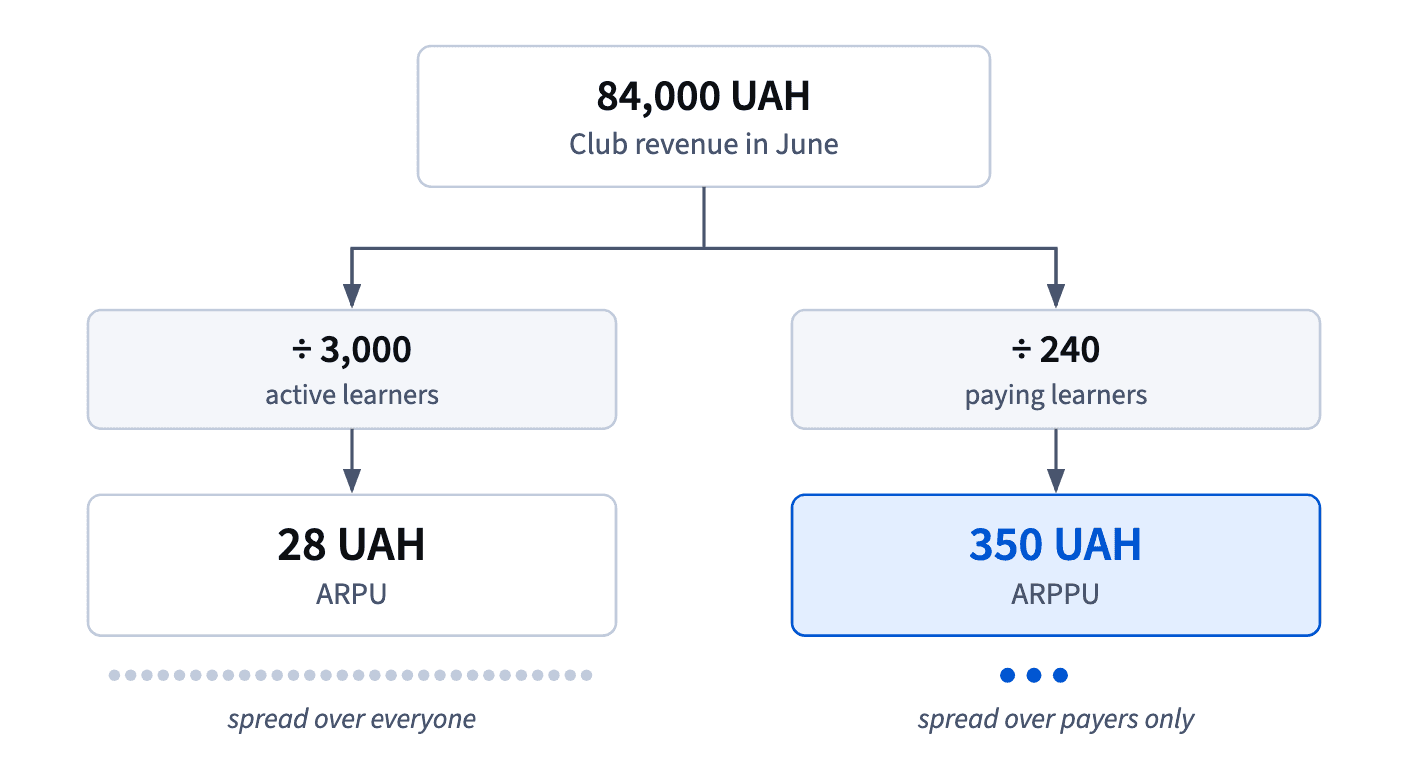
The numerator of a metric is usually obvious; the denominator decides which question it answers. Klasna Club, the school's monthly membership, brought 84,000 UAH in June, when 3,000 learners were active and 240 of them paid.
- Per active learner: ARPU = 84,000 ÷ 3,000 = 28 UAH. It answers "what is an average active learner worth to the Club?"
- Per paying learner: ARPPU = 84,000 ÷ 240 = 350 UAH. It answers "what does a payer spend?"
Both are right. They connect through the metric tree: ARPU = paying share × ARPPU = 0.08 × 350 = 28. When not everyone pays, ARPU is always the smaller of the two.
Before you divide, finish the phrase "per ___" out loud and pick the denominator that matches the decision: planning revenue from traffic needs ARPU, pricing for payers needs ARPPU.
- Do84,000 ÷ 3,000 = 28 UAH ARPU; 84,000 ÷ 240 = 350 UAH ARPPU
- Don't"Revenue per learner: 350 UAH"
Per which learners?
Compare like with like
A ratio can only be compared with a ratio that has the same denominator. School A's ARPU of 30 UAH and school B's ARPPU of 300 UAH can't be ranked: one divides revenue by every active learner, the other only by payers. If 10% of B's learners pay, its ARPU is 0.10 × 300 = 30 UAH, exactly A's.
The same goes for time and scope. Revenue per month against revenue per quarter, conversion of visitors against conversion of sign-ups, margin per lesson against margin per package: each pair looks comparable and isn't.
Before comparing two numbers from different reports, check three things: the same numerator, the same denominator, the same period. If any differ, convert one of them first, or say plainly that they can't be compared.
It's the commonest trap on benchmark slides, where a competitor's best-looking metric sits next to your most modest one.
- DoConvert B's ARPPU to ARPU before comparing
- Don'tRanking A's ARPU against B's ARPPU
Different denominators.
LTV per cohort learner, not per survivor
Lifetime value hides the same trap. A cohort of 1,000 learners has brought 1,800,000 UAH of margin by month 6, and 300 of them are still active.
- Per cohort learner: 1,800,000 ÷ 1,000 = 1,800 UAH.
- Per survivor: 1,800,000 ÷ 300 = 6,000 UAH.
The second looks much better against acquisition cost, which is exactly why it's wrong for that comparison. You paid to acquire all 1,000, including the 700 who left; the margin they brought before leaving is in the numerator, so they belong in the denominator too. Dividing by survivors counts only the winners, a form of survivorship bias.
Rule of thumb: whatever you paid for goes in the denominator. To compare with acquisition cost, divide by everyone acquired; per-survivor figures are fine for describing loyal customers, as long as they're labelled.
- Do1,800,000 ÷ 1,000 = 1,800 UAH, set against acquisition cost
- Don't1,800,000 ÷ 300 = 6,000 UAH, set against acquisition cost
Counts only the winners.
Is the item in the total?
A share answers "what part of the whole?", so the part must be inside the whole it's divided by. Klasna for Teams, the school's lessons for companies, earned 900,000 UAH last quarter, and the largest client paid 240,000. Its share is 240,000 ÷ 900,000 = 26.7% of revenue.
Dividing by the other clients only, 660,000, gives 36.4%, a share of nothing in particular. It compares the client with the rest, which is a ratio rather than a share, and it can even exceed 100% when one client is bigger than all the others together.
Concentration matters for risk: losing a client worth over a quarter of revenue is a serious blow. Report it as a share of the total; when you also want "how big compared with the rest", call it a ratio and write it with ×: 240,000 ÷ 660,000 ≈ 0.36×.
Check: the shares of all the parts of a total add up to 100%.
- Do240,000 ÷ 900,000 = 26.7% of revenue
- Don't240,000 ÷ 660,000 = 36.4%, called a share
The client is missing from the total.
Win rate: decided deals or all proposals?
A win rate has two honest denominators, and they tell different stories. Say that of 12 proposals, 3 were won, 3 lost to a rival and 6 ended with no decision.
- Against decided deals: 3 ÷ (3 + 3) = 50%. It answers "when a client chooses, how often do they choose us?"
- Against all proposals: 3 ÷ 12 = 25%. It answers "how much of our sales effort turns into deals?", stalled ones included.
Neither is wrong, but swapping them misleads: 50% makes the pipeline look healthy while half the proposals go nowhere. A third denominator, won plus no decision, mixes the two and answers nothing.
Label the denominator every time, and when the stalled share is large, show both: "won 3 of 12 proposals (25%); 50% of those that reached a decision".
- Do"Won 3 of 12 (25%); 50% of decided deals"
- Don't"Win rate 50%" with no denominator
Hides the six stalled proposals.
Margins: profit over your own revenue
Gross and net margin share one denominator, revenue, and differ in the numerator: gross profit (revenue minus the direct costs of delivering) or net profit (after everything). Both are shares of revenue, so both sit below 100%.
The trap is the denominator for a marketplace. If customers pay 1,000,000 UAH for lessons booked through a platform that keeps 20%, the platform's revenue is 200,000; the other 800,000 belongs to tutors. With 120,000 of gross profit, the gross margin is 120,000 ÷ 200,000 = 60%. Dividing by the 1,000,000 customers paid gives 12%, which makes the business look thin and can't be compared with any other company's margin.
So divide by what the company actually earns. If you also report the total customers paid, give it its own name and keep it out of margin formulas.
- Do120,000 ÷ 200,000 = 60% gross margin
- Don't120,000 ÷ 1,000,000 = 12%, called a margin
Divides by money that belongs to tutors.
Build the baseline from a holdout
The hardest denominator is the one you can't see: what would have happened anyway. A campaign's results include people who would have come without it, so you need a counterfactual baseline.
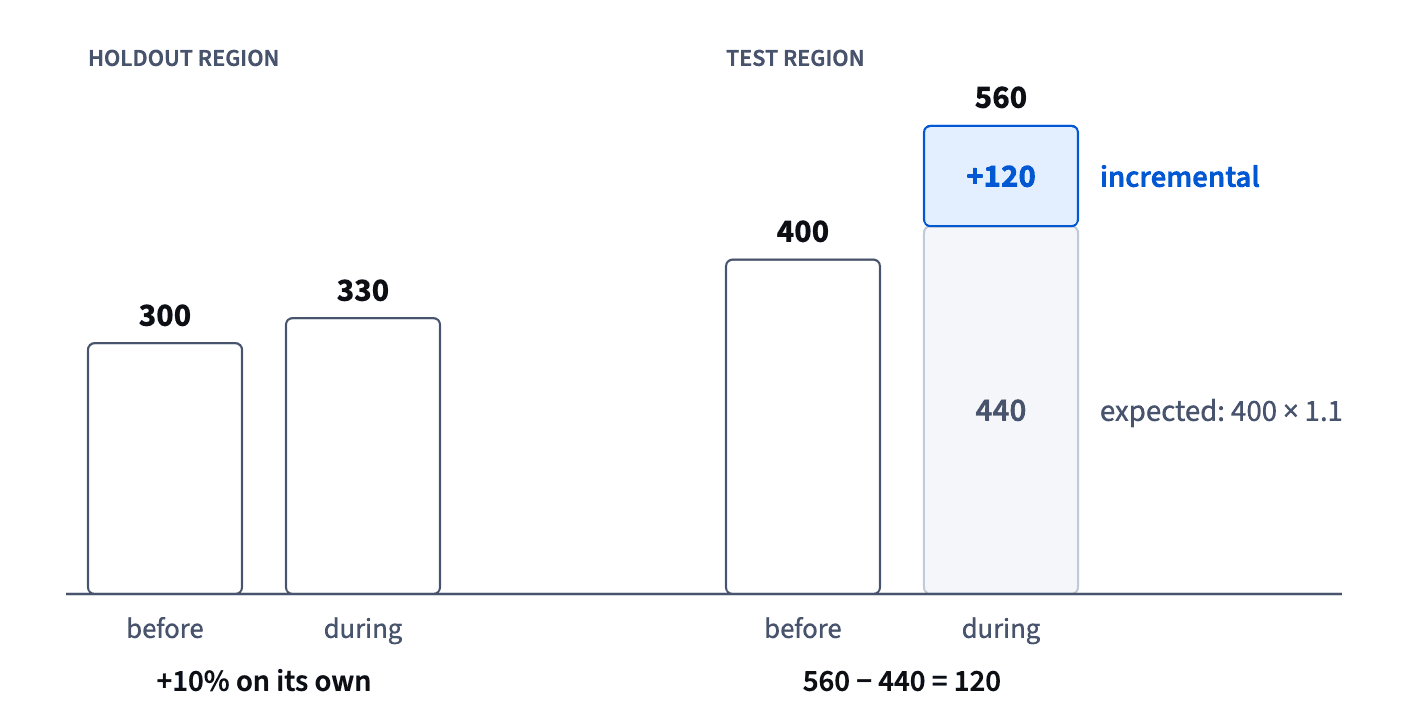
A holdout, a similar region or group that doesn't get the campaign, supplies it. If the holdout grew from 300 to 330, +10%, over the campaign period, the test region's 400 before the campaign would likely have become 400 × 1.10 = 440 on its own. Only what the test region gets above 440 belongs to the campaign.
Two slips are common. Using the test region's own before-and-after change, 560 − 400, as the effect, which credits the campaign with growth that happened everywhere. And picking a holdout that isn't comparable, such as a region with a different season or audience, so its growth is a bad guess for the test region's.
A good holdout is chosen before the campaign starts, not after the results are in.
- Do400 × 1.10 = 440 expected without the campaign
- Don't"Referrals went from 400 to 560, so the campaign added 160"
Ignores the growth that happened anyway.
Incremental cost: divide by what the spend added
Once the baseline is built, the cost of a campaign is divided by what it actually added. Take a referral campaign that cost 36,000 UAH: the test region went from 400 to 560 referrals, and a holdout says 440 would have come anyway. Actual 560, expected 440, incremental = 560 − 440 = 120 referrals. At 36,000 UAH, that's 300 UAH per incremental referral.
The report that said 36,000 ÷ 560 = 64 UAH per referral counted the 440 that would have come anyway. Dividing by the raw change, 560 − 400 = 160, gives 225 UAH and still credits the campaign with growth that happened everywhere. Incremental CAC works the same way: extra spend divided by the customers the spend added.
How it fits together: every number in module 3 is a share or an average, and each needs the right weights and the right denominator: the whole a part belongs to, everyone you paid for, and only what the spend actually changed. Next module: squares, roots and distances.
- Do36,000 ÷ 120 = 300 UAH per incremental referral
- Don't36,000 ÷ 560 = 64 UAH per referral
Counts referrals that would have come anyway.
Ready to practise?
Answer the lesson's exercises and earn 250 points the first time you finish it.
Start the exercises