

Tracking plan template: what a tracking plan is, a filled-in example and a QA checklist
What a tracking plan is, and a free tracking plan template in six sections: questions, events, properties, metric definitions, QA, change log, with an example.
By Sergey BruhPublished 9 min read
A tracking plan is the shared document that lists which events a product logs, with which properties, and which question each one answers. A good tracking plan template has six sections, filled in this order: the questions the feature must answer, the events that answer them, the properties on each event and user, the metric definitions built from them, the QA checks before launch and a change log. The order matters. A plan that starts from the screens logs every tap and still misses the one property a real decision needs; a plan that starts from the questions logs less and answers more. Below you'll find the template itself, naming rules that keep it readable, and a filled-in example for a new feature in Halves, a fictional expense-splitting app, including the first week of data and the traps it caught.
What is a tracking plan?
A tracking plan is a shared document that lists what the product logs and why: each question, the events and properties that answer it, where each event is logged and how it's checked. It's written before the code, by the PM with an analyst and a developer, and kept up to date after launch. Without one, every team names events its own way, nobody knows whether purchase fires on the tap or on the confirmed payment, and each metric needs an archaeology session before anyone trusts it.
The tracking plan template
Copy the six sections into a doc or a spreadsheet, one plan per feature or area.
1. Header and questions
2. Events
3. Properties
Event properties describe one moment (an amount, a method); user properties describe the person across events (sign-up channel, platform, time zone). The quick test: could the value differ between two events a minute apart? Then it belongs on the event.
4. Metric definitions
For every number the decision needs: the qualifying event, the unit counted (users, groups, distinct ids), exclusions, the time window and the time zone. The metric definition lesson shows why two people get different numbers without all five.
5. QA checklist
What to trigger on a test account and what to look for in the raw rows (see the checklist below).
6. Change log
Date, what changed (new event, renamed property, a bug fixed), who changed it and which dashboards it affects.
Event naming rules: a simple event taxonomy
- Object plus past-tense verb, in snake_case:
expense_added,group_created,receipt_scanned. One name on every platform; if one app logsaddExpense, every report shows two halves of one number. - Units in property names:
amount_usd,duration_ms. Nobody has to guess. - Closed lists for categories:
entry_methodismanual,receipt_scanorrecurring, never free text. - Ids that link events: give each object an id and carry it onto later events, so you can tell what the feature caused.
- Log decisions, not every tap. Each event has to stay correct through every release, so each one should serve a question.
Tracking plan example: itemized receipt splitting
Halves lets people scan a receipt to add an expense. The new feature reads each line of the receipt, so a group can split a dinner by item: the person who had the soup pays for the soup. Receipt scanning is part of the paid Halves Plus plan.
Questions
Maya, the product lead, will decide after six weeks whether to keep item splitting in Plus, open it to everyone or drop it. The plan answers:
- Q1. How often does the scanner read a receipt successfully?
- Q2. Of the receipts read successfully, what share end up split by item?
- Q3. Do item-split expenses get edited less often than other expenses (fewer disputes)?
- Q4. Does the feature bring free users to the Plus paywall?
Events
User properties: is_internal, acquisition_channel, plan (free / plus), timezone. Two events already existed (expense_added, paywall_viewed); the plan adds properties to them instead of inventing new events. Parsing happens on the server, so receipt_parsed is a server-side event: it's logged even if the phone goes offline, and it isn't user activity.
One definition written in full
Receipt read rate: distinct receipt_id with receipt_parsed and status = success, divided by distinct receipt_id with receipt_scanned, per calendar week in UTC. Accounts with is_internal = true or acquisition_channel = staff are excluded.
The first week of data, and what the definition saved
In the beta week the log showed:
- 1,240
receipt_scannedrows, but only 1,150 distinctreceipt_id: 90 rows were retries on a slow network, the same scan sent twice. - 50 of the 1,150 receipts came from the QA team's accounts, which leaves 1,100 real receipts.
- 990
receipt_parsedrows withstatus = success, of which 44 belonged to QA receipts, which leaves 946 real successes.
Counted naively, rows over rows:
990 ÷ 1,240 = 0.798, so 79.8%
Counted by the definition, distinct real receipts:
946 ÷ 1,100 = 0.860, so 86.0%
Same week, same log, a gap of 6.2 percentage points. The naive number would have sent the team to fix a scanner that works better than it looked. For Q2: 568 of the 946 successfully read receipts became expenses with split_type = by_item, so 568 ÷ 946 = 60.0% of readable receipts were split by item.
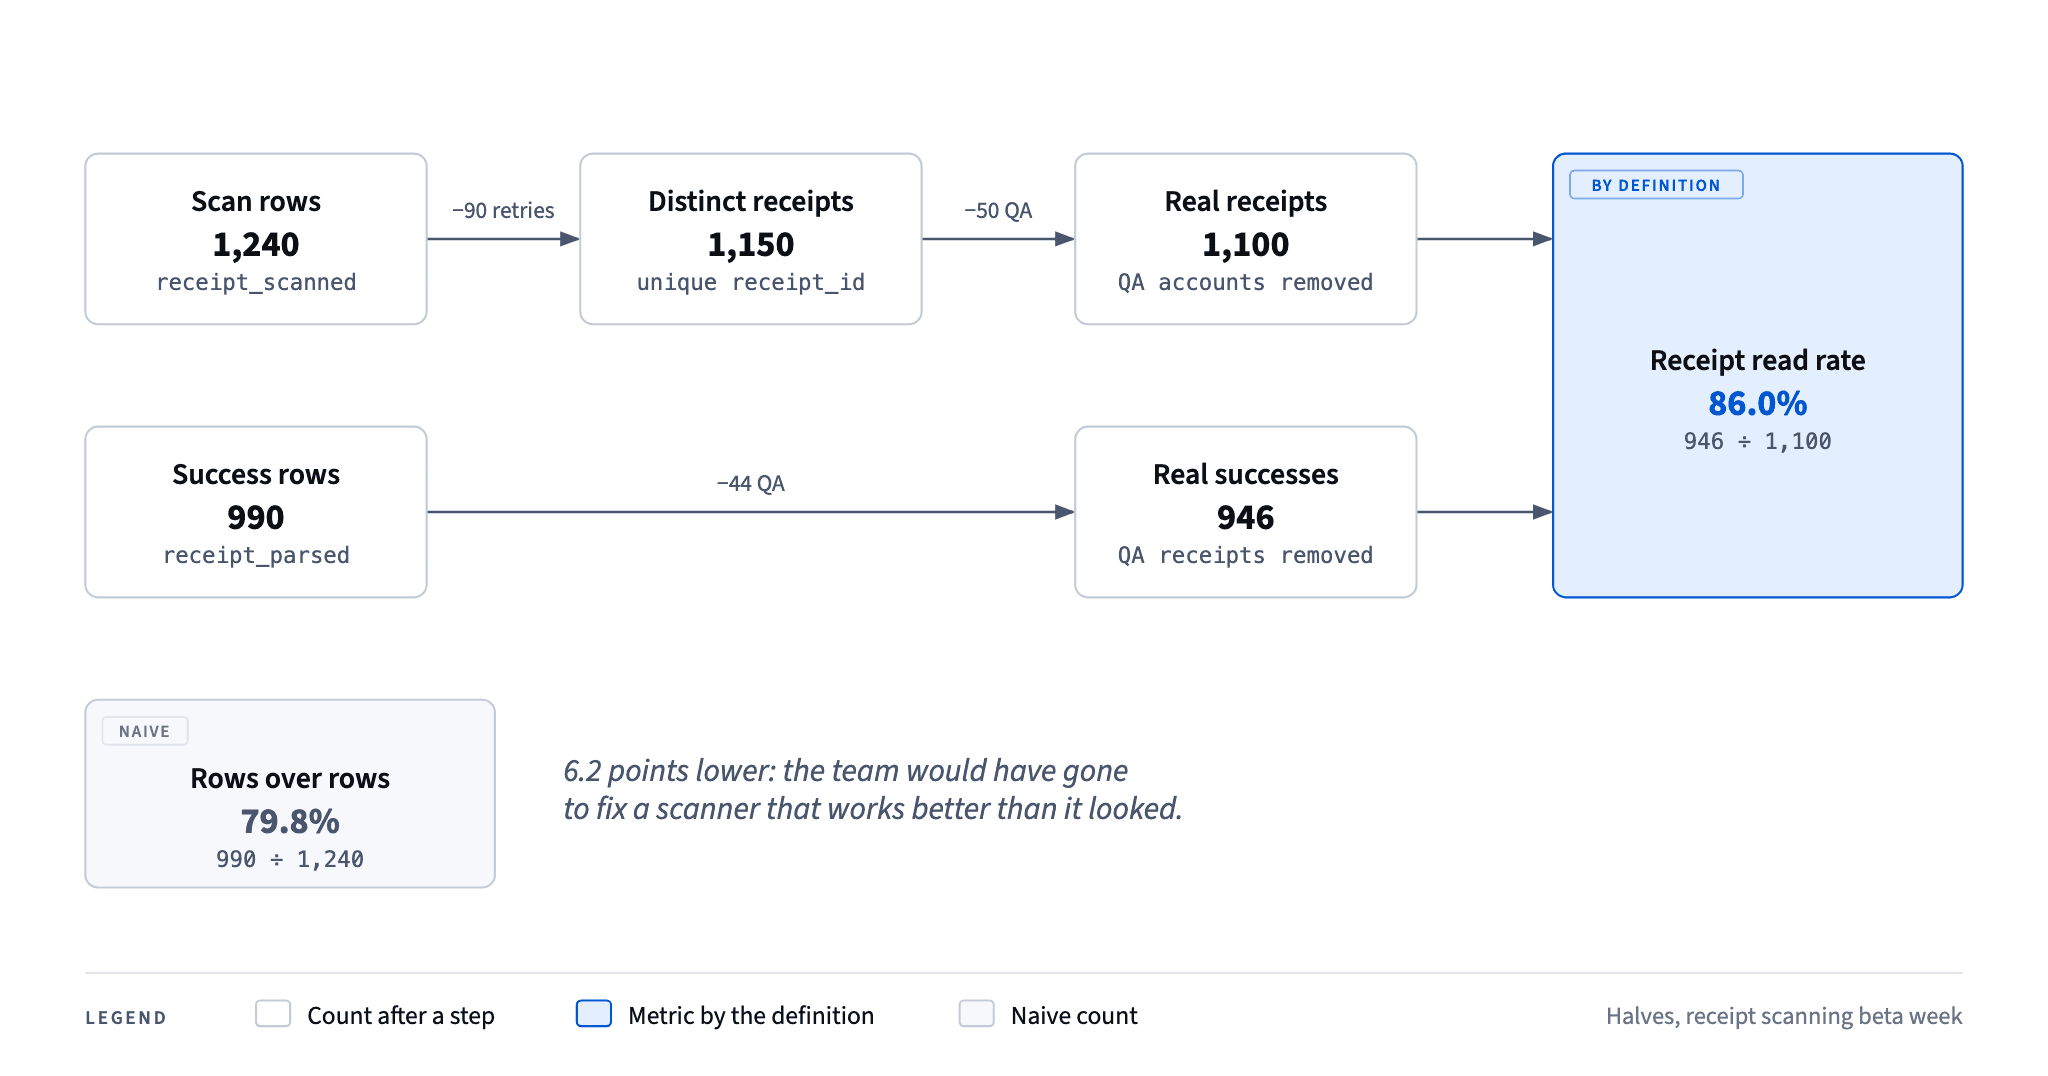
The duplicate rows were a bug, not a feature of the data: QA should have caught receipt_scanned firing twice on a retry. The team fixed it and wrote it in the change log.
The QA checklist before launch
On a test account, trigger every event in the plan and read the raw rows, not a dashboard:
- Fires once. One action, one row, including on retries, slow networks and double taps.
- Properties filled. No empty ids, units as named, values from the closed list only.
- Same name everywhere. iOS, Android and the server use identical event and property names.
- Ids link up. The
receipt_idon the scan appears on the parse result and on the expense. - Test accounts flagged. Every QA account has
is_internal = true; this is internal traffic, and a half-set flag is a common source of wrong numbers. - Time zone kept. Events are in UTC; the user's
timezonelets you see local times, for example when a reminder arrived. - Server events separated. Anything the server does on its own is marked as such and never counted as activity.
Common mistakes
- Starting from the screens. You get a hundred events and still can't answer Q3.
- Adding properties after launch. You can't add a property to last month's events; the first weeks of data are lost for that question.
- A plan that lives in one person's head. If the plan isn't where the team looks, it doesn't exist.
- No link to the decision. An event nobody needs for a question is noise that someone has to keep correct forever.
- Counting rows instead of units. Retries, two-sided confirmations and QA taps all inflate row counts; definitions should count distinct ids or users.
Key takeaways
- A tracking plan template has six sections: questions, events, properties, metric definitions, QA and a change log.
- Start from the decision and its questions; every event must answer at least one.
- Name events as object plus past-tense verb, put units in property names and link events with ids.
- Write each metric definition in full: event, unit, exclusions, window, time zone.
- QA the raw rows before launch: in the Halves example, the definition turned a misleading 79.8% into the real 86.0%.
FAQ
Who should own the tracking plan?
The PM owns the questions and the decision; an analyst owns the definitions; developers own the implementation and the QA. One person keeps the document current, and every change goes into the change log.
Should I use a spreadsheet or a document?
Either works. A spreadsheet suits the events and properties tables; a doc suits the questions and definitions. What matters is one place, linked from the feature spec.
How many events should a feature have?
As few as the questions need. For a typical feature, four to eight events, often including existing ones with new properties, is plenty.
What's the difference between a tracking plan and an event taxonomy?
The taxonomy is the naming system for all events across the product. A tracking plan applies it to one feature and adds the questions, definitions and checks.
Learn it hands-on
Build a tracking plan yourself for a new Halves feature in the free lesson A tracking plan for a new feature. If events and properties are new to you, start with Events, properties and users. Once the data is flowing, turn it into a goal with north star metric examples and follow new users through the feature with funnel analysis; the bigger picture is in what product analytics is.