

Theory
Trend and range
Tell an uptrend, a downtrend and a sideways range apart by their highs and lows, and see why the same rule wins in one and loses in another.
~9 min read · 9 exercises · 250 points
Before you start
Up, down or sideways?
Back on your Pebble practice account, today's question is easy to ask and easy to get wrong: which way is the market going? Marc has brought 120 days of Bluefin Energy and squeezed every two weeks into one block.
After reading single candles last lesson, you'll now step back to the bigger picture: how to tell a trend from a sideways range by its highs and lows, and why calling the direction early is harder than it looks.
Three shapes a market can take
Prices never move in a straight line; they swing up and down. Look at the tops and bottoms of those swings and almost any stretch of a chart falls into one of three shapes.
- Uptrend: each swing makes a higher high and a higher low. The price climbs in steps.
- Downtrend: the mirror image, lower highs and lower lows.
- Trading range (sideways): the highs stall at about the same price, the lows too, and the price bounces between them.
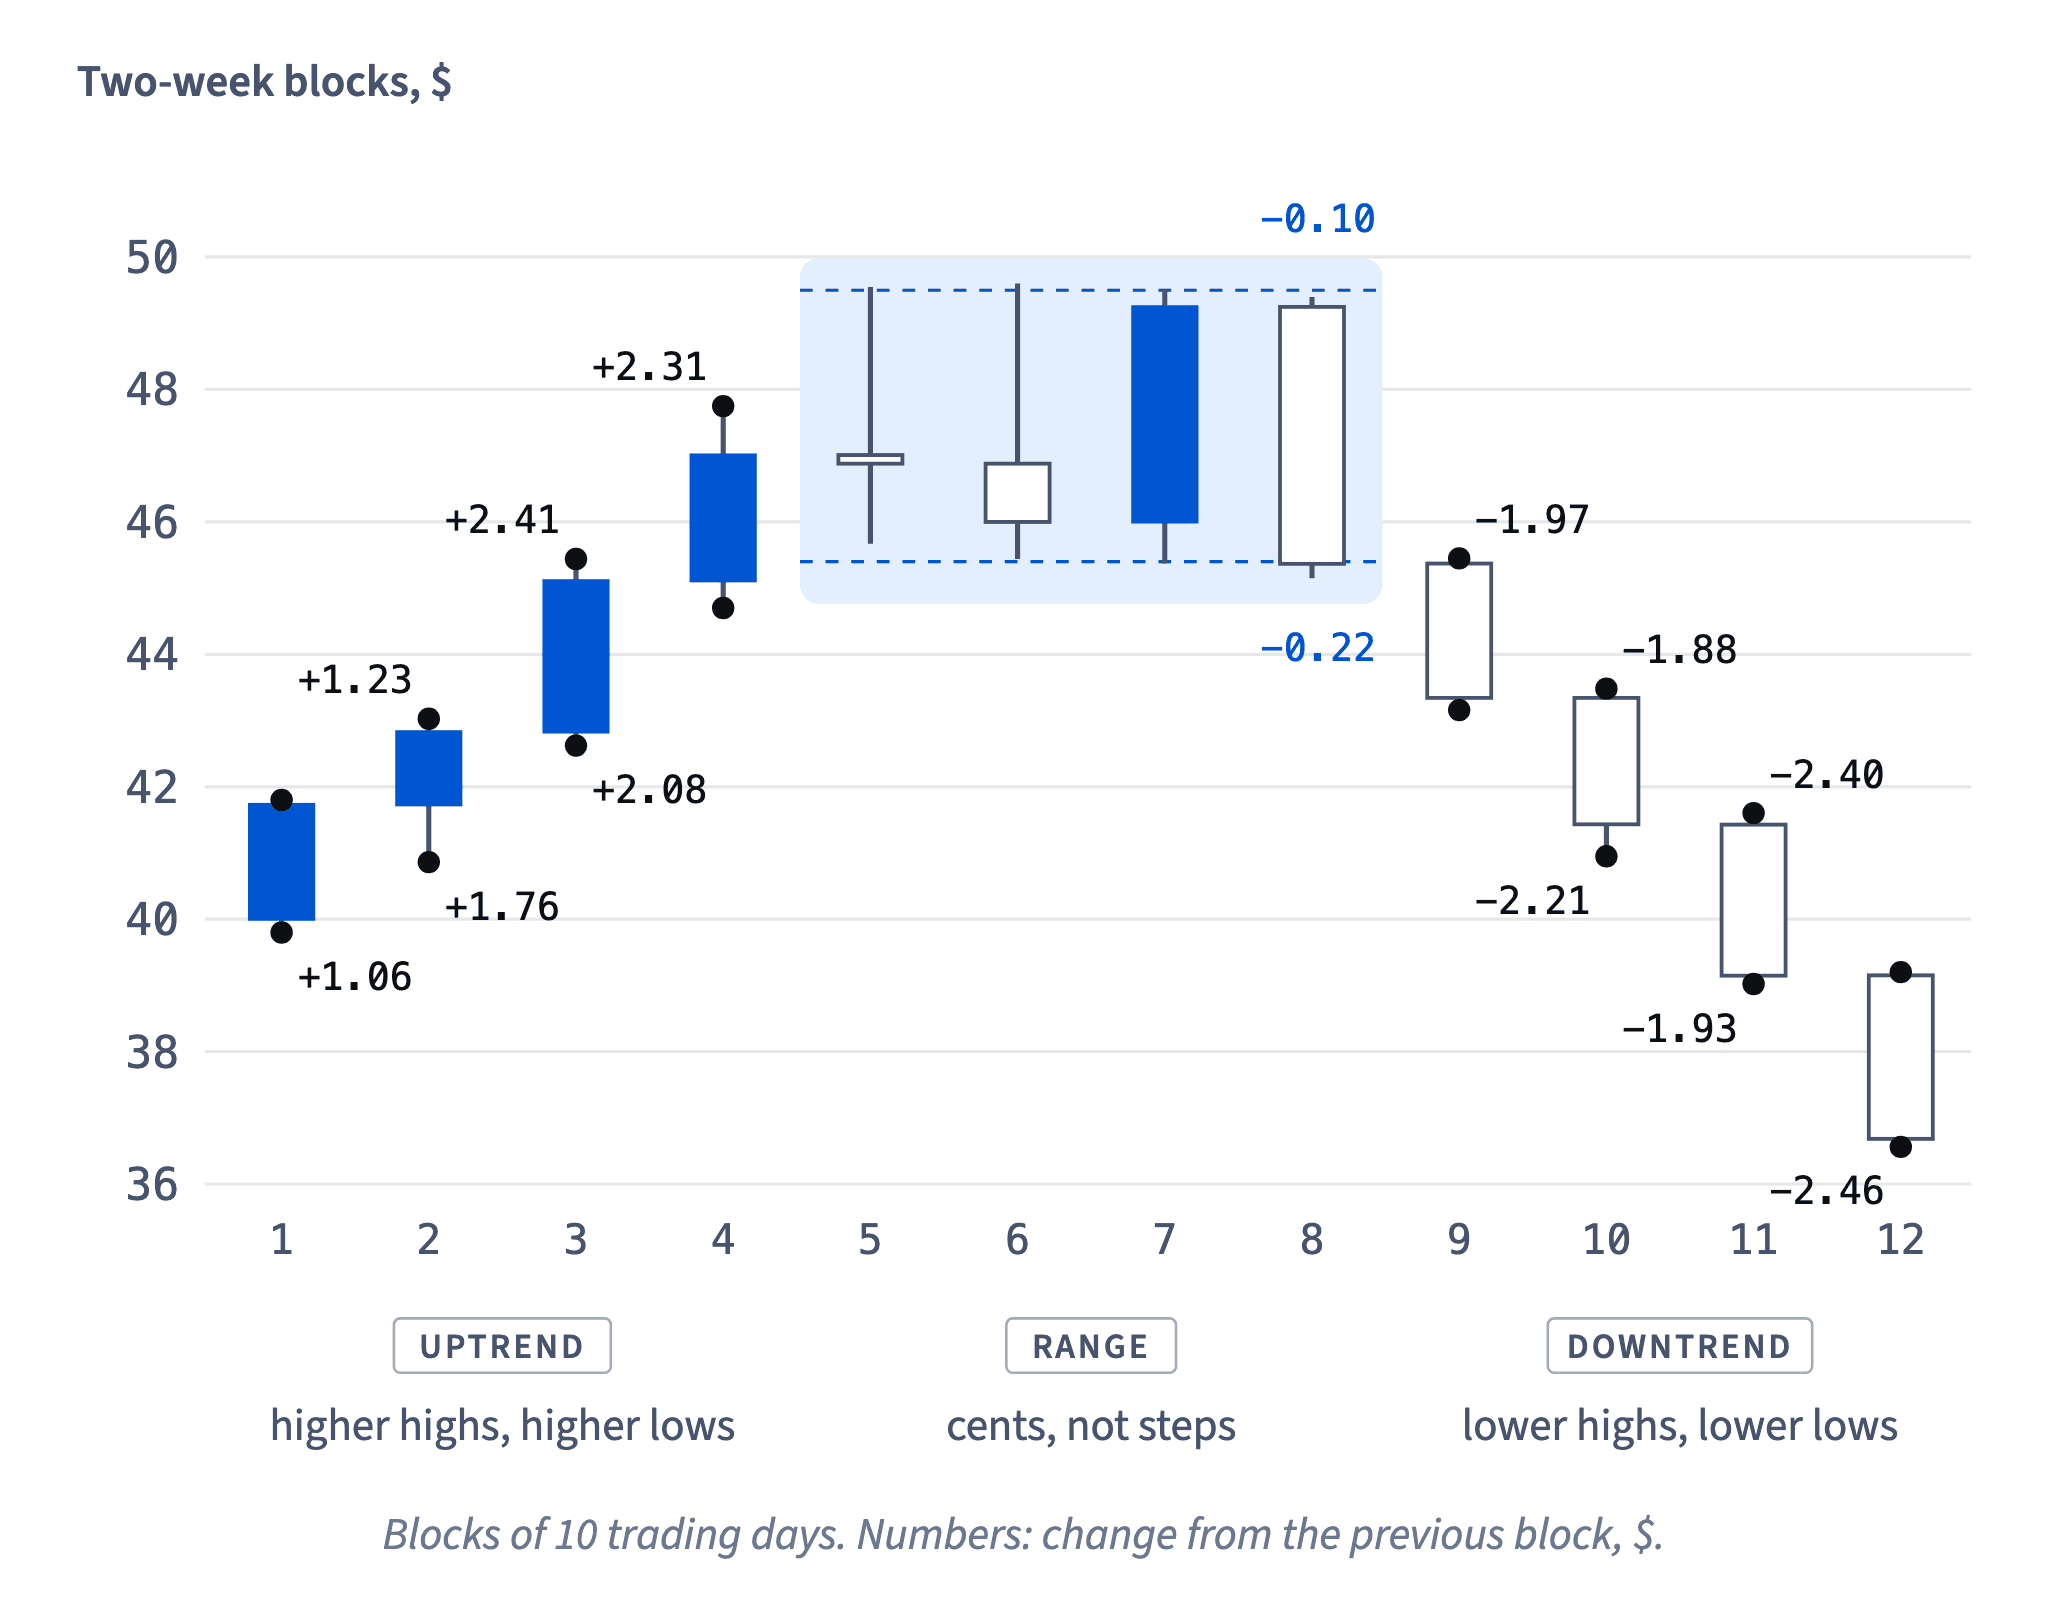
Bluefin Energy over 120 days shows all three. In the first two-week blocks the highs went 41.80, 43.03, 45.44, 47.75 and the lows 39.80, 40.86, 42.62, 44.70: an uptrend. Then the highs sat near 49.50 for two months, and then both stepped down.

These are descriptions of what the price did. They are not forecasts: on the last day of an uptrend, nothing on the chart announces it's the last day.
- Do"Highs 41.80 → 47.75 and lows 39.80 → 44.70 in steps: that stretch was an uptrend."
- Don't"Mostly green candles this month, so it's trending up."
Trend is read from swing highs and lows, not from candle colours.
Reading trend from two-week blocks
Daily candles are busy, so it helps to squeeze them into bigger blocks before judging the shape. Marc takes every 10 trading days of Bluefin Energy and keeps three numbers: the block's highest high, its lowest low and its last close. Twelve blocks cover 120 days.
Chart data
| Block | Block high | Block low | Block close |
|---|---|---|---|
| 1 | 41.8 | 39.8 | 41.73 |
| 2 | 43.03 | 40.86 | 42.83 |
| 3 | 45.44 | 42.62 | 45.11 |
| 4 | 47.75 | 44.7 | 47.01 |
| 5 | 49.55 | 45.67 | 46.88 |
Show 7 more rows
| 6 | 49.6 | 45.44 | 46 |
| 7 | 49.5 | 45.37 | 49.25 |
| 8 | 49.4 | 45.15 | 45.37 |
| 9 | 45.45 | 43.16 | 43.34 |
| 10 | 43.48 | 40.95 | 41.43 |
| 11 | 41.6 | 39.02 | 39.15 |
| 12 | 39.2 | 36.56 | 36.68 |
Then read the highs and lows block by block:
- Blocks 1–4: highs 41.80, 43.03, 45.44, 47.75; lows 39.80, 40.86, 42.62, 44.70. Each step is one to two and a half dollars up: an uptrend.
- Blocks 5–8: highs 49.55, 49.60, 49.50, 49.40; lows between 45.15 and 45.67. Flat tops, flat bottoms: a trading range.
- Blocks 9–12: highs 45.45 → 39.20, lows 43.16 → 36.56, stepping down: a downtrend.
Blocks are one simple way to see swings without daily noise; there is no "correct" swing length. What matters is choosing one way and using it the same way every time, so you don't bend the picture toward what you hope to see.
- Do"I always use two-week blocks and read highs and lows the same way."
- Don't"Daily it looks like a range, but on blocks of three days it's an uptrend, so I'll go with that."
Switching the method until it shows what you want bends the picture.
A routine for labelling a chart
Labelling a chart by eye invites wishful thinking: a hopeful buyer sees an uptrend everywhere. A fixed routine keeps you honest.
- Fix the swing unit first, for example two-week blocks, and use it on every chart.
- Write down the highs and lows of each block.
- Compare direction: is each high above, below or level with the last one? Same for the lows.
- Compare size: are the steps as big as the ones before, or just a few cents?
- Label: uptrend, downtrend, range, or "not sure yet".
On Bluefin Energy this routine names blocks 1–4 an uptrend, 5–8 a range and 9–12 a downtrend. Step 4 is the one people skip, and it is what stops a 10-cent wobble from being called a new trend.
Chart: Bluefin Energy, two-week blocks · shown above
Remember what the label is: a description of the stretch behind you. It tells you what kind of market you were in, not what the next block will do.
- Do"Same blocks, same steps, every chart; when it's unclear I write 'not sure'."
- Don't"I'll decide it's an uptrend first and then find the highs that fit."
Steps or noise? Compare the size
The direction of one high or low isn't enough; look at the size of the step too.
Inside Bluefin Energy's range, block 8's high (49.40) was lower than block 7's (49.50), and its low was lower too (45.15 against 45.37). Read mechanically, that's "lower high, lower low", a downtrend. But the steps were 10 and 22 cents, while each step in the uptrend had been one to two and a half dollars. A few cents inside a range is noise, not a new trend.
Picture: Compare the size of the steps, not just their direction. · shown above
The same goes for single closes. Block 7 closed at 49.25, near the top of the box, and looked strong. Its high was still below block 6's, and block 8 fell back to 45.37.
A careful habit: call a new trend only when the steps are clear in size and repeat. Until then, "not clear yet" is a fine answer, and it's cheaper than acting on a guess.
- Do"Lower by 10 cents after dollar-sized steps up? That's noise in the box."
- Don't"One strong close at the top: the new uptrend has started."
Test a rule on every stretch
A trading rule is only as good as its whole record, after costs, across every kind of market it ran in.
Nora's rule: buy 100 Bluefin Energy shares when the close is the highest of the last 10 days, sell five days later, no stop, 4 dollars of costs per round trip (spread and commission, as in Where the money goes: spread, fees and slippage). Run one trade at a time over all 120 days:
- Uptrend (days 1–40): 4 trades, 3 wins: −55, +215, +66, +137. Net +363.
- Range (days 41–80): 3 trades, 0 wins: −221, −363, −151. Net −735.
- Downtrend (days 81–120): no trades, since there was never a new 10-day high.
Total: 363 − 735 + 0 = −372 dollars.
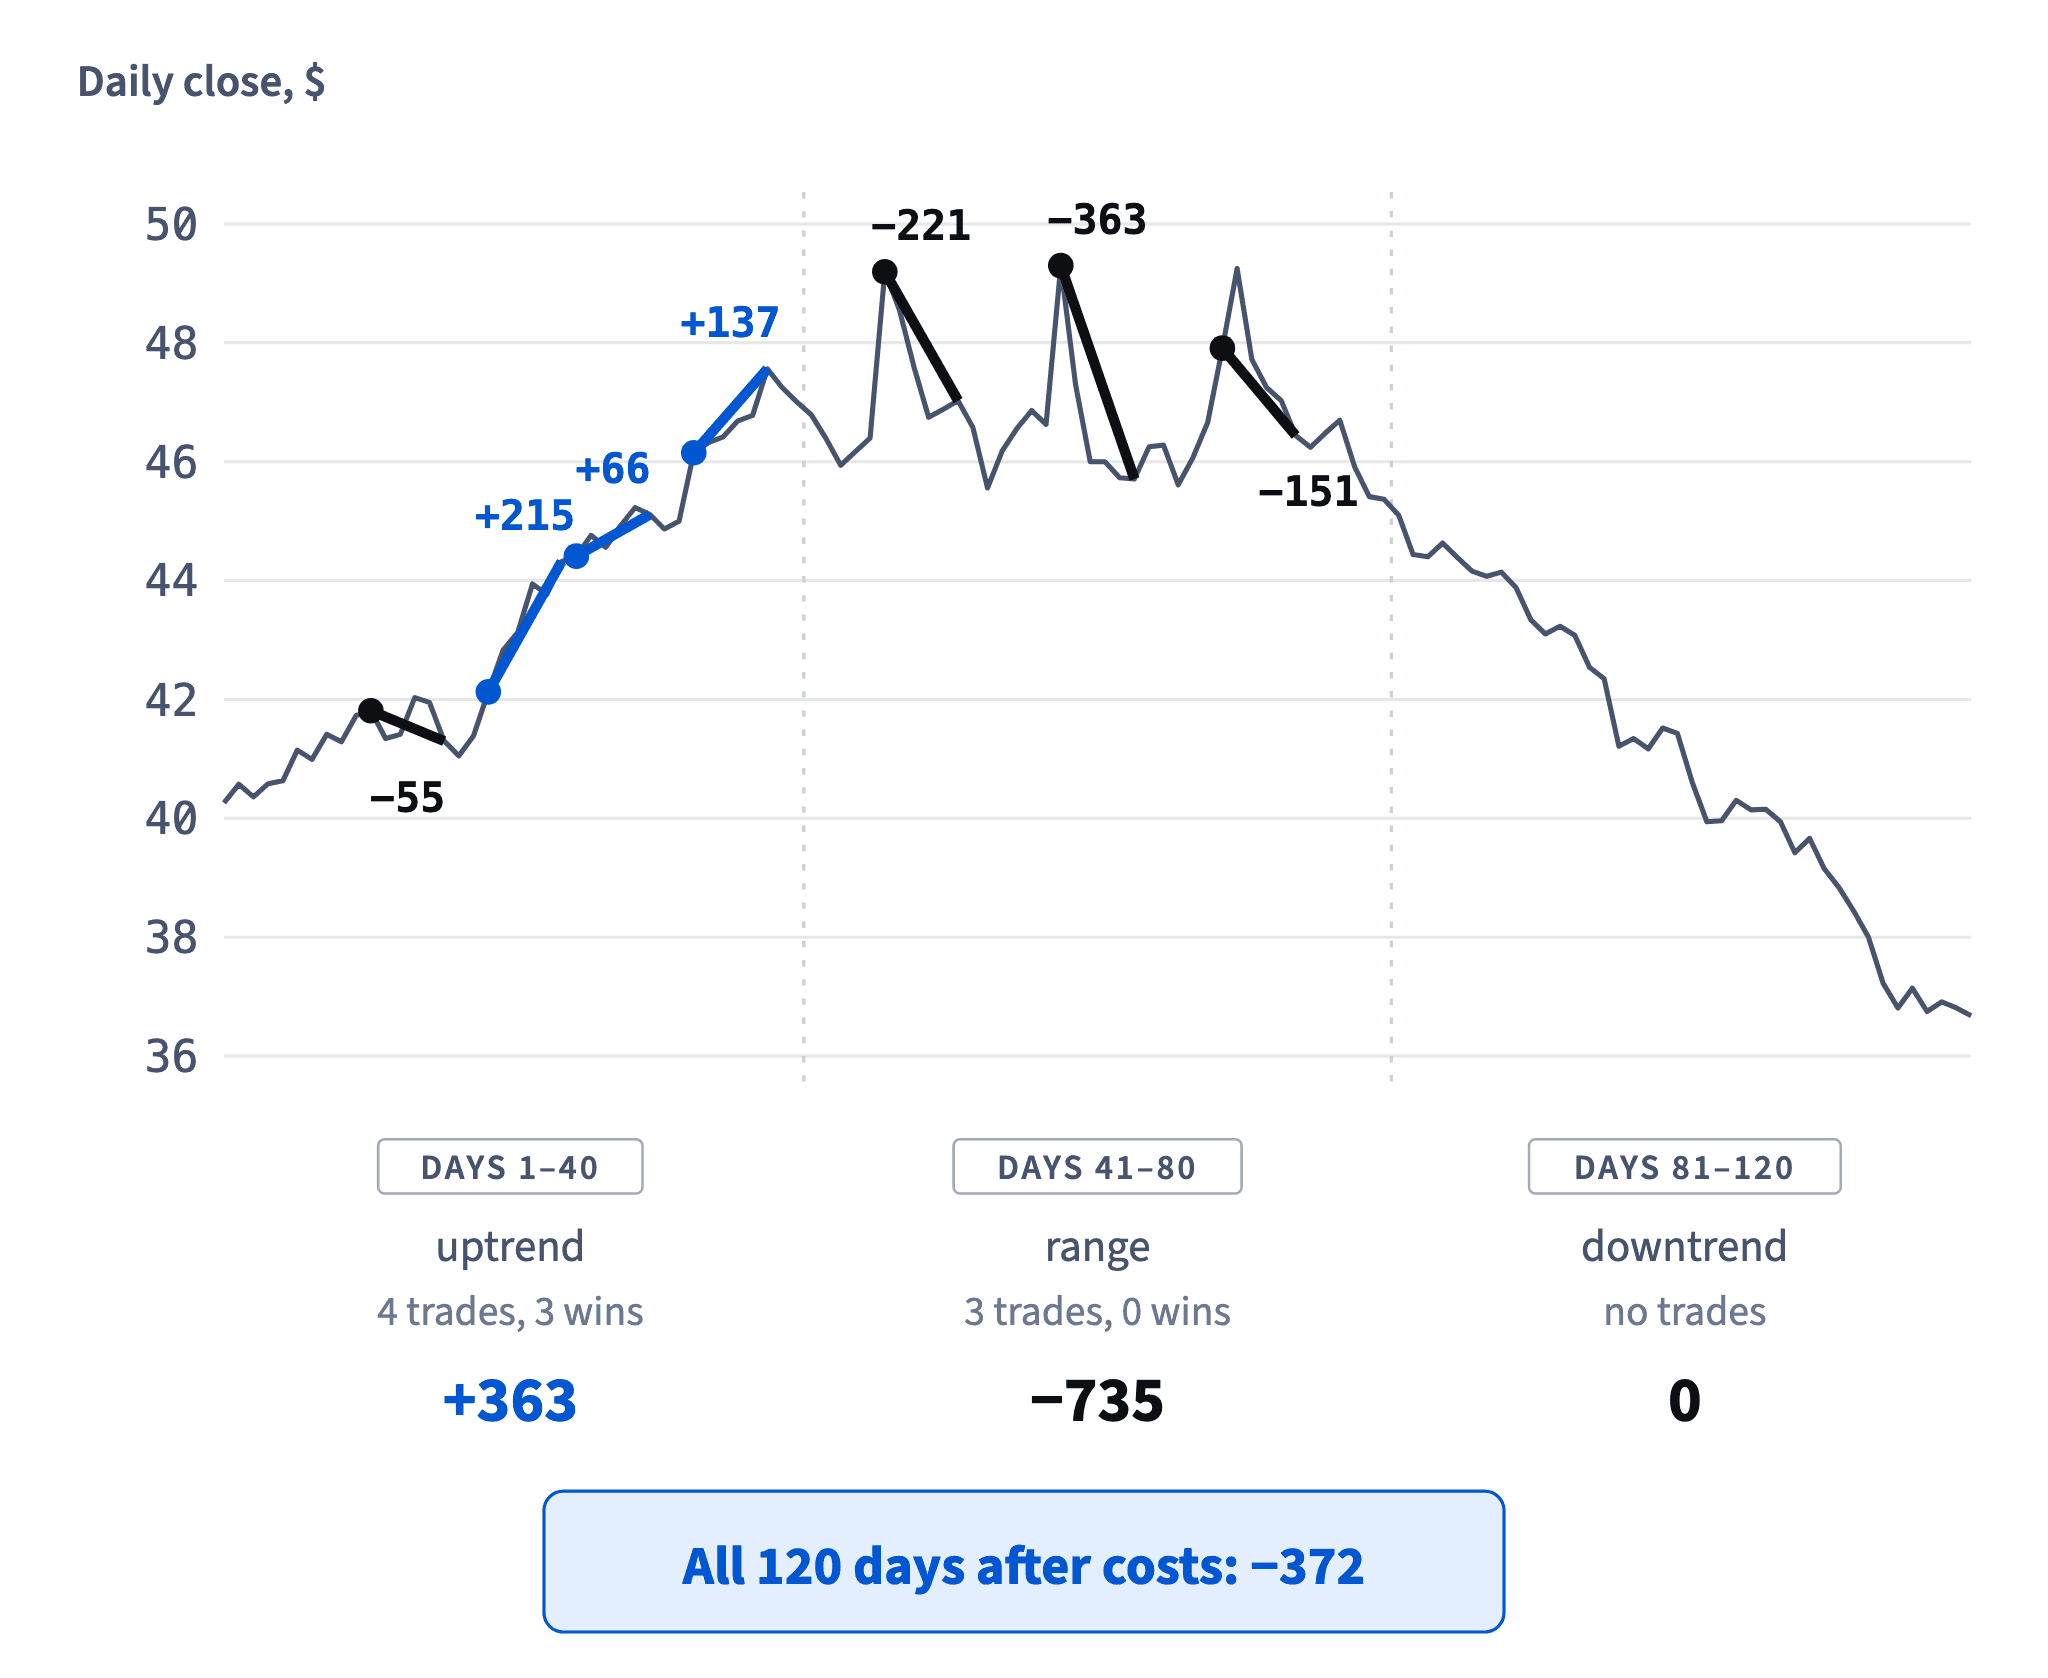
The trap is the screenshot. The good stretch is the one people share, so it is the one you see. A rule's record has to include the dull and the painful stretches too, or it isn't a record.
- Do"+363 in the trend, −735 in the range: −372 over the whole file, after costs."
- Don't"Look at this screenshot of days 1–40: the rule works."
One good stretch is not a record.
Why the same rule wins in a trend and loses in a range
Every rule quietly assumes something about the market. "Buy a new 10-day closing high" assumes that strength tends to continue. That assumption fits one kind of market and fails in another.
- In an uptrend, a new 10-day high often comes in the middle of the climb: the next steps up can still follow, so the rule rides some of them.
- In a range, a new 10-day high is simply the top of the box, the place where the price kept turning back down. On Bluefin Energy the rule bought there three times (at 49.20, 49.30 and 47.91) and lost 221, 363 and 151 dollars after costs.
- In a downtrend, there was never a new 10-day high, so the rule did nothing.
The costs and the share were identical in all three stretches; only the shape of the market changed. Before using any rule, ask: what market does it assume, and what happens to it in the other two?
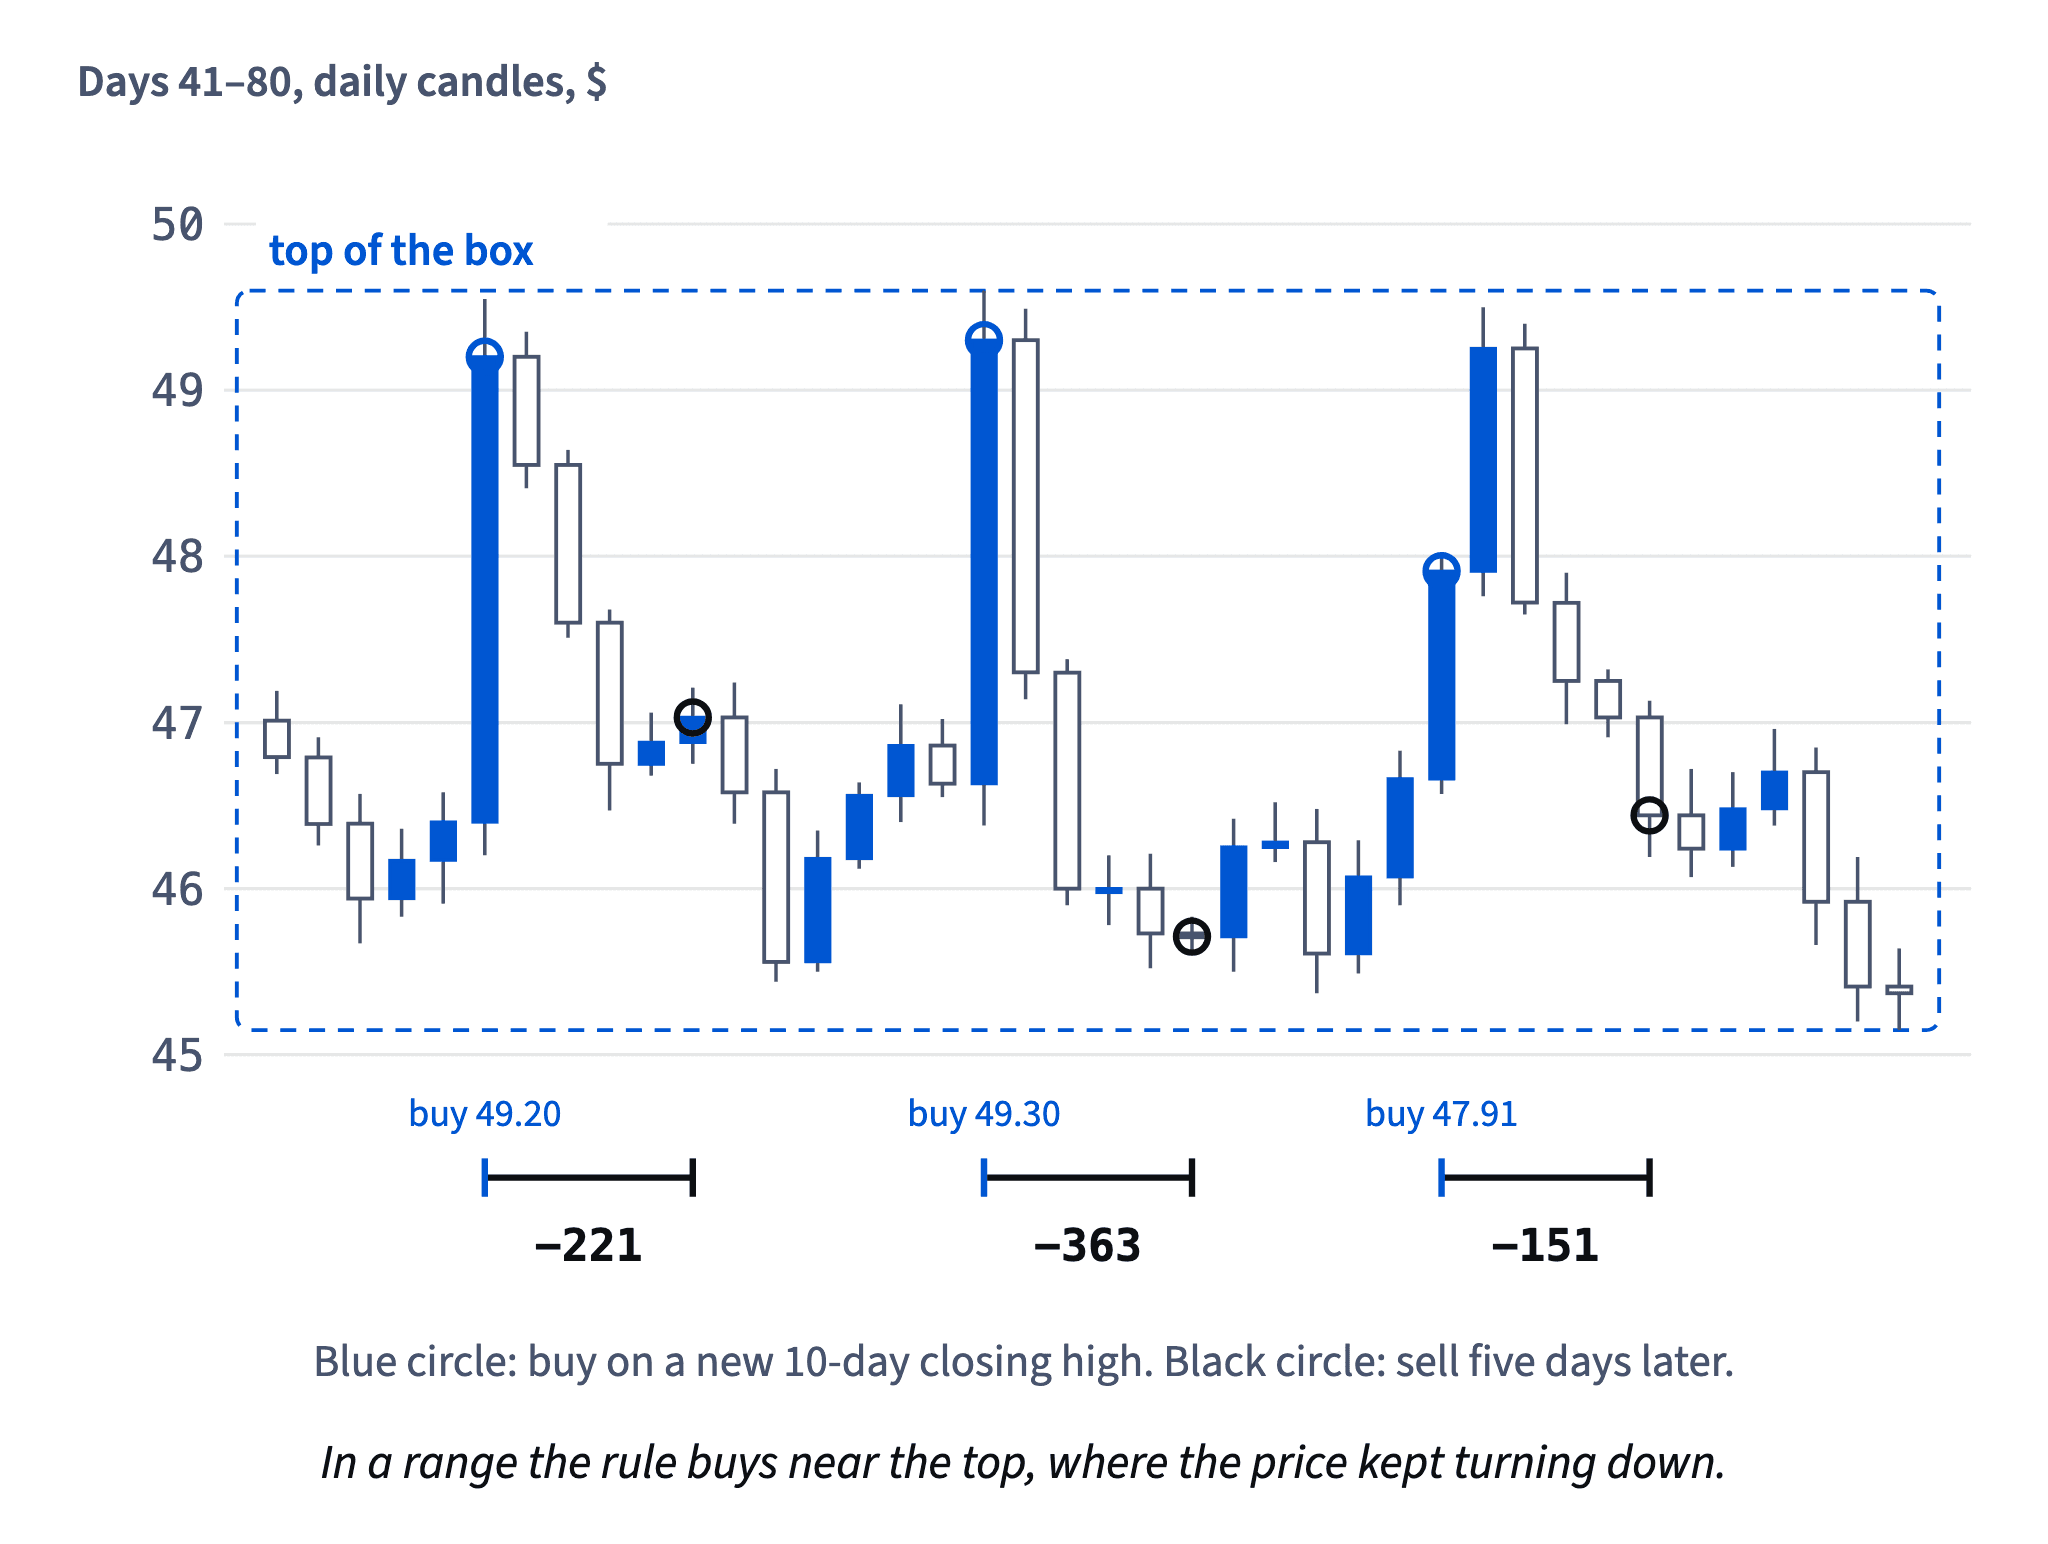
- Do"This rule follows strength, so it should suffer in ranges. Let's check how much."
- Don't"It lost in the range, so the share must be bad."
The same share paid the rule +363 in the uptrend.
What 7 trades can and can't tell you
Fair conclusions stick to what the data shows. Nora's rule made 7 trades on Bluefin Energy: +363 in the uptrend, −735 in the range, none in the downtrend. Those numbers are facts. So is the pattern behind them: the result depended on the kind of market.
Picture: The screenshot shows the first stretch; the record shows all three. · shown above
What 7 trades can't tell you is whether the rule works. Three wins out of four in the uptrend look impressive, but four trades are like a coin tossed four times. As this course keeps saying, judge a rule's numbers only on at least 30 trades, and more is better.
Two tempting conclusions fail:
- "It will win in the next uptrend": past wins on a handful of trades promise nothing.
- "Just use it in trends": that needs knowing you are in a trend while it happens, and a trend is clear only looking back.
The honest next step is to write the rule down and test it on many more trades, with costs, in trends and ranges alike.
- Do"7 trades, −372 after costs: too few to tell. Test it on 30+."
- Don't"3 wins out of 4 in the trend: the rule is proven."
A label looks back, not forward
Uptrend, downtrend and trading range are names for a stretch that is already over. They are useful: they tell you what kind of market a rule was tested in. They are not forecasts.
On Bluefin Energy, the last day of block 4 closed a clean uptrend: four higher highs, four higher lows. The next eight weeks were a flat box between about 45.50 and 49.50, where buying strength lost money three times. Nothing on the chart announced the change; it became clear only after a few blocks had formed.
Chart: Bluefin Energy, two-week blocks · shown above
So treat the label as context for a plan, never as permission to expect the next step. Your protection against being wrong is the stop from The stop: where it goes and why and the limit from Risk per trade: a small share of the account, not the label.
How it fits together: swings define the three shapes, a fixed routine and step size keep the label honest, and a rule's result depends on the shape it runs in. Next, Support, resistance and breakouts looks at the borders of a range and what happens when the price leaves them.
- Do"Blocks 1–4 were an uptrend. My stop still decides what I lose if that's over."
- Don't"It's an uptrend, so the next block will be higher."
Block 4 was followed by a flat range.
Ready to practise?
Answer the lesson's exercises and earn 250 points the first time you finish it.
Start the exercises