

Theory
Moving averages
Smooth the noise with an average of the last few closes, and see why every average arrives late in a trend and whips back and forth in a range.
~9 min read · 9 exercises · 250 points
Before you start
Which tools are worth your time?
You still have your Pebble practice account: 10,000 practice dollars and a small made-up market, so nothing here costs real money. This module asks one question: which of the lines and gauges that apps draw over a chart are worth your time, and what can't each of them tell you?
This lesson starts with the simplest one, the moving average. You'll compute it from Bluefin Energy closes, see why it always arrives late, and count what its crossings cost in a sideways market.
What a moving average is
A moving average is the average of the last N closes, recalculated every day. A 20-day average adds the last 20 closes and divides by 20; tomorrow the oldest close drops out and the newest comes in, so the line "moves" along the dates.
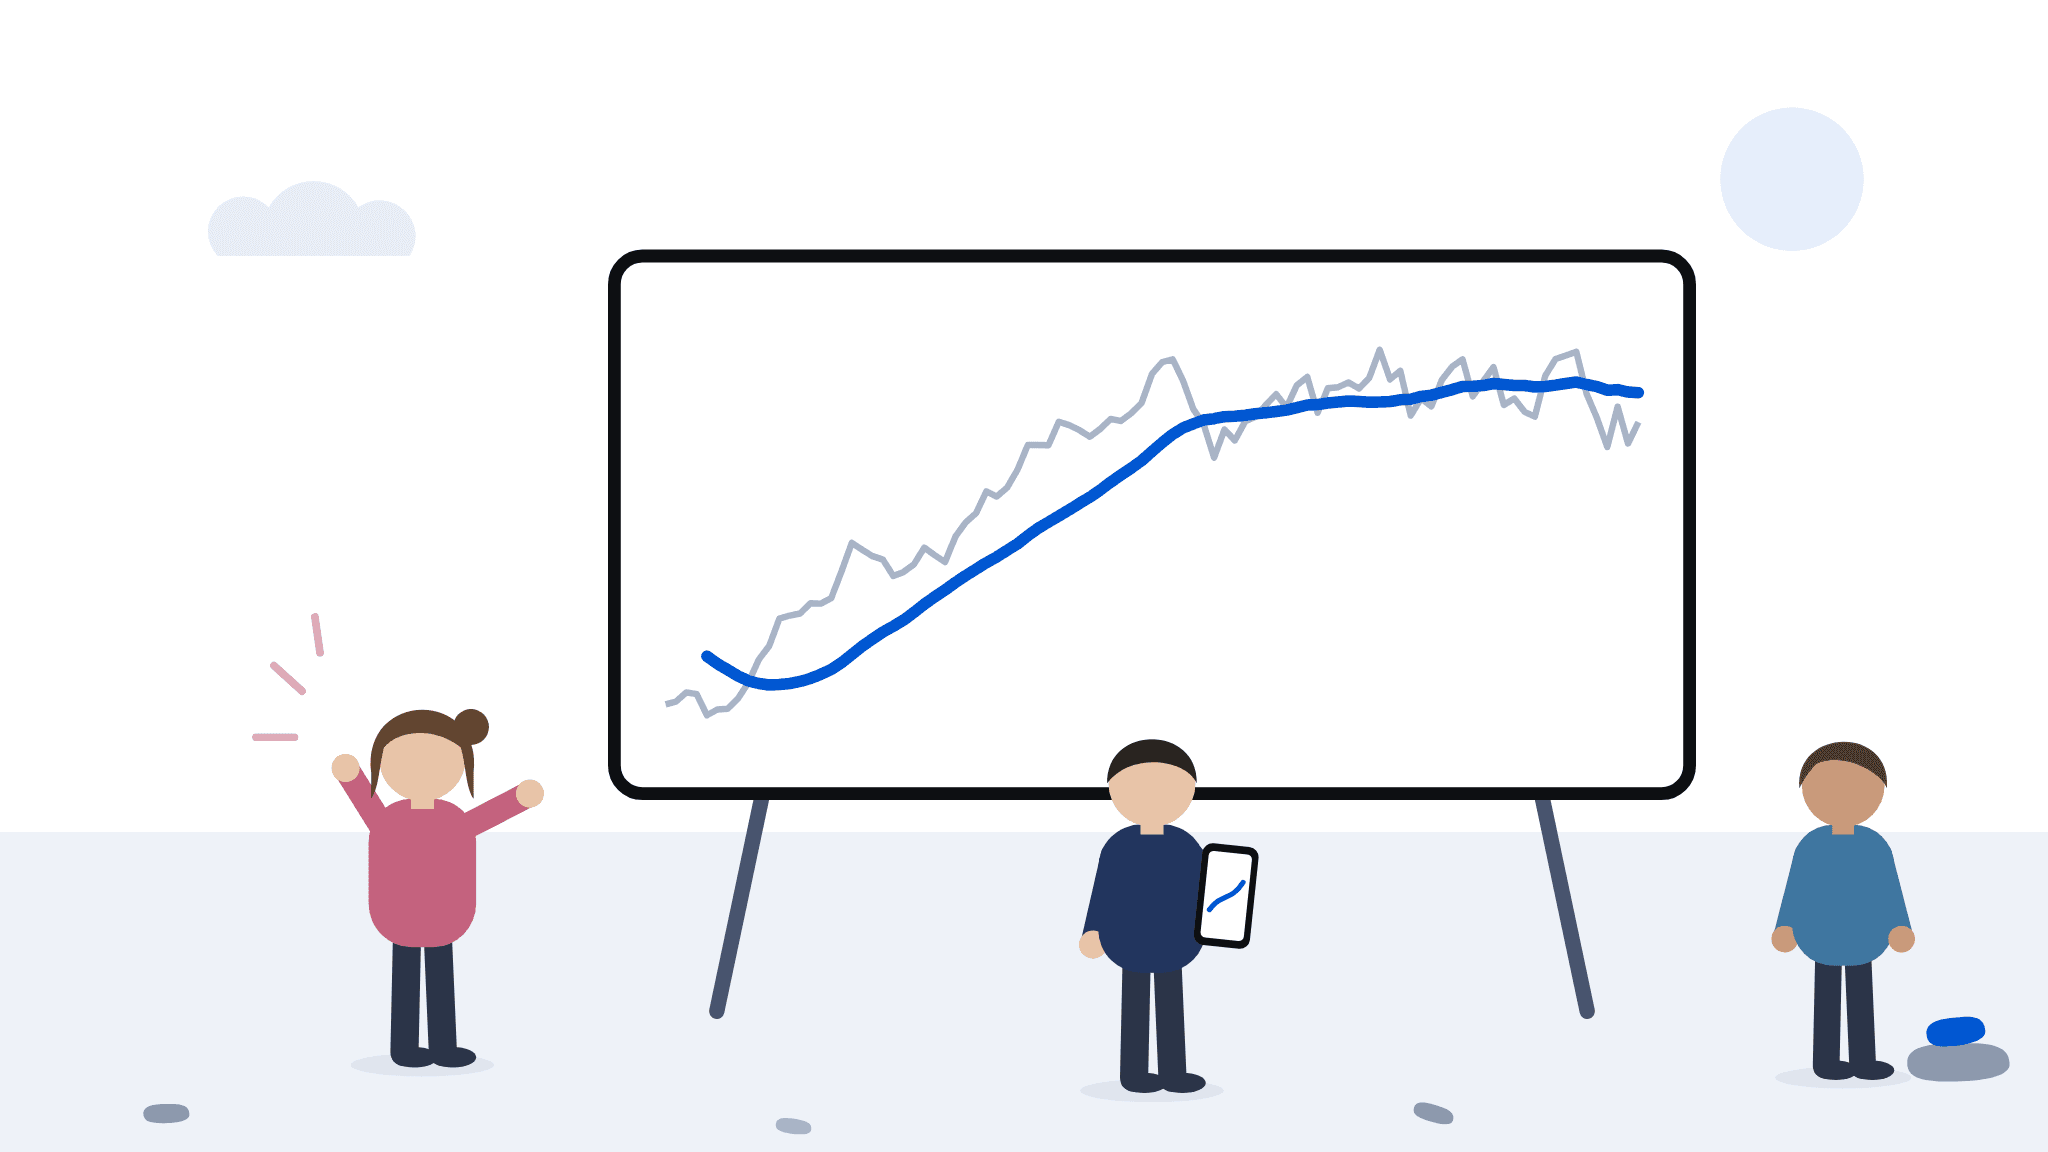
Its only job is to smooth. Daily closes jump around, and the average irons those jumps into one calm line, so the direction of the last few weeks is easier to see: rising, flat or falling.
Chart data
| date | Close | 20-day average |
|---|---|---|
| 2024-06-03 | 42.86 | |
| 2024-06-04 | 42.33 | |
| 2024-06-05 | 42.5 | |
| 2024-06-06 | 42.16 | |
| 2024-06-07 | 41.6 |
Show 105 more rows
| 2024-06-10 | 41.38 | |
| 2024-06-11 | 41.07 | |
| 2024-06-12 | 40.73 | |
| 2024-06-13 | 40.12 | |
| 2024-06-14 | 39.81 | |
| 2024-06-17 | 39.36 | |
| 2024-06-18 | 39.07 | |
| 2024-06-19 | 38.67 | |
| 2024-06-20 | 38.61 | |
| 2024-06-21 | 38.58 | |
| 2024-06-24 | 38.74 | |
| 2024-06-25 | 38.82 | |
| 2024-06-26 | 39.09 | |
| 2024-06-27 | 39.04 | |
| 2024-06-28 | 38.42 | 40.15 |
| 2024-07-01 | 38.59 | 39.93 |
| 2024-07-02 | 38.61 | 39.75 |
| 2024-07-03 | 38.91 | 39.57 |
| 2024-07-04 | 39.38 | 39.43 |
| 2024-07-05 | 40.05 | 39.35 |
| 2024-07-08 | 40.45 | 39.31 |
| 2024-07-09 | 41.25 | 39.32 |
| 2024-07-10 | 41.34 | 39.35 |
| 2024-07-11 | 41.4 | 39.41 |
| 2024-07-12 | 41.7 | 39.5 |
| 2024-07-15 | 41.69 | 39.62 |
| 2024-07-16 | 41.85 | 39.76 |
| 2024-07-17 | 42.63 | 39.96 |
| 2024-07-18 | 43.47 | 40.2 |
| 2024-07-19 | 43.27 | 40.44 |
| 2024-07-22 | 43.08 | 40.65 |
| 2024-07-23 | 42.98 | 40.86 |
| 2024-07-24 | 42.5 | 41.03 |
| 2024-07-25 | 42.62 | 41.21 |
| 2024-07-26 | 42.84 | 41.43 |
| 2024-07-29 | 43.33 | 41.67 |
| 2024-07-30 | 43.11 | 41.89 |
| 2024-07-31 | 42.91 | 42.09 |
| 2024-08-01 | 43.65 | 42.31 |
| 2024-08-02 | 44.07 | 42.51 |
| 2024-08-05 | 44.34 | 42.7 |
| 2024-08-06 | 44.98 | 42.89 |
| 2024-08-07 | 44.83 | 43.06 |
| 2024-08-08 | 45.09 | 43.25 |
| 2024-08-09 | 45.61 | 43.44 |
| 2024-08-12 | 46.34 | 43.68 |
| 2024-08-13 | 46.34 | 43.9 |
| 2024-08-14 | 46.33 | 44.08 |
| 2024-08-15 | 47.02 | 44.26 |
| 2024-08-16 | 46.92 | 44.44 |
| 2024-08-19 | 46.77 | 44.63 |
| 2024-08-20 | 46.58 | 44.81 |
| 2024-08-21 | 46.81 | 45.02 |
| 2024-08-22 | 47.1 | 45.25 |
| 2024-08-23 | 47.04 | 45.46 |
| 2024-08-26 | 47.27 | 45.66 |
| 2024-08-27 | 47.57 | 45.88 |
| 2024-08-28 | 48.42 | 46.15 |
| 2024-08-29 | 48.77 | 46.41 |
| 2024-08-30 | 48.85 | 46.65 |
| 2024-09-02 | 48.22 | 46.84 |
| 2024-09-03 | 47.39 | 46.96 |
| 2024-09-04 | 46.94 | 47.07 |
| 2024-09-05 | 45.97 | 47.11 |
| 2024-09-06 | 46.79 | 47.17 |
| 2024-09-09 | 46.47 | 47.18 |
| 2024-09-10 | 47.03 | 47.21 |
| 2024-09-11 | 47.16 | 47.25 |
| 2024-09-12 | 47.51 | 47.28 |
| 2024-09-13 | 47.83 | 47.32 |
| 2024-09-16 | 47.44 | 47.36 |
| 2024-09-17 | 48.09 | 47.43 |
| 2024-09-18 | 48.33 | 47.51 |
| 2024-09-19 | 47.28 | 47.52 |
| 2024-09-20 | 48 | 47.57 |
| 2024-09-23 | 48.03 | 47.6 |
| 2024-09-24 | 48.17 | 47.63 |
| 2024-09-25 | 47.99 | 47.61 |
| 2024-09-26 | 48.31 | 47.59 |
| 2024-09-27 | 49.13 | 47.6 |
| 2024-09-30 | 48.26 | 47.61 |
| 2024-10-01 | 48.51 | 47.66 |
| 2024-10-02 | 47.2 | 47.68 |
| 2024-10-03 | 47.7 | 47.76 |
| 2024-10-04 | 47.47 | 47.8 |
| 2024-10-07 | 48.24 | 47.88 |
| 2024-10-08 | 48.63 | 47.96 |
| 2024-10-09 | 48.85 | 48.05 |
| 2024-10-10 | 47.76 | 48.06 |
| 2024-10-11 | 48.2 | 48.08 |
| 2024-10-14 | 48.62 | 48.14 |
| 2024-10-15 | 47.51 | 48.11 |
| 2024-10-16 | 47.7 | 48.08 |
| 2024-10-17 | 47.31 | 48.08 |
| 2024-10-18 | 47.17 | 48.04 |
| 2024-10-21 | 48.36 | 48.05 |
| 2024-10-22 | 48.86 | 48.09 |
| 2024-10-23 | 48.96 | 48.14 |
| 2024-10-24 | 49.07 | 48.18 |
| 2024-10-25 | 47.83 | 48.11 |
| 2024-10-28 | 47.12 | 48.05 |
| 2024-10-29 | 46.28 | 47.94 |
| 2024-10-30 | 47.46 | 47.96 |
| 2024-10-31 | 46.38 | 47.89 |
| 2024-11-01 | 47.01 | 47.87 |
That makes it a summary of the past, not a forecast. It holds no information that isn't already in the closes it was built from. On Pebble's Bluefin Energy chart the smooth line looks clever, but it is arithmetic anyone can redo with a calculator.
Use it as a backdrop that describes where the price has been. Treat any claim that the line "knows" what comes next with suspicion.
- Do"The 20-day average is rising: the last month has been higher than the month before."
- Don't"The price crossed the line, so it is going to rise."
A crossing describes what already happened.
Computing a moving average step by step
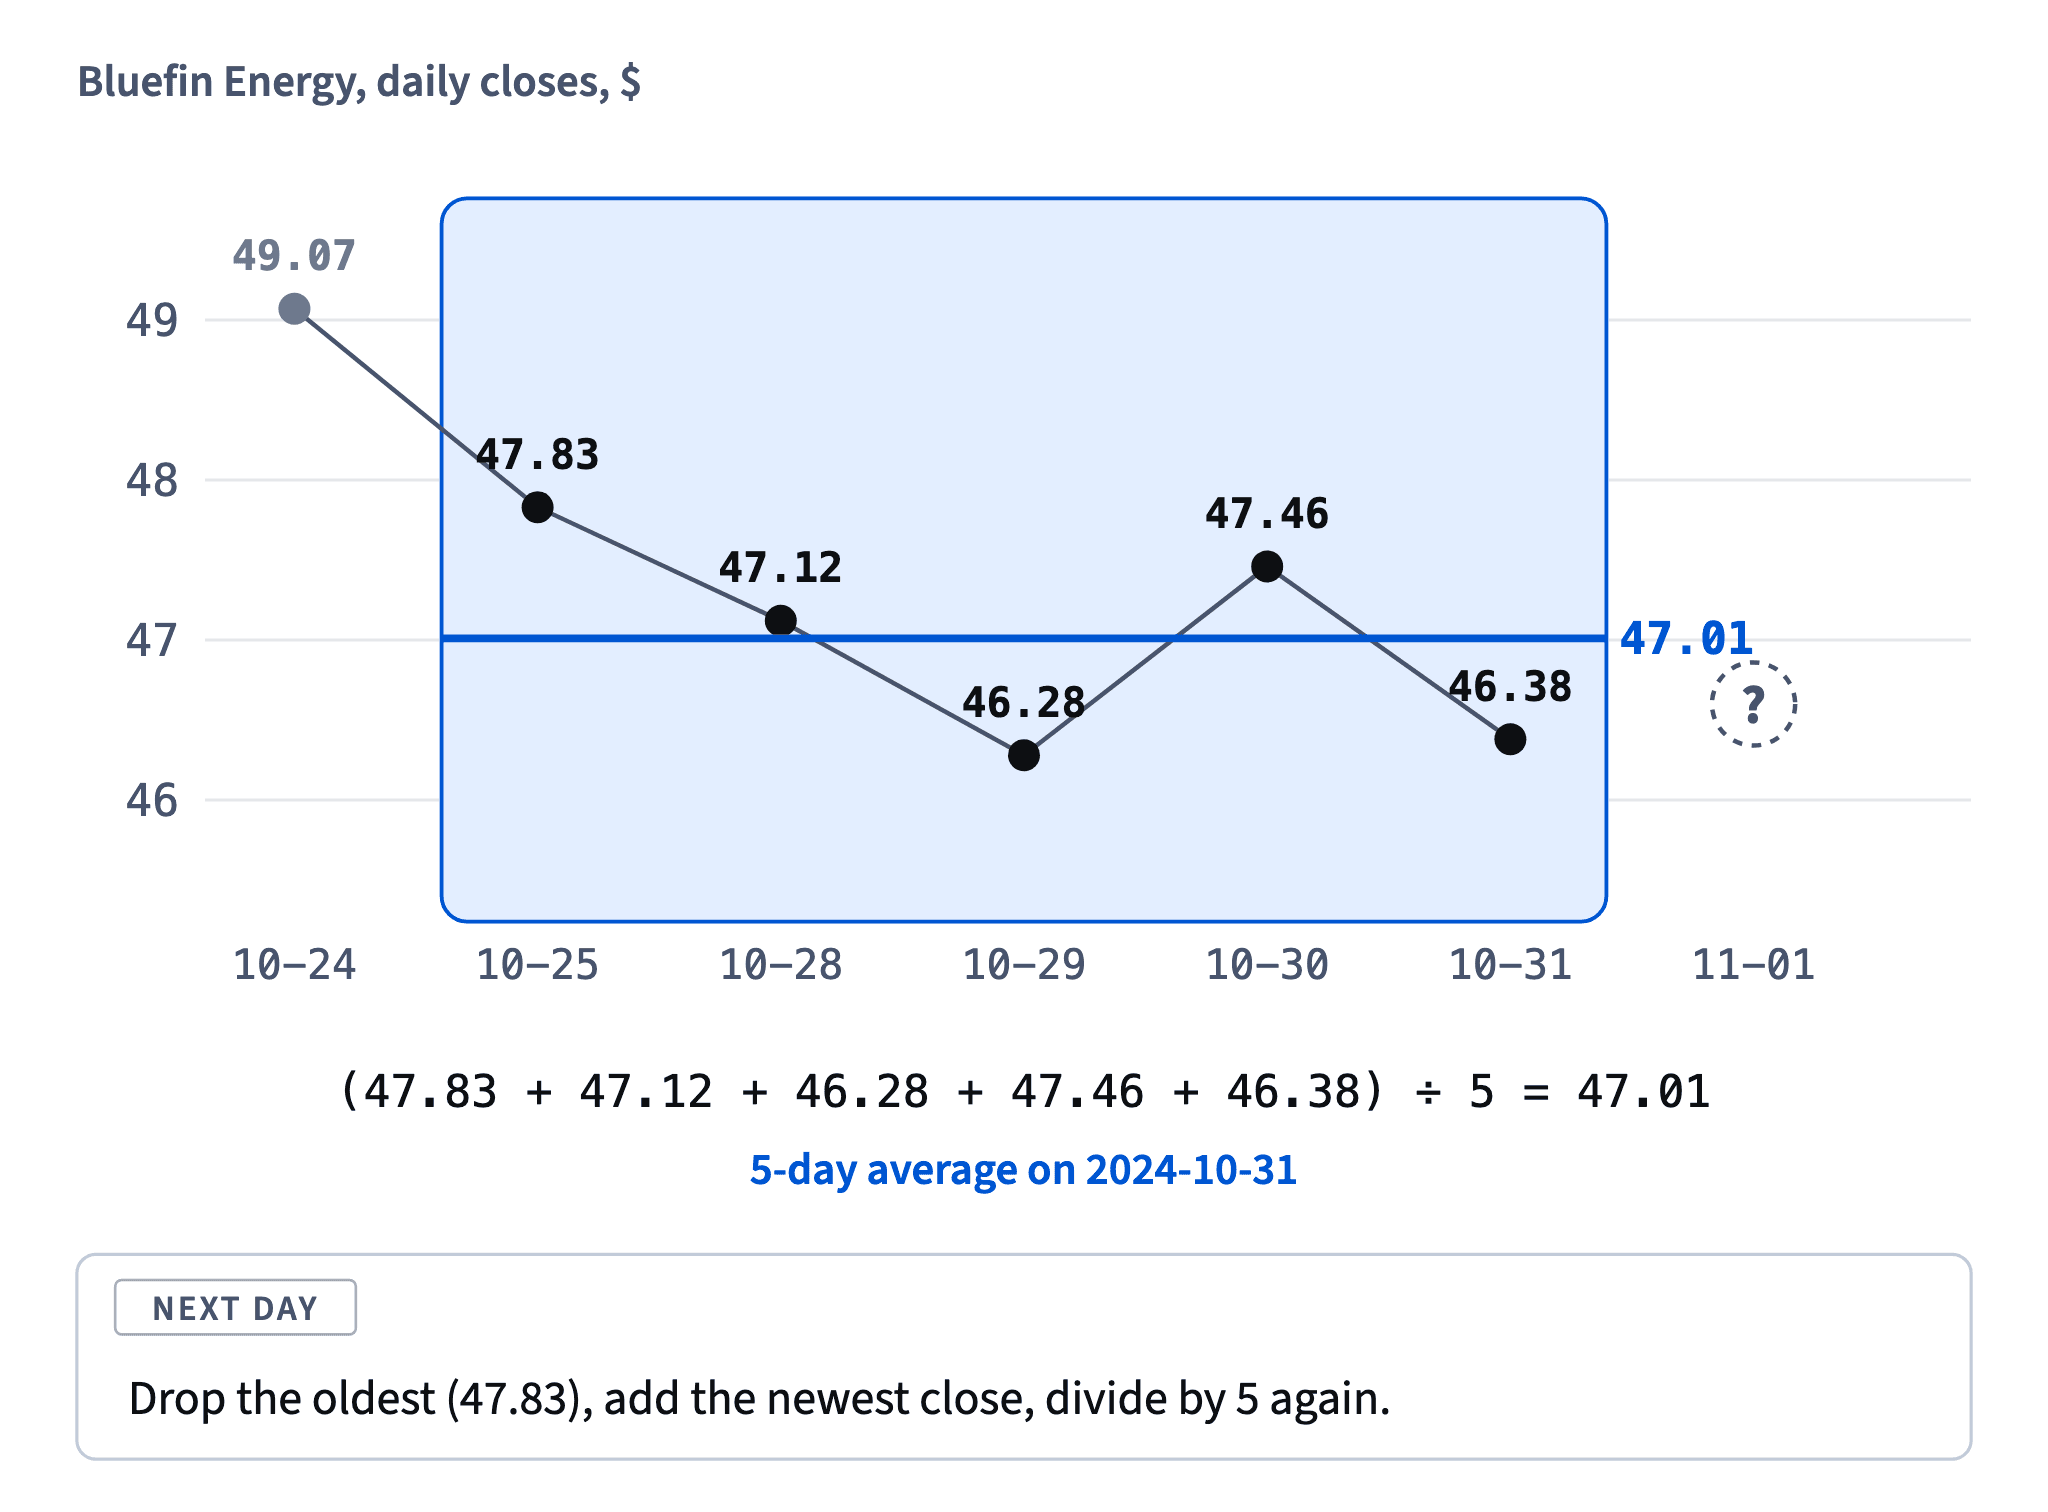
The recipe has three steps: take the last N closes, add them up, divide by N. The next day you slide the window: drop the oldest close, add the newest one, divide again.
Bluefin Energy on Pebble, 5-day average:
- On 2024-10-31 the last five closes are 47.83, 47.12, 46.28, 47.46 and 46.38. Their sum is 235.07, and 235.07 ÷ 5 = 47.01.
- On 2024-11-01 the oldest, 47.83, drops out and the new close, 47.01, comes in: 235.07 − 47.83 + 47.01 = 234.25, and 234.25 ÷ 5 = 46.85.
The 20-day average that day is 47.87. The shorter average sits lower because it only remembers the last week; the longer one still holds the higher closes of mid-October. That difference is a description of two windows, not a signal.
A longer average needs more history before it exists: a 20-day line is blank for the first 19 days of a file.
- Do"Drop 47.83, add 47.01, divide by 5: 46.85."
- Don't"The 5-day average is below the 20-day, so the price must fall."
It only says the last week was lower than the last month.
Lag, the delay built into every average
Because an average is made of past closes, it can only turn after the price has already turned. That delay is called lag.
Bluefin Energy, summer 2024, with a simple rule: buy when the close crosses above the 20-day average, sell when it crosses back below.
- The lowest close was 38.42 on 2024-06-28. The first close above the average came on 2024-07-05, at 40.05: 1.63 a share above the low, five trading days later.
- The climb's top close was 48.85 on 2024-08-30. The close fell back below the average only on 2024-09-04, at 46.94: 1.91 below the top.
The rule still made 46.94 − 40.05 = 6.89 a share, but it gave up both ends of the move. That is the normal price of a smooth line: in late, out late.
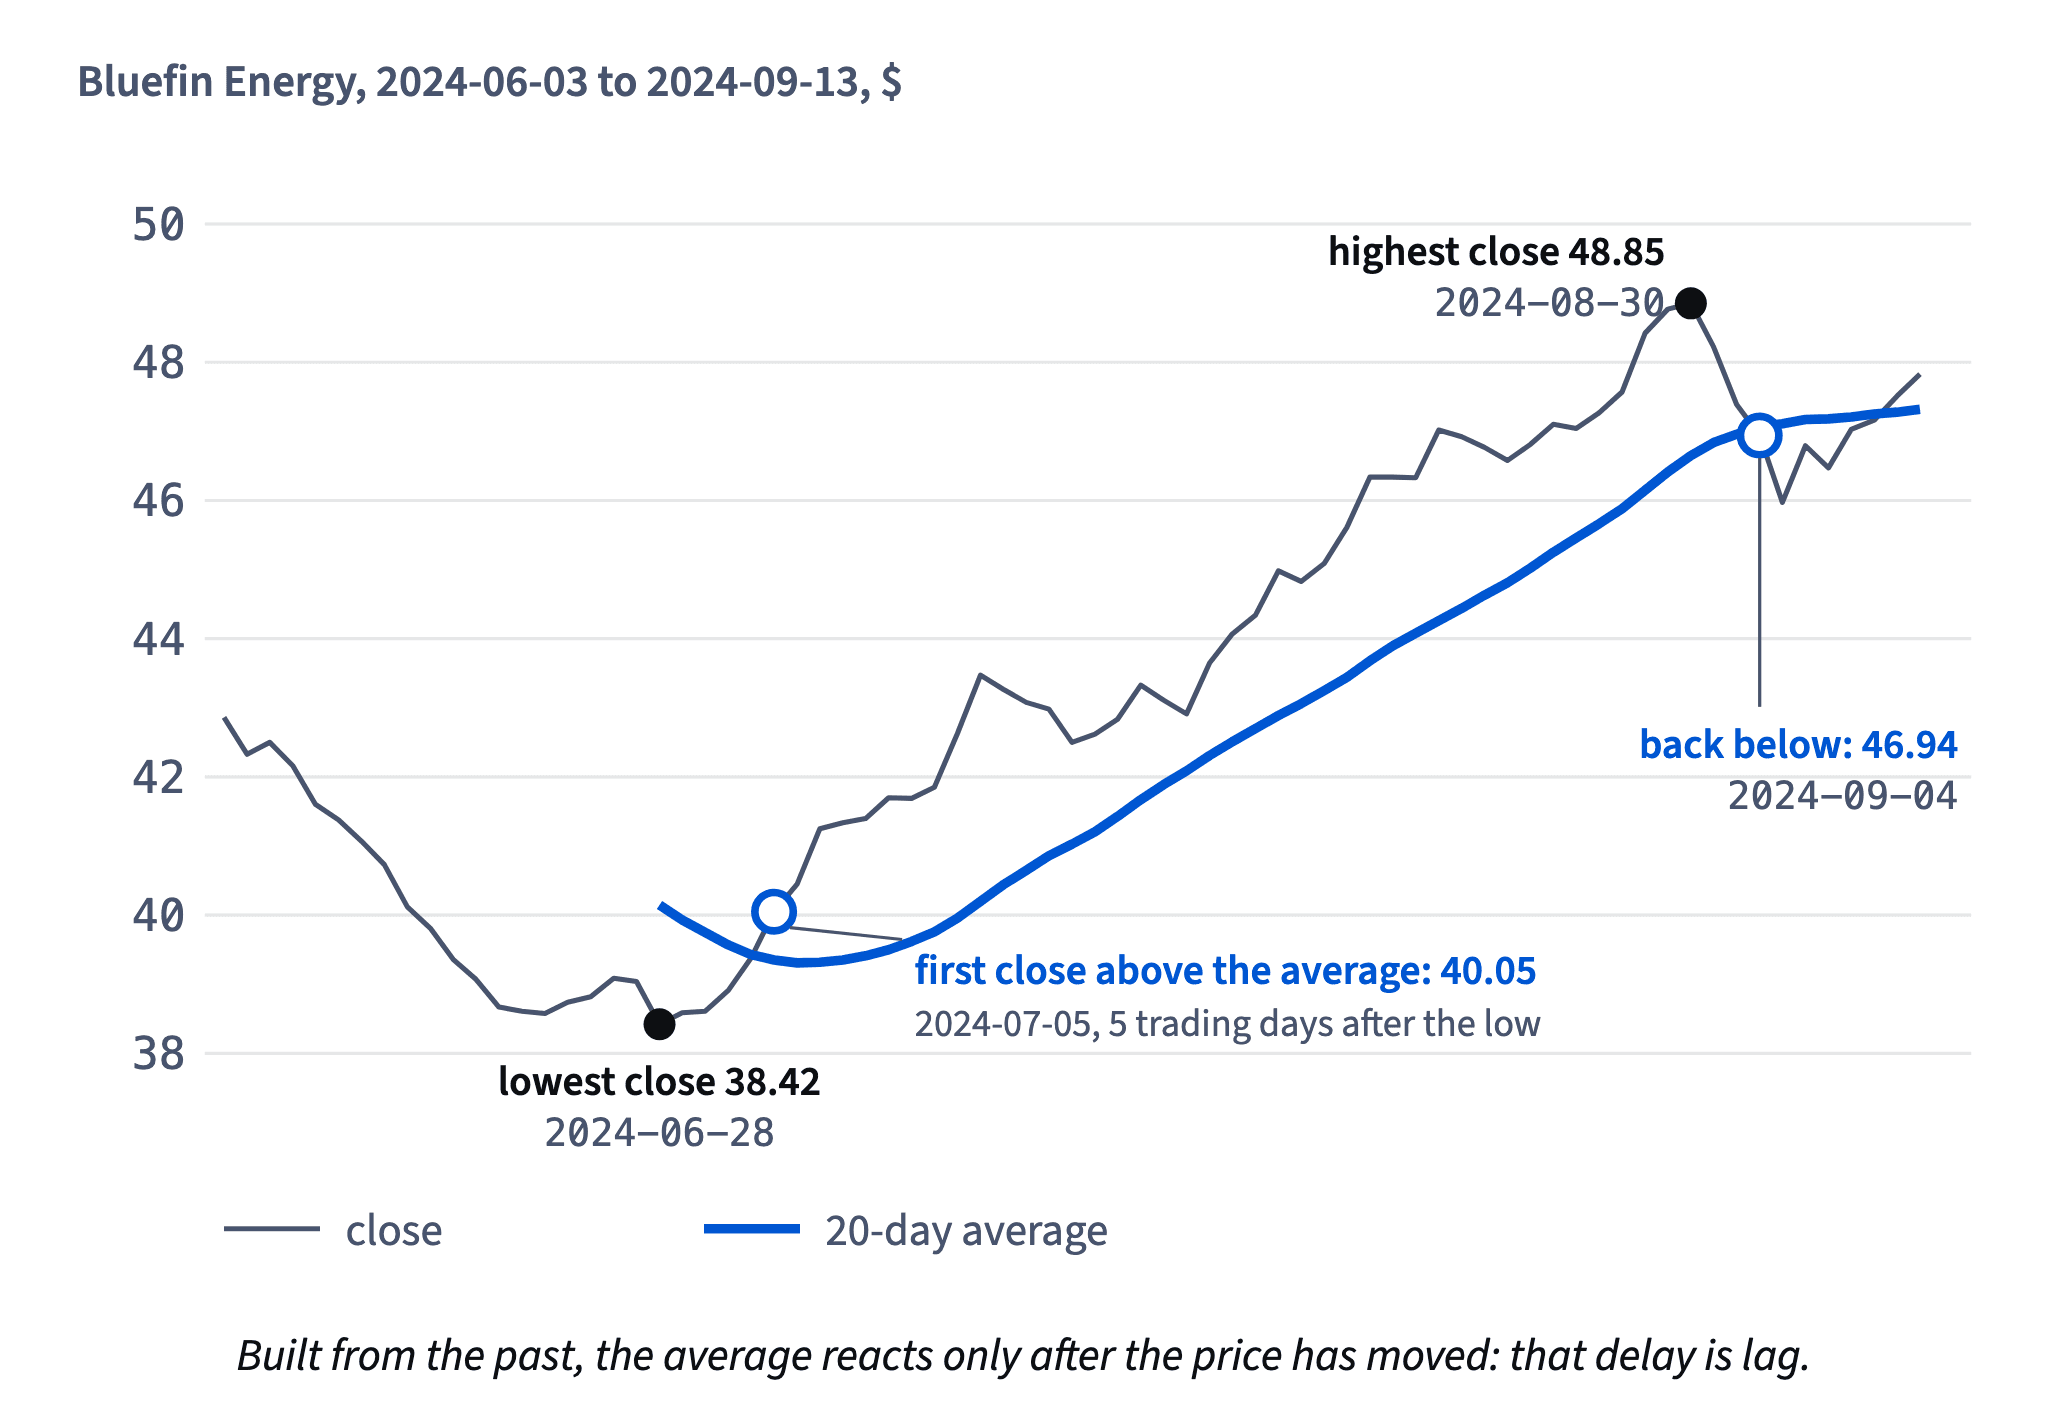
No average catches the exact low or the exact high. Anyone who shows a crossing at the perfect turn is showing a picture drawn afterwards.
- Do"The crossing bought 1.63 above the low and sold 1.91 below the top."
- Don't"This average catches every turn on time."
Every average waits for new closes to move it.
Short or long average: a trade-off, not a winner
The length N is the one setting of a moving average, and every choice trades speed for calm.
- A short average (3 or 5 days) follows the price closely. It turns soon after a reversal, but it also reacts to ordinary daily noise, so the price crosses it again and again.
- A long average (50 days or more) is smooth and rarely crossed. It ignores the noise, and it also ignores the start of a real turn for weeks.
There is no length that is both fast and calm, because both come from the same thing: how many old closes still sit in the window.
Two shapes are worth reading on any chart. A line that slopes up or down describes a trend that has already happened. A flat line that the price keeps crossing in both directions usually means a sideways range, the place where crossing rules lose most often.
None of these readings says what happens tomorrow.
- Do"I chose the 20-day line and I accept that it turns late."
- Don't"I'll find the length that has no lag and no false crossings."
Speed and calm come from the same setting.
A faster line costs more trades
Shortening an average looks like a free way to cut lag. It isn't, because every crossing is a trade, and every trade pays.
Each round trip on Pebble pays the spread and the commission, the costs from Where the money goes: spread, fees and slippage. On Bluefin Energy, a 20-day average gave a handful of crossings in five months. Marc, the experienced trader in this course, tried a 3-day average and saw crossings almost every other day, and most of them reversed within days.
So the real comparison isn't "early versus late". It is "earlier entries in real trends" against "many more small losses and costs in noise". Which side wins depends on how much of the time the market trends, and nobody knows that in advance.
Two habits keep this honest. Count the trades a setting would have made, not just the best one. And judge any setting after costs, on 30 or more trades.
- Do"How many crossings would the 3-day line have made, and what did each cost?"
- Don't"A shorter line gets me in earlier, so it must earn more."
Whipsaw, when crossings flip back and forth
In a sideways range (a market that moves between a floor and a ceiling, as in Trend and range), a moving average goes flat in the middle of the box. The price then crosses it up, down, up again. Each crossing rule trade buys after a rise, near the top, and sells after a fall, near the bottom. Traders call this a whipsaw.
Bluefin Energy moved sideways between about 46 and 49 in September and October 2024. The 20-day crossing rule made five trades there, after costs: −27, −84, −52, −73 and −57. Five trades, five losses, −293 together.
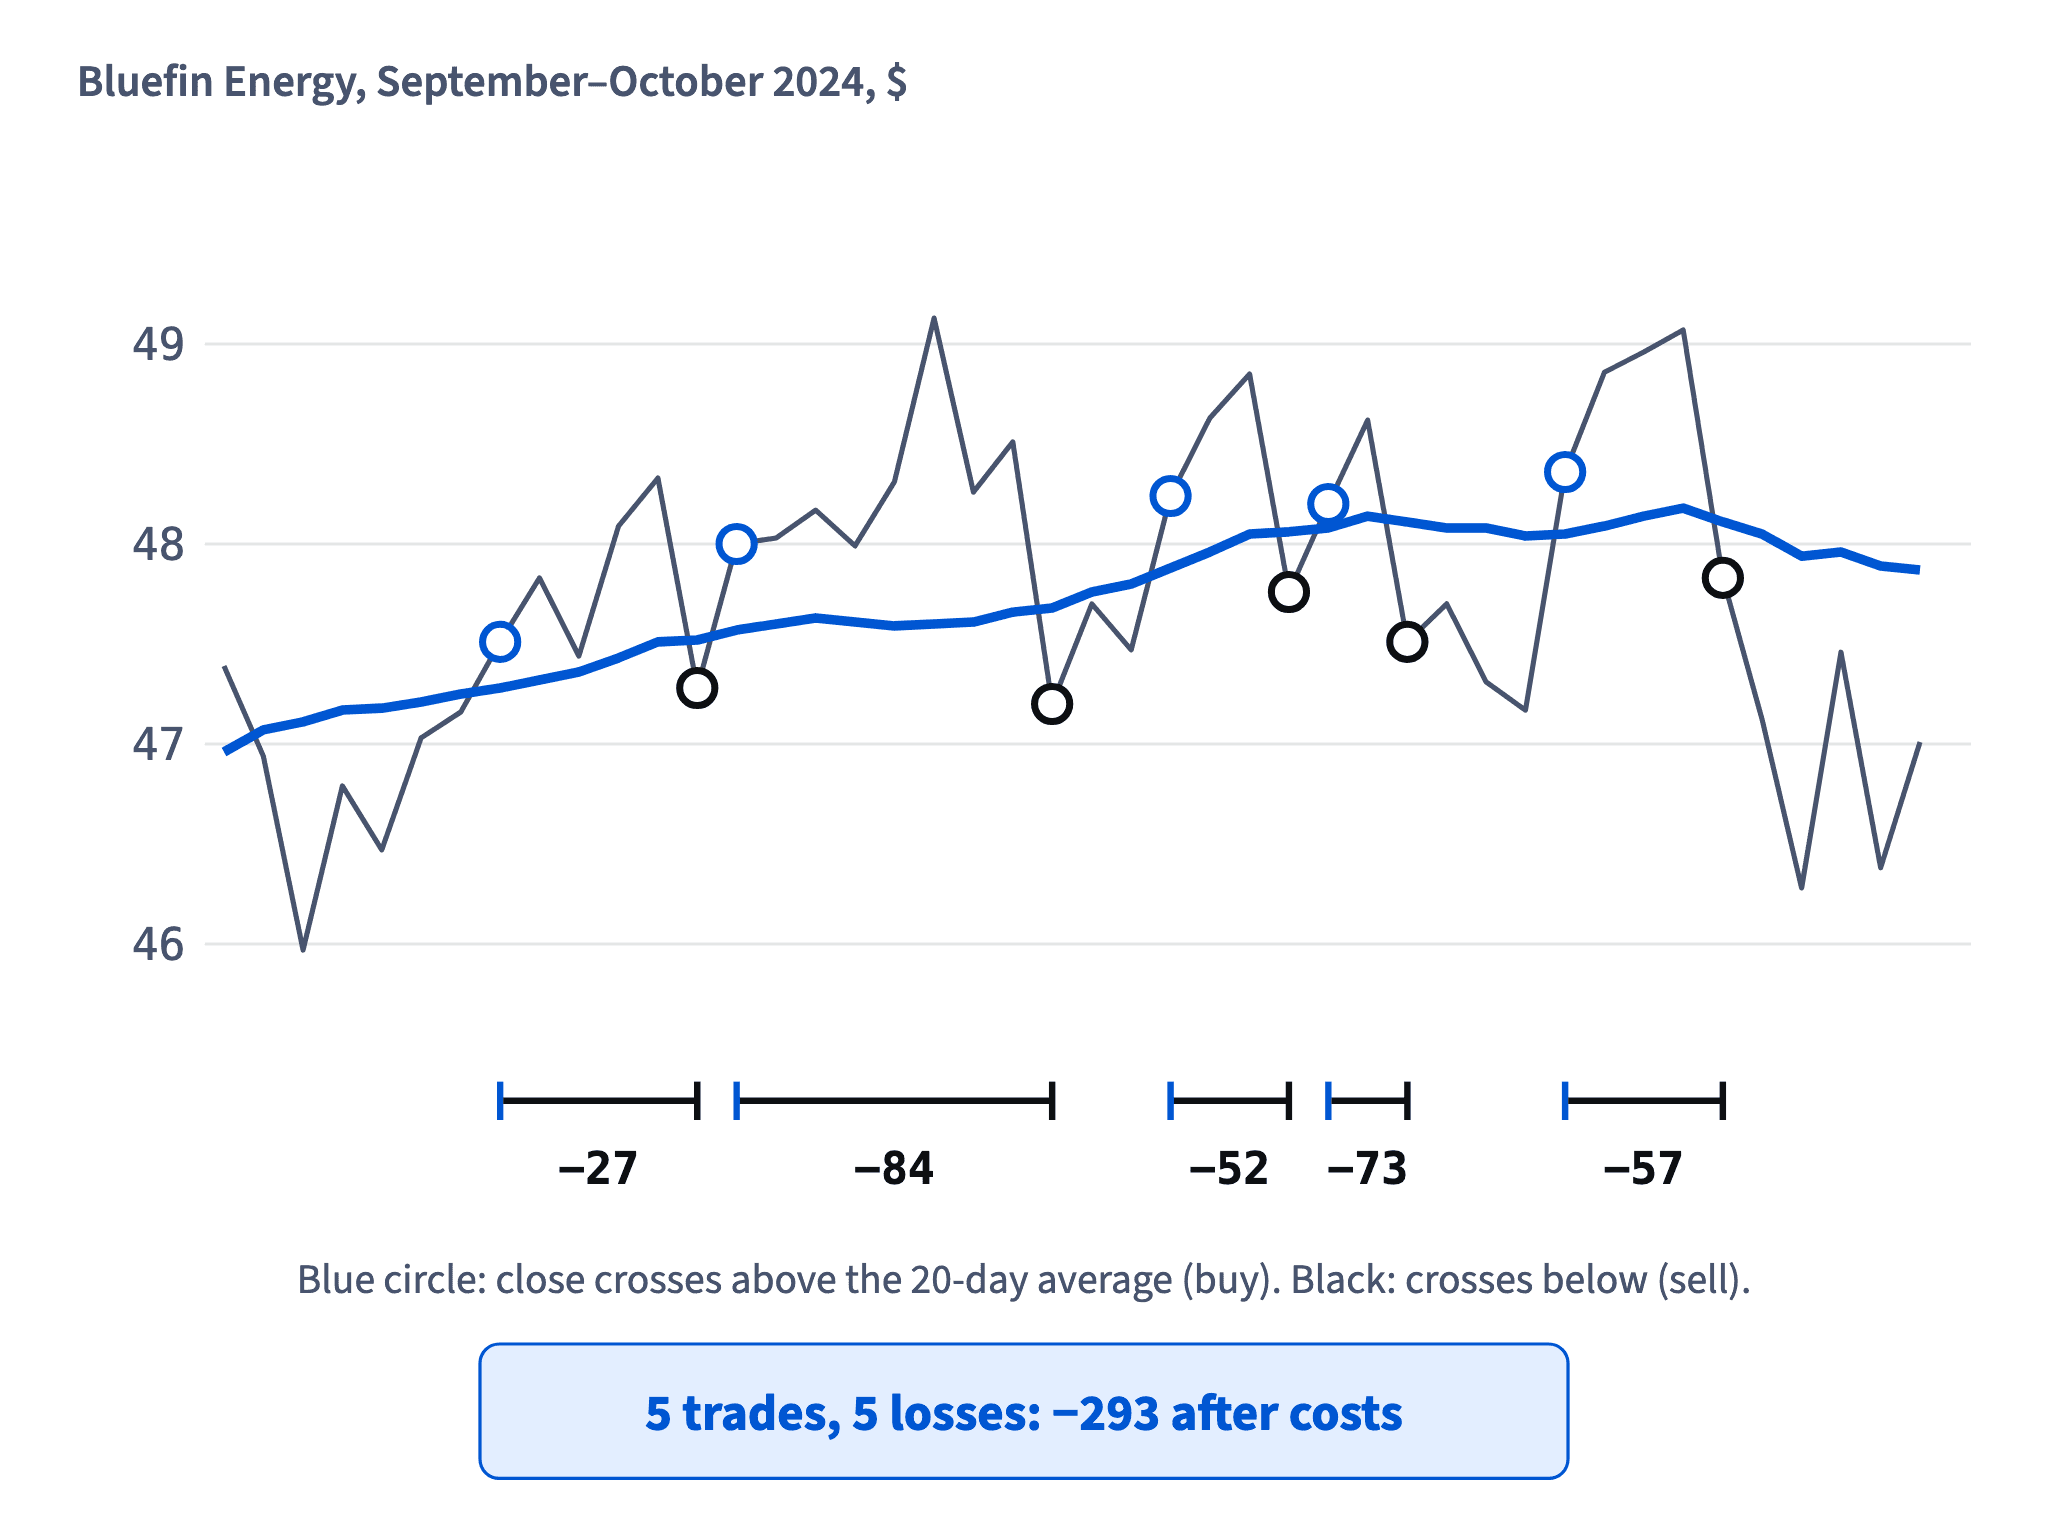
The painful part is timing. On 2024-09-12 the chart still looked like a climb that might go on; the box was visible only after it had been drawn. So you can't simply "switch the rule off in ranges", because a range is recognised late, just like a trend.
- Do"The average went flat and was crossed five times: expect whipsaw, not a signal."
- Don't"Each new crossing is a fresh chance; this one will work."
One big win, many small losses, and too few trades
A crossing rule earns its money in long trends and gives some back in every range. The test on Bluefin Energy shows the usual shape.
- The summer trend trade: 46.94 − 40.05 = 6.89 a share; with 100 shares and 4 dollars of costs, 689 − 4 = +685.
- Five range trades: −27 − 84 − 52 − 73 − 57 = −293.
- Total: 685 − 293 = +392 on 6 trades.
So the rule made money here because one big trend paid for five small losses. That is a real pattern of trend-following rules: few wins, many small losses. But it is not proof. With a longer range or no clean trend in the window, the same rule could finish below zero.
Six trades are far too few to judge anything. As with win rate and payoff in Win rate and reward-to-risk, a result needs at least 30 trades, after costs, before you trust it.
- Do"+392 on 6 trades: interesting, too few to judge."
- Don't"It made +392, so the system works."
One trend trade carried the whole result.
A backdrop, not a trigger
Put together, a moving average is a calm way to describe the backdrop of a chart: is the last month rising, flat or falling? That is genuinely useful, for instance to avoid reading one noisy day as a turn.
What it is not: a forecast, a buy button, or a way to tell a trend from a range in advance. Its crossings arrive late in trends and whipsaw in ranges, and evidence that simple crossing rules beat the market after costs is weak.
The habit of Marc, the experienced trader in this course, is a good model. He keeps one average, the 20-day, uses it only to describe the backdrop, never trades a crossing on its own, and logs every trade with its costs so that after 30 or more trades he can judge honestly.
How it fits together: an average summarises past closes, so it lags; length trades speed for calm; crossings pay in trends and bleed in ranges. The next lesson, A momentum gauge and the overbought myth, looks at a gauge of how fast the price moves.
- Do"The 20-day line is flat, so I'm describing this as a sideways stretch."
- Don't"The price crossed above the line, so I buy now."
A crossing alone is not a plan.
Ready to practise?
Answer the lesson's exercises and earn 250 points the first time you finish it.
Start the exercises