

Theory
Case: mark up a chart and write the plan
Mark the trend and the levels on a Pebble chart, then write when you would enter, where the stop goes and when you stay out, without forecasting.
~8 min read · 10 exercises · 250 points
Before you start
Nora's chart
Back on your Pebble practice account, today you do the whole job yourself, and Nora is the client. She has 80 days of Northwind Foods, which has been rising all summer, and only one question: when does she buy?
This case closes the chart module. With no forecasts allowed, you'll describe what the chart did, mark it up, and write an "if this, then that" plan that also says when to stay out.
Describe, then decide with "if…, then…"
Marking up a chart ends in a plan, and a plan has two rules.
- No forecasts. First describe what the chart did: the trend, the range, the levels. Then write decisions as conditions: "if this happens, then I do that". Anyone can check a condition against the chart later; nobody can check "it will go up".
- Say when you stay out, not only when you get in. A week without a trade costs nothing. A forced trade costs the spread, the fees and often a loss.
For Northwind Foods, which reports quarterly results on Tuesday 2026-09-22, "it went up all summer, so it will go up more" breaks rule 1. "If a day closes above 36.00 after the report, then I consider buying; until then I stay out" follows both.
Chart data
| date | High | Low | Close |
|---|---|---|---|
| 2026-06-01 | 30.26 | 29.88 | 30.17 |
| 2026-06-02 | 30.39 | 30.14 | 30.35 |
| 2026-06-03 | 30.82 | 30.26 | 30.79 |
| 2026-06-04 | 30.93 | 30.75 | 30.81 |
| 2026-06-05 | 31.02 | 30.73 | 30.9 |
Show 75 more rows
| 2026-06-08 | 31.18 | 30.83 | 31.08 |
| 2026-06-09 | 31.15 | 30.89 | 30.96 |
| 2026-06-10 | 31.31 | 30.92 | 31.24 |
| 2026-06-11 | 31.39 | 31.12 | 31.34 |
| 2026-06-12 | 31.43 | 31.18 | 31.27 |
| 2026-06-15 | 31.36 | 31.19 | 31.29 |
| 2026-06-16 | 31.39 | 31 | 31.08 |
| 2026-06-17 | 31.14 | 30.84 | 30.94 |
| 2026-06-18 | 31.22 | 30.87 | 31.14 |
| 2026-06-19 | 31.3 | 31.1 | 31.21 |
| 2026-06-22 | 31.39 | 31.16 | 31.34 |
| 2026-06-23 | 31.79 | 31.25 | 31.68 |
| 2026-06-24 | 31.87 | 31.58 | 31.81 |
| 2026-06-25 | 32.38 | 31.72 | 32.28 |
| 2026-06-26 | 32.35 | 32.08 | 32.21 |
| 2026-06-29 | 32.25 | 32.16 | 32.2 |
| 2026-06-30 | 32.51 | 32.07 | 32.46 |
| 2026-07-01 | 32.68 | 32.33 | 32.6 |
| 2026-07-02 | 32.8 | 32.5 | 32.75 |
| 2026-07-03 | 32.97 | 32.64 | 32.85 |
| 2026-07-06 | 32.93 | 32.52 | 32.57 |
| 2026-07-07 | 32.74 | 32.5 | 32.7 |
| 2026-07-08 | 33.27 | 32.61 | 33.22 |
| 2026-07-09 | 34.04 | 33.15 | 33.93 |
| 2026-07-10 | 34.37 | 33.83 | 34.26 |
| 2026-07-13 | 34.53 | 34.16 | 34.4 |
| 2026-07-14 | 34.77 | 34.36 | 34.71 |
| 2026-07-15 | 35.01 | 34.62 | 34.87 |
| 2026-07-16 | 34.96 | 34.74 | 34.82 |
| 2026-07-17 | 35.18 | 34.79 | 35.04 |
| 2026-07-20 | 35.1 | 34.99 | 35.06 |
| 2026-07-21 | 35.59 | 34.97 | 35.45 |
| 2026-07-22 | 35.87 | 35.41 | 35.73 |
| 2026-07-23 | 35.91 | 35.58 | 35.81 |
| 2026-07-24 | 35.95 | 35.57 | 35.66 |
| 2026-07-27 | 35.79 | 35.2 | 35.33 |
| 2026-07-28 | 35.37 | 34.9 | 34.94 |
| 2026-07-29 | 35.14 | 34.89 | 35.07 |
| 2026-07-30 | 35.68 | 34.93 | 35.68 |
| 2026-07-31 | 35.75 | 35.53 | 35.71 |
| 2026-08-03 | 35.71 | 35.46 | 35.57 |
| 2026-08-04 | 35.61 | 35.41 | 35.48 |
| 2026-08-05 | 36 | 35.38 | 35.7 |
| 2026-08-06 | 35.77 | 35.63 | 35.63 |
| 2026-08-07 | 35.72 | 35.58 | 35.72 |
| 2026-08-10 | 35.8 | 35.39 | 35.46 |
| 2026-08-11 | 35.59 | 35.41 | 35.59 |
| 2026-08-12 | 35.79 | 35.45 | 35.75 |
| 2026-08-13 | 35.76 | 35.61 | 35.67 |
| 2026-08-14 | 35.71 | 35.57 | 35.71 |
| 2026-08-17 | 35.81 | 34.5 | 34.85 |
| 2026-08-18 | 35.05 | 34.74 | 34.95 |
| 2026-08-19 | 35.74 | 34.84 | 35.74 |
| 2026-08-20 | 35.74 | 35.37 | 35.47 |
| 2026-08-21 | 35.66 | 35.43 | 35.62 |
| 2026-08-24 | 36.25 | 35.52 | 35.65 |
| 2026-08-25 | 35.65 | 35.55 | 35.59 |
| 2026-08-26 | 35.68 | 35.23 | 35.37 |
| 2026-08-27 | 35.51 | 35.31 | 35.41 |
| 2026-08-28 | 35.56 | 35.28 | 35.5 |
| 2026-08-31 | 35.6 | 35.33 | 35.46 |
| 2026-09-01 | 35.58 | 35.1 | 35.19 |
| 2026-09-02 | 35.34 | 34.55 | 34.9 |
| 2026-09-03 | 35.28 | 34.85 | 35.22 |
| 2026-09-04 | 35.63 | 35.15 | 35.57 |
| 2026-09-07 | 35.62 | 35.44 | 35.47 |
| 2026-09-08 | 35.8 | 35.37 | 35.71 |
| 2026-09-09 | 35.71 | 35.55 | 35.55 |
| 2026-09-10 | 35.79 | 35.51 | 35.71 |
| 2026-09-11 | 35.77 | 35.68 | 35.77 |
| 2026-09-14 | 35.77 | 35.61 | 35.61 |
| 2026-09-15 | 35.79 | 35.51 | 35.79 |
| 2026-09-16 | 35.79 | 35.67 | 35.68 |
| 2026-09-17 | 35.74 | 35.58 | 35.74 |
| 2026-09-18 | 35.74 | 35.7 | 35.74 |
The rest of this case builds such a plan step by step: shape, levels, where the price is now, what to avoid, and the stop and size.
- Do"If a day closes above 36.00, then I consider buying at the next open."
- Don't"It's been rising, so it'll keep rising; buy."
A forecast, not a condition.
Shape first: trend, then range
Start with the shape, using the same two-week blocks as in Trend and range: blocks show the shape, daily candles the details.
Northwind Foods, 80 days up to Friday 2026-09-18:
Dataset · 8 rows
Northwind Foods, 8 two-week blocks
First 5 of 8 rows
- Blocks 1–4 (June to late July): highs 31.43 → 35.95, lows 29.88 → 34.16, closes from about 30.17 to 35.66. Higher highs and higher lows: an uptrend.
- Blocks 5–8 (late July to mid-September): highs stall at 35.80–36.00 (one poke to 36.25), lows at 34.50–34.55. A sideways range.
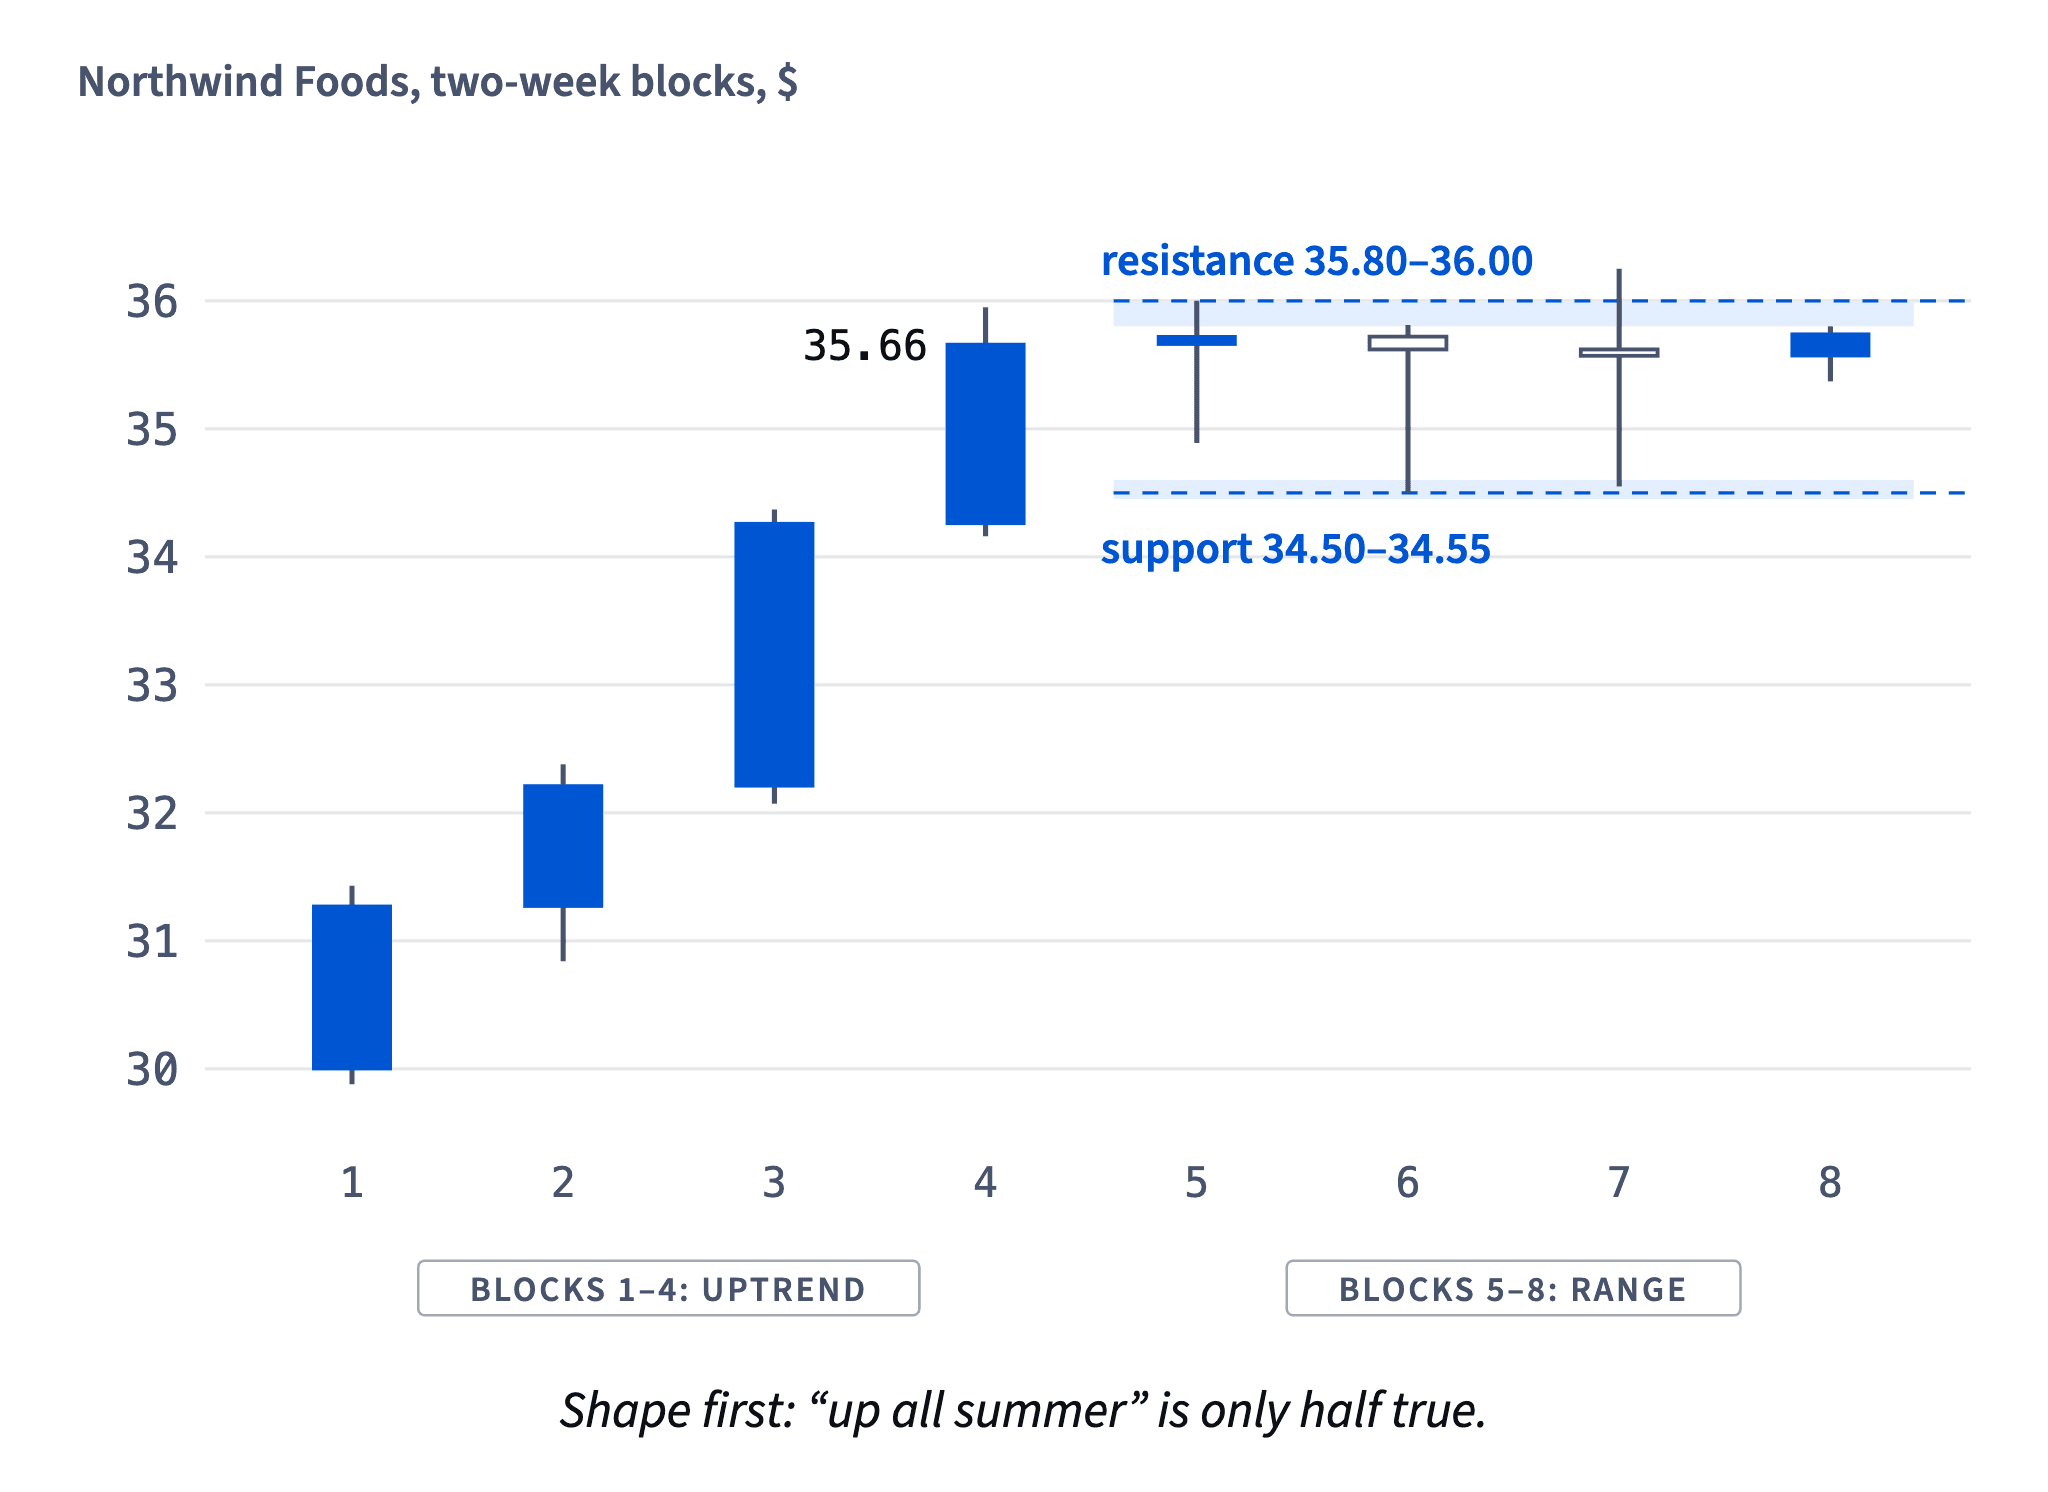
So "it went up all summer" is only half true: the climb stopped in late July, and the last two months went sideways.
Both labels describe the past. The uptrend tells you about June and July, not about next week. That's why the plan starts from the most recent shape, the range, and treats an exit from it as a condition, not an expectation.
- Do"Uptrend in June–July, range since late July: I plan from the range."
- Don't"Up all summer" when the last two months were sideways.
Levels as zones, and how wide the box is
Next, mark support and resistance from the data, before thinking about any position (as in Support, resistance and breakouts). On Northwind Foods since late July:
- Resistance: the highs stopped at 35.80, 35.81, 35.95 and 36.00 (2026-08-05). Mark the zone 35.80–36.00.
- Support: the lows stopped at 34.50 (2026-08-17) and 34.55 (2026-09-02). Mark the zone 34.50–34.55.
Zones, because one exact line invites arguing over every cent, and the data only supports "around here".
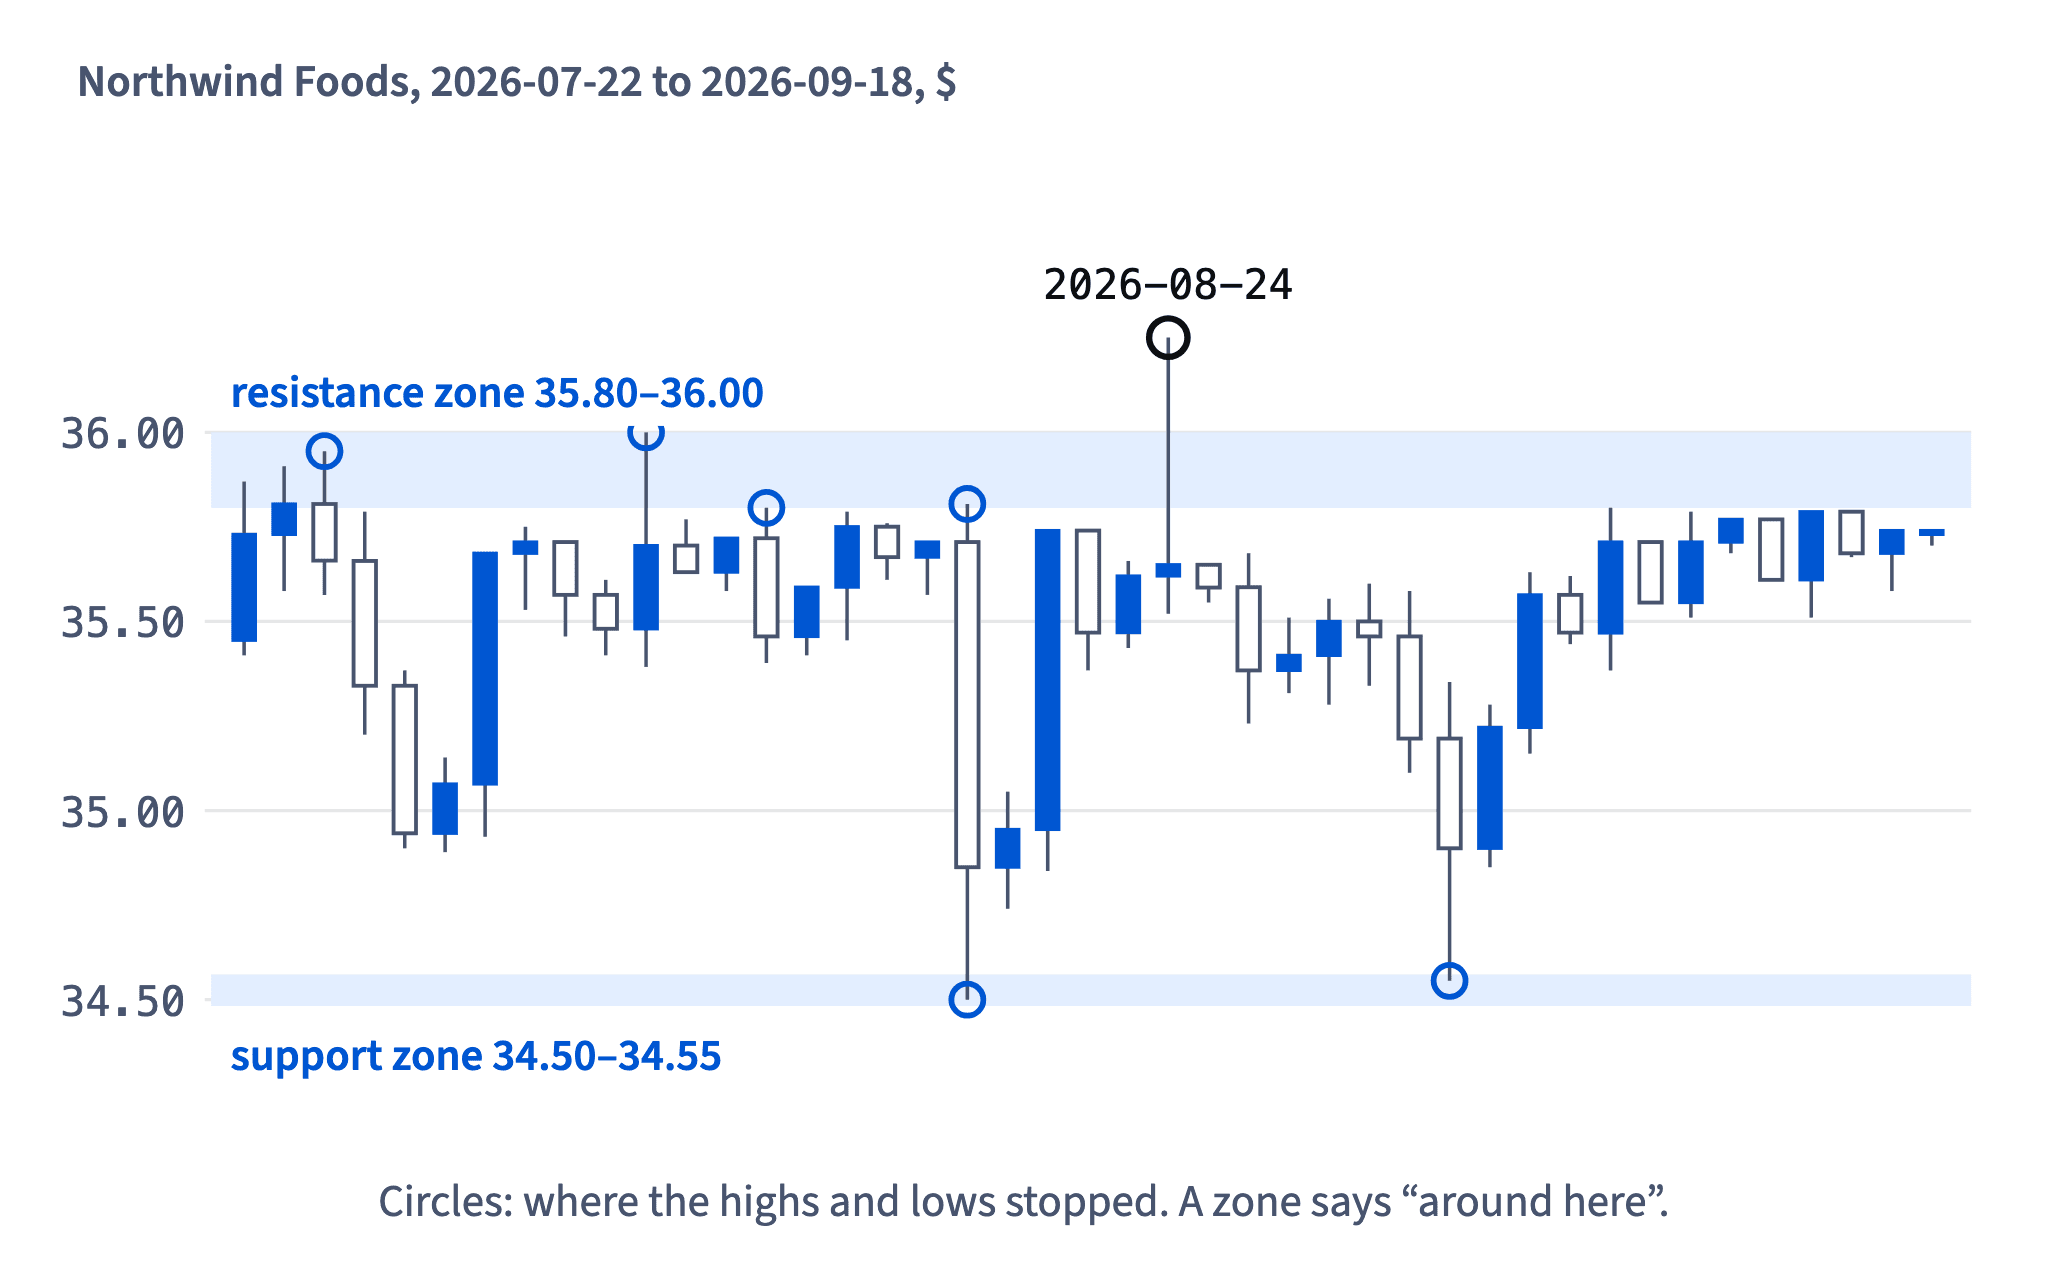
Then measure the box: 36.00 − 34.50 = 1.50 dollars. Compare it with the usual daily move. Over the last 20 days Northwind Foods travelled 0.31 a day from low to high, so the box is about five ordinary days wide. For this calm share that's room to plan with; a share that swings more could cross the same box in one day.
- Do"Resistance zone 35.80–36.00, support zone 34.50–34.55, box 1.50 wide."
- Don't"Resistance is exactly 36.00; 35.95 doesn't count."
The failed poke on 2026-08-24
A level that has already produced a false breakout deserves extra caution in the plan.
On 2026-08-24 Northwind Foods reached a high of 36.25, above the 35.80–36.00 resistance zone, and closed at 35.65, back inside the box. That is a false breakout as defined in Support, resistance and breakouts: it poked out and closed back in. For the next four weeks the closes stayed between 34.90 and 35.79.
Anyone with a buy stop just above 36.00 was filled that day and caught. That's why the plan's entry condition is a daily close above 36.00, not a touch during the day. It skips pokes like this one, at the price of entering later and higher, and a close above can still fail.
One failed poke doesn't mean the next one will fail too. It only means the plan shouldn't treat any move above 36.00 as settled until the day closes.
- Do"High 36.25, close 35.65: a poke. My entry needs a close above 36.00."
- Don't"It touched 36.25, so the range is broken."
Where the price is now, in ordinary days
After the shape and the levels, place the last close in the box. Northwind Foods closed at 35.74 on Friday 2026-09-18, near the top: 36.00 − 35.74 = 0.26 dollars below the top of the resistance zone.
Chart: Northwind Foods, daily high, low and close · shown above
A distance means little until you compare it with how far the price usually moves. The average daily range over the last 20 days was 0.31 (high minus low, averaged). So 0.26 ÷ 0.31 ≈ 0.84: less than one ordinary day separates the price from the top of the box.
That tells you what not to do. Buying here in the hope of a breakout puts the entry right under resistance, where one ordinary day can go either way, and the chart doesn't say which. It's the middle-to-upper part of a range, the place a plan usually says "stay out" until the condition, a close above 36.00, is met.
- Do"0.26 from the top, with 0.31 a day: under one ordinary day. I wait for the condition."
- Don't"Only 26 cents to go, buy before it breaks out."
Report days and gaps
A plan also names the days it avoids, and scheduled news is the clearest case. Northwind Foods reports quarterly results on Tuesday 2026-09-22.
On report days even a calm share can open far from the previous close: a gap. A stop is an order that waits for the price to reach it; if the price jumps straight past it overnight, the order fills at the first available price, beyond the stop. That's the gap-through-the-stop trap from The stop: where it goes and why: the real loss is bigger than the planned one.
Example: in at 36.10 with a stop at 35.30, a report-day open at 34.70 would fill the stop around 34.70, not 35.30. The planned 0.80 a share becomes 1.40.
The report could push the price up or down; the plan doesn't guess which. It simply stays out until the report is out and the price has settled.
- Do"Report on Tuesday: no new trade until it's out and the price settles."
- Don't"My stop protects me through the report."
A gap can jump past any stop.
When the plan says "stay out"
A plan that only lists entries pushes you into trades. A good one lists the conditions under which you do nothing, and each must be a reason you can check.
For Northwind Foods this week, three checkable reasons say stay out:
- The report on 2026-09-22 can gap the price past any stop.
- No signal yet: the price sits inside the 34.50–36.00 range, with no daily close above 36.00.
- The level has already fooled people once: the poke to 36.25 on 2026-08-24 closed back at 35.65.
Two tempting "reasons" don't count. A past uptrend proves nothing about next week. A candle's colour only compares its own open and close.
Staying out feels boring, and boredom is a real risk: trades taken just to do something are among the easiest to regret. A week without a trade costs nothing; a forced one costs the spread, fees and often a loss.
- Do"Stay out until the report is out and a day closes above 36.00."
- Don't"Nothing's happening, I'll take a small trade so the week isn't wasted."
From the chart to a stop and a size
The last part of the plan turns the levels into numbers you risk. The chart decides where the stop goes; your risk limit decides the size.
Stop: put it where the idea is proven wrong. An entry at about 36.10 after a close above 36.00 bets that the price has left the range. If it falls back inside, the idea is wrong, so the stop sits at 35.30, below the last two weeks' low of 35.37: 0.80 a share.
Chart: Northwind Foods, daily high, low and close · shown above
Size, with risk per trade from Risk per trade: a small share of the account (1% of 10,000 = 100 dollars) and the formula from Position size from risk and stop: (100 − 3) ÷ 0.80 = 121.25, so 121 shares. A hit stop costs 121 × 0.80 + 3 = 99.80 dollars, unless a gap jumps past it.
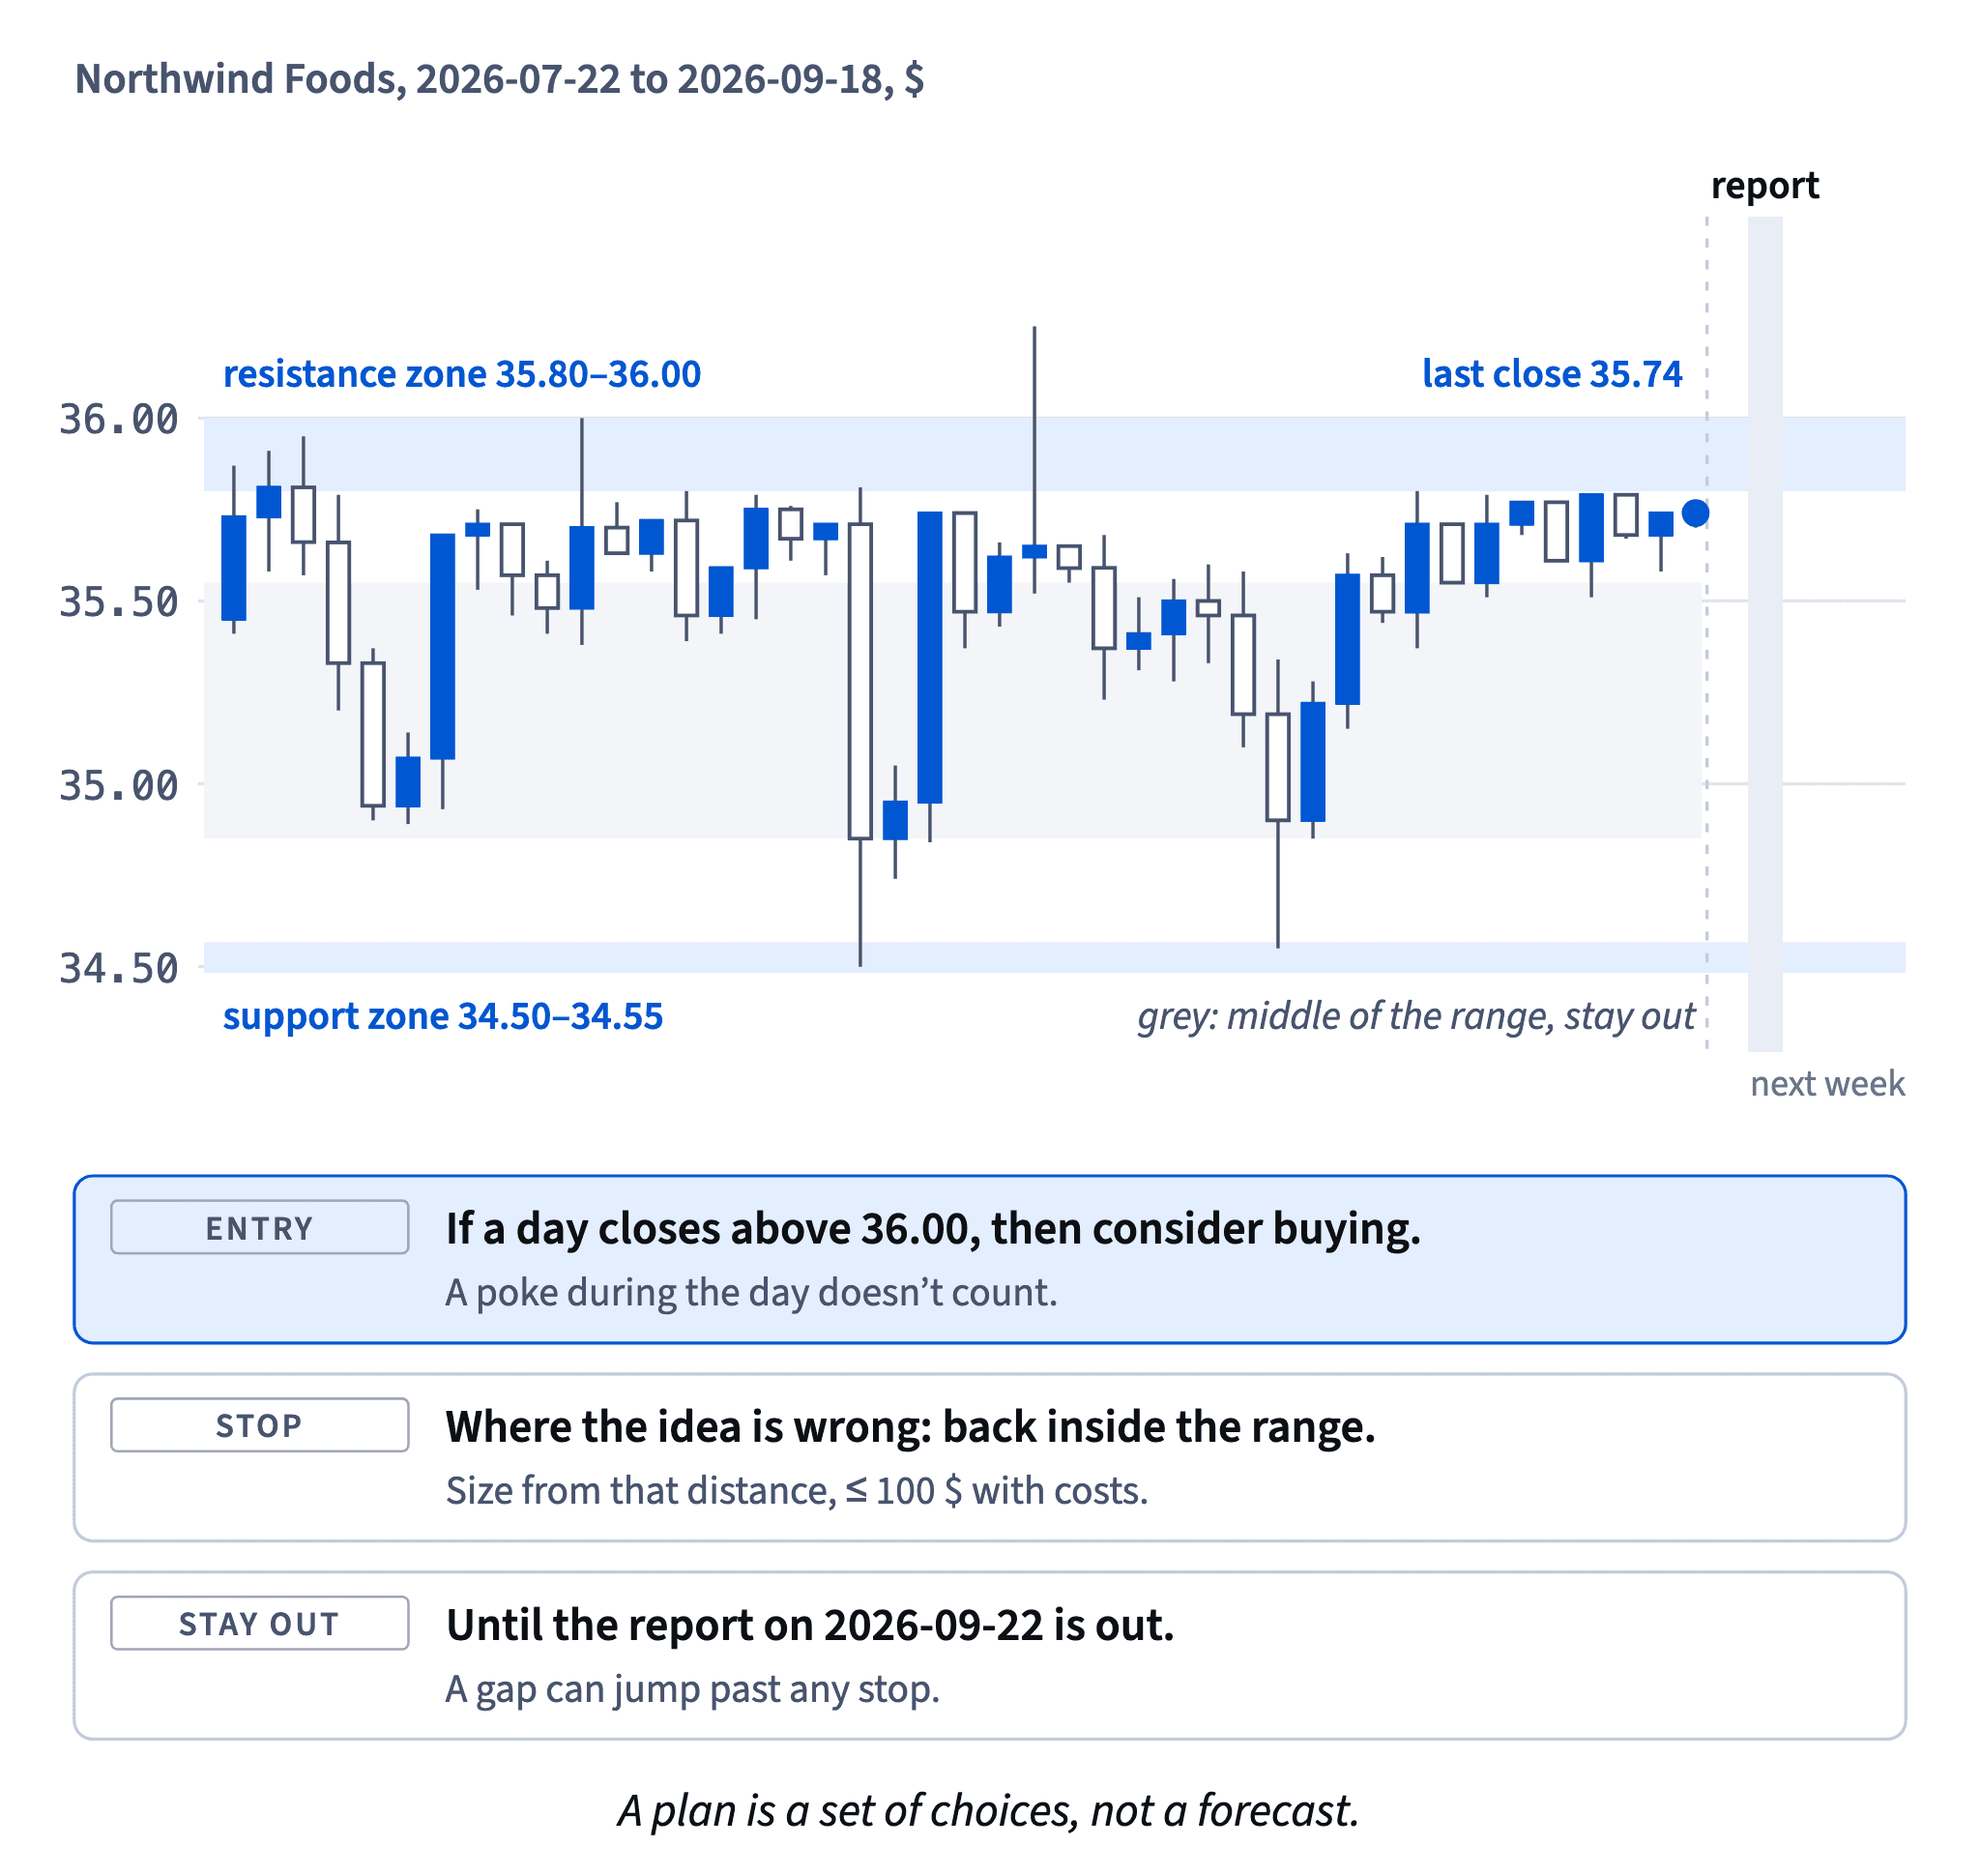
How it fits together: describe the shape, mark zones, place the price in ordinary days, write an "if…, then…" entry, name the stay-out days, then set stop and size. Module 6, Which tools are worth my time?, starts with Moving averages: a first tool laid over this chart.
- Do"Stop 35.30, 0.80 a share, 121 shares: 99.80 at most if the stop fills."
- Don't"I'll buy 300 shares and put the stop wherever the loss feels okay."
The stop comes from the chart, the size from the risk, never the other way round.
Ready to practise?
Answer the lesson's exercises and earn 250 points the first time you finish it.
Start the exercises