

Theory
Weighted mean and mix
Σwx/Σw, why a pooled rate is not the mean of rates, mix-adjusted rates, pooled variance and pooled p̄, the cost of capital, PERT estimates and weighted scoring.
~8 min read · 9 exercises · 250 points
Before you start
When some values count more
Still on Klasna's product team. Two channels bring trial lessons, ads and referrals, each with its own conversion to a paid package, and someone wants to report one overall conversion by averaging the two rates.
You'll see when a plain average of rates misleads, how a weighted mean gives each value its fair weight, and how a change in the mix can move a total even when no part has changed.
Pooled rate, not the mean of rates
Two channels bring trial lessons. Ads: 40 of 1,000 trials paid, 4%. Referrals: 30 of 200 paid, 15%. Averaging the two rates gives (4% + 15%) ÷ 2 = 9.5%, the mean of rates. Counting directly gives 40 + 30 = 70 payers out of 1,200 trials, 5.83%, the pooled rate.
They disagree because the mean of rates treats 200 people as if they were as many as 1,000. The pooled rate counts every trial once, so it leans toward the bigger group: 5.83% sits much closer to the ads' 4% than to the referrals' 15%.
For "what share of our trials paid?" the pooled rate is the answer, and it's the one revenue and workload follow. The mean of rates answers a different question, about a typical channel rather than a typical trial. When in doubt, go back to counts: all successes over all people.
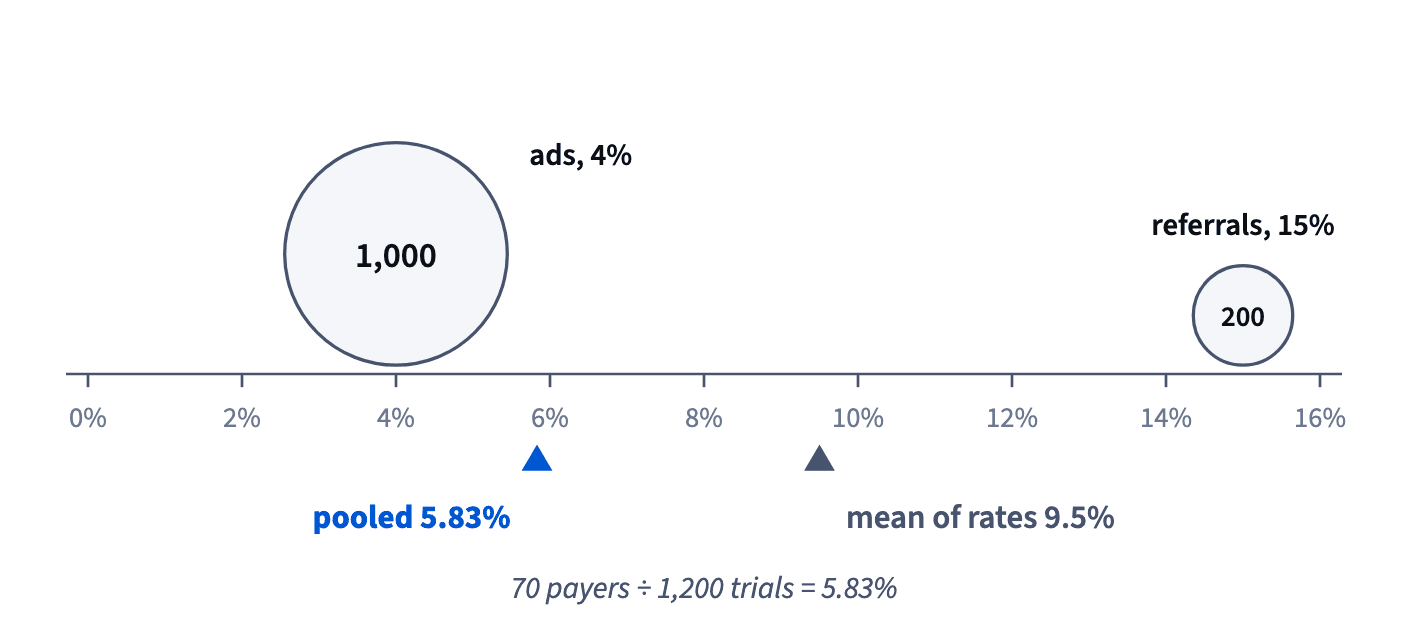
- Do(40 + 30) ÷ (1,000 + 200) = 5.83%
- Don't(4% + 15%) ÷ 2 = 9.5% as "our conversion"
200 people counted like 1,000.
The weighted mean: Σwx ÷ Σw
A weighted mean lets each value count in proportion to its weight:
x̄_w = Σwᵢxᵢ ÷ Σwᵢ.
Multiply each value by its weight, add, and divide by the total weight. If Klasna sells 3,400 lessons at 620 UAH and 1,200 at 650 UAH, the average price weighted by lessons is (2,108,000 + 780,000) ÷ 4,600 ≈ 627.83 UAH. The plain mean of the two prices, 635, pretends as many lessons sold at 650 as at 620.
It's the sum-of-products pattern from the lesson on Σ, Σqp ÷ Σq, and a pooled rate is the same formula with trials as weights and conversion rates as values. With equal weights the weighted mean becomes the plain mean.
Two checks: a weighted mean always lies between the smallest and the largest value, and closer to the values with more weight. If yours lands outside, a weight or a value is in the wrong place.
- Do(3,400 × 620 + 1,200 × 650) ÷ 4,600 ≈ 627.83 UAH
- Don't(620 + 650) ÷ 2 = 635 UAH
Ignores how many lessons sold at each price.
Pooled p̄ and when to pool
In a conversion test, statistics pools the two groups into p̄ = (x₁ + x₂) ÷ (n₁ + n₂): all successes over all people. It's the weighted mean of the two rates, each weighted by its group size.
For a channel with 30 payers of 600 trials (5%) and another with 33 of 300 (11%), the pooled rate is 63 ÷ 900 = 7%, below the mean of rates, 8%, because the bigger channel converts worse.
Is the mean of rates ever right? Yes, when each group is itself the unit you care about: "how does a typical channel convert?" or "what's the average rate across our schools, each counted once?". For "how does a typical trial convert?", pool. Most business questions are about people or money, so pool by default and say so when you don't.
Pool counts, not percentages: adding the successes and the people is less error-prone than weighting the rates.
- Do(30 + 33) ÷ (600 + 300) = 7%
- Don't(5% + 11%) ÷ 2 = 8% as "our conversion"
The smaller channel gets too much weight.
Mix: same rates, different weights
Over time, weights can move a total as much as the rates do. In May ads brought 1,000 trials at 4% and referrals 200 at 15%: pooled 5.83%. In July ads converted at 5% and referrals at 16%, each 1 pp better, but trials were 600 and 600: pooled (30 + 96) ÷ 1,200 = 10.5%.
Did conversion nearly double? Mostly the mix changed: more trials came from the better channel. To separate the effects, compute a mix-adjusted rate, July's rates with May's weights: (1,000 × 5% + 200 × 16%) ÷ 1,200 = 82 ÷ 1,200 = 6.83%.
Now split the +4.67 pp: about +1 pp is real improvement in the channels (5.83% → 6.83%), and +3.67 pp is mix (6.83% → 10.5%).
Freeze the weights, change the rates, and you see what the rates alone did. Report both parts, or a shift in traffic sources passes for a better product.
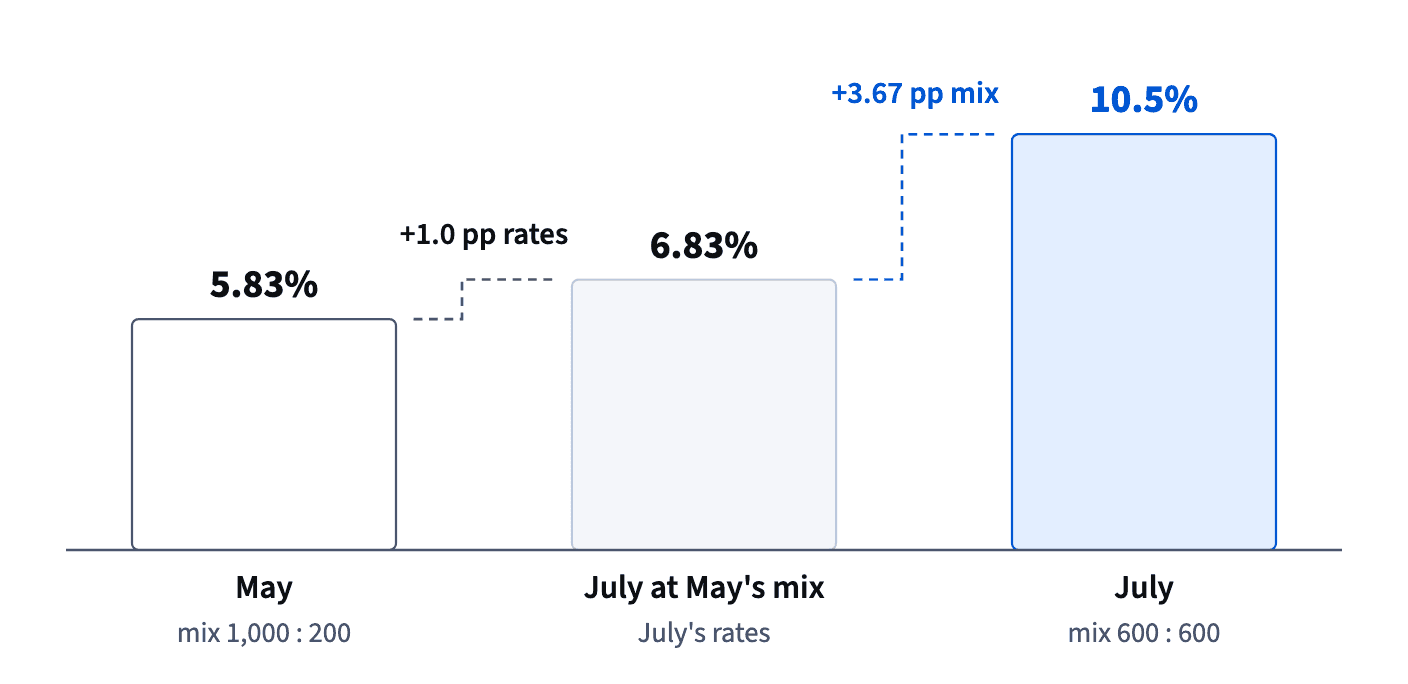
- DoJuly at May's mix: 6.83%, so channels +1 pp, mix +3.67 pp
- Don't"Conversion went from 5.83% to 10.5%: the funnel doubled"
Most of the jump is mix.
Simpson's paradox
When the mix shifts enough, a total can move against every one of its groups: Simpson's paradox.
Keep May as before: ads 1,000 trials at 4%, referrals 200 at 15%, pooled 5.83%. Now say that in July ads fell to 3.5% and referrals to 14%, with 600 trials from each. Pooled: (21 + 84) ÷ 1,200 = 8.75%. Both channels got worse and the total got better, because half the trials now come from the channel that converts four times as well.
At May's mix, July's rates give (35 + 28) ÷ 1,200 = 5.25%, a fall, which is what really happened inside each channel.
The lesson isn't that totals lie: they answer "how did all our trials do?" correctly. The trap is reading a total as if it described its parts. Whenever a total moves, check the groups and the mix before you explain the move.
- DoCheck each channel and the mix before explaining a total
- Don't"The total is up, so every channel improved"
Here every channel fell.
Pooled variance: weights n − 1
The t-test pools the variances of two groups into one:
s_p² = ((n₁ − 1)s₁² + (n₂ − 1)s₂²) ÷ (n₁ + n₂ − 2).
Read it as a weighted mean of s₁² and s₂² with weights n₁ − 1 and n₂ − 1; the denominator is just the sum of the weights. With n₁ = 11, s₁² = 16 and n₂ = 21, s₂² = 25: (10 × 16 + 20 × 25) ÷ 30 = (160 + 500) ÷ 30 = 22. The result leans toward 25 because the second group is bigger.
Why n − 1 and not n? Each sample variance is measured around its own mean, which uses up one value's worth of information, so each group contributes n − 1 free pieces. Statistics calls them degrees of freedom.
Check: a pooled variance always lies between s₁² and s₂².
- Do(10 × 16 + 20 × 25) ÷ 30 = 22
- Don't(16 + 25) ÷ 2 = 20.5
Ignores the group sizes.
Weighting by money: the cost of capital
Finance weighs rates by the money behind them. A company funded by 4 million UAH of debt at 18% and 6 million of equity at 25% has a cost of capital of
(4 × 18% + 6 × 25%) ÷ (4 + 6) = (0.72 + 1.50) ÷ 10 = 22.2%.
It's the weighted mean again: the rates are the values, the amounts are the weights. Equity costs more and there's more of it, so the result sits closer to 25% than to 18%.
The finance course uses this rate to judge projects: a project that earns less than the cost of the money funding it loses value.
Slips: averaging the two rates without weights, (18% + 25%) ÷ 2 = 21.5%, and weighting by the number of lenders or shareholders instead of the money. The weights must be what the question is about, here hryvnias of funding.
- Do(4 × 18% + 6 × 25%) ÷ 10 = 22.2%
- Don't(18% + 25%) ÷ 2 = 21.5%
The bigger source gets no extra weight.
PERT and weighted scores
Weights can also express judgment. A PERT estimate turns three guesses for a task into one by weighting them 1 : 4 : 1: E = (O + 4M + P) ÷ 6, with O optimistic, M most likely and P pessimistic. For 4, 6 and 14 weeks: (4 + 24 + 14) ÷ 6 = 7 weeks. The weights add to 6, hence the ÷ 6, and a long pessimistic tail pulls the estimate above the most likely value.
A weighted score for roadmap options works the same way: give each criterion a weight, the weights adding to 1, and score = Σwᵢsᵢ. Scores 4, 3 and 5 under weights 0.5, 0.3 and 0.2 give 2.0 + 0.9 + 1.0 = 3.9.
How it fits together: every average here is Σwx ÷ Σw; choosing the weights means choosing the question, and a change in the weights, the mix, can move a total by itself. Next lesson: products of shares in funnels and metric trees.
- DoE = (4 + 4 × 6 + 14) ÷ 6 = 7 weeks
- Don't(4 + 6 + 14) ÷ 3 = 8 weeks, called PERT
A plain mean, not the 1 : 4 : 1 weights.
Ready to practise?
Answer the lesson's exercises and earn 250 points the first time you finish it.
Start the exercises