

Theory
Splitting a total
Split a total into parts that add up exactly: sums of squares and R², plan vs actual as volume + mix + price, and a change in savings as contributions + growth.
~9 min read · 10 exercises · 250 points
Before you start
Parts that add up
Back at Klasna, the month has closed with 16,000 UAH more contribution than planned, and Leo, the CEO, asks the obvious question: why?
This lesson closes module 5 with a tool that answers it: splitting a total into parts that add up exactly, so nothing is left unexplained. You'll split spread into between-group and within-group parts, and a change in a total into volume, price and mix effects.
Splitting a total into parts that add up
A decomposition splits a total into parts that add up to it exactly. Then every part gets a clear share and nothing is left unexplained: "why did contribution beat plan by 16,000?" becomes "+72,000 from volume, −56,000 from the rate".
Statistics does this with spread, as in Why we square: variance, sums of squares and n − 1. Six learners took 4, 6, 8, 10, 12 and 14 lessons in a month (mean 9); the first three study English, the others exam maths. The total sum of squares is 25 + 9 + 1 + 1 + 9 + 25 = 70. With group means 6 and 12, the between part is 3 × (6 − 9)² + 3 × (12 − 9)² = 54 and the within part is 4 + 0 + 4 + 4 + 0 + 4 = 16. And 54 + 16 = 70.
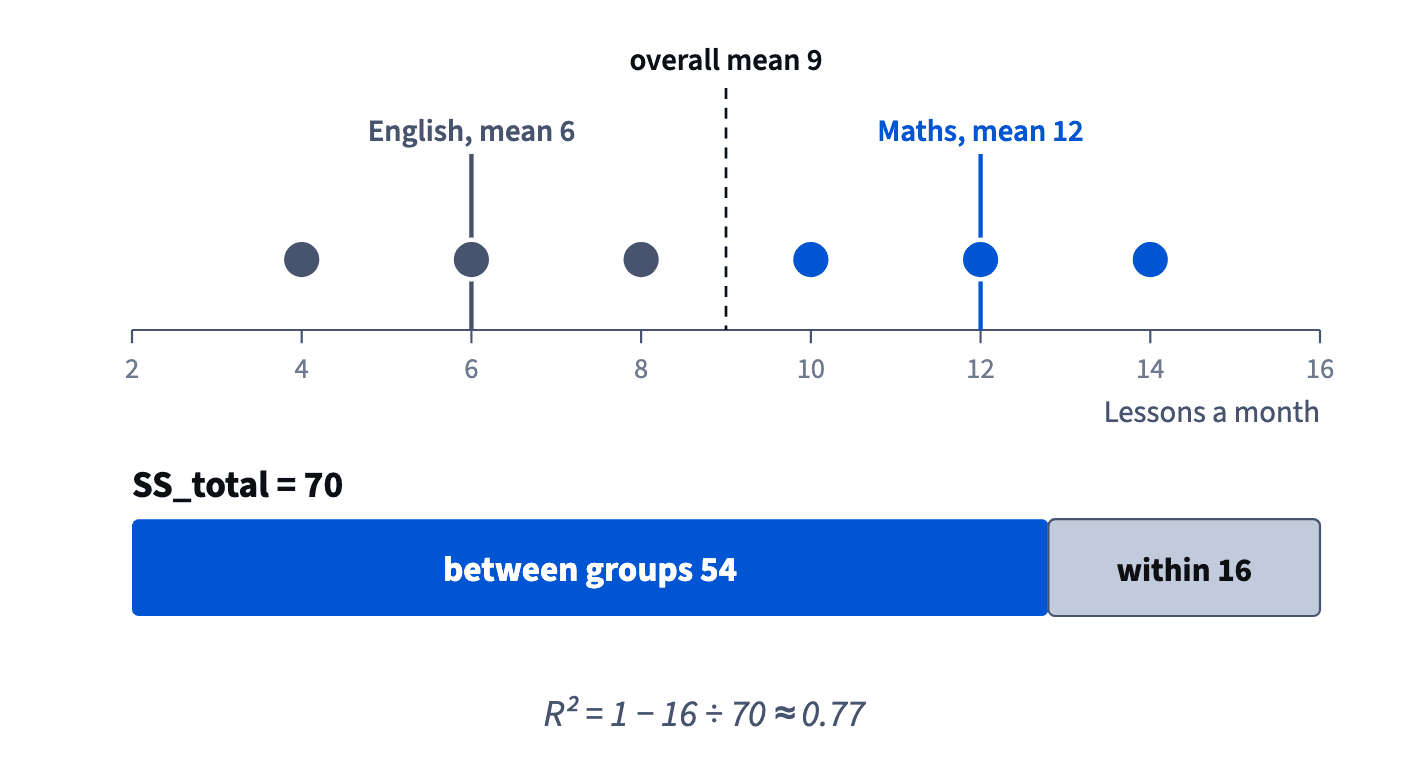
Every decomposition has the same test: add the parts back. If they don't give the total, either a part is computed wrongly or the method leaves a remainder, and that remainder needs a name before anyone reads the parts.
- DoCheck the split: 54 + 16 = 70.
- Don'tReport "volume +72,000, rate −50,000" for a gap of 16,000 without explaining the missing 6,000.
Parts that don't add up hide an unexplained remainder.
R²: the share of spread a model explains
R² turns the split into one number: R² = 1 − SS_res ÷ SS_total, where SS_res is the part a model leaves unexplained. Put differently, R² = explained part ÷ total.
For the six learners, a model that predicts each learner's group mean leaves the within part, 16, unexplained: R² = 1 − 16 ÷ 70 ≈ 0.77. The subject explains about 77% of the spread in lessons taken.
A regression line works the same way. SS_total is the spread of y around its mean, SS_res the spread of the points around the line. R² = 0 means the line explains nothing beyond the mean; R² = 1 means every point sits on the line.
Compute it as 1 − unexplained ÷ total, never as unexplained ÷ total: that gives the share left over, the opposite reading. And check the result lies between 0 and 1.
- DoR² = 1 − 16 ÷ 70 ≈ 0.77.
- Don'tR² = 16 ÷ 70 ≈ 0.23.
That is the unexplained share.
Reading R² without overclaiming
R² is easy to quote and easy to overread. It is the share of the total sum of squares a model accounts for. It is not:
- accuracy per prediction: R² = 0.77 doesn't mean each prediction is within 23%; spread is measured in squared units, and a single week can still miss widely;
- causation: subject explains 77% of the spread in lessons, but that doesn't show choosing maths makes anyone take more lessons; exam families may simply differ;
- a grade comparable across problems: weekly sign-ups are noisy, and R² = 0.3 can still be useful there, while a well-measured process might need 0.99.
One more trap: R² never falls when you add inputs to a regression, even useless ones. A higher R² from a bigger model proves little on its own.
Read R² together with the size of the leftover errors in real units, such as "usually within ±12 sign-ups a week".
- Do"The model explains about 77% of the spread; misses are usually within ±12 sign-ups."
- Don't"R² is 0.77, so our forecast is 77% accurate."
R² is a share of spread, not an accuracy.
Plan vs actual: the volume effect
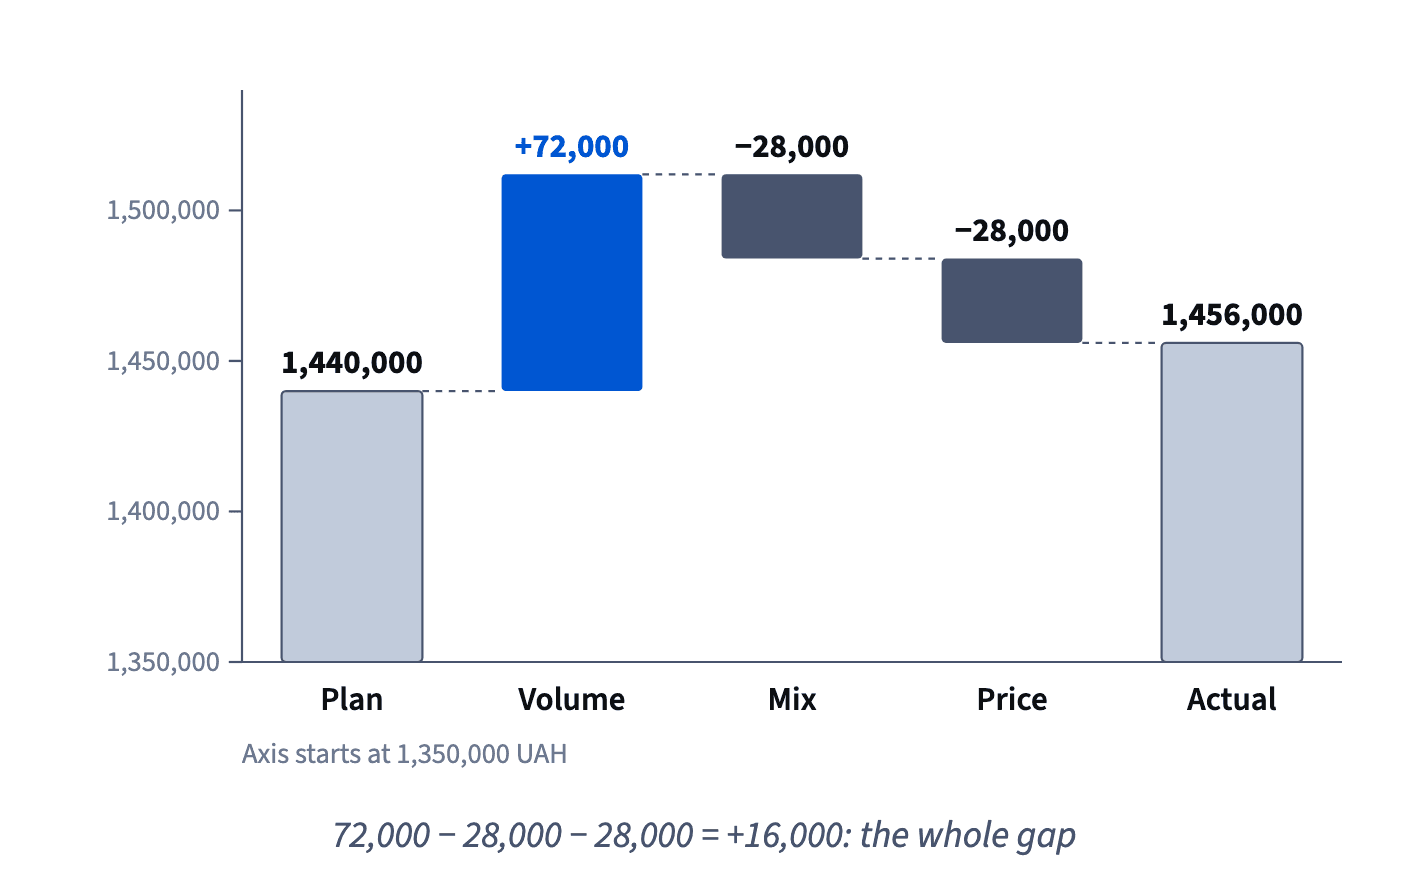
Finance uses the same splitting to explain a month. Plan: 8,000 lessons at 180 UAH of contribution each, 1,440,000. Actual: 8,400 lessons at an average of 173.33, 1,456,000. Gap: +16,000.
Two things changed: how many lessons, and what each one earned. The volume effect isolates the first by valuing the extra lessons at the plan rate:
volume effect = (actual lessons − plan lessons) × plan contribution per lesson = (8,400 − 8,000) × 180 = +72,000.
It answers "what would the extra lessons have brought if each had earned what we planned?" More lessons than planned give a positive volume effect, fewer a negative one, whatever happened to the rate.
The usual slip is valuing the extra lessons at the actual rate (400 × 173.33 ≈ 69,333). That mixes part of the rate change into the volume, and with the usual rule for the rate effect the parts no longer add up to the gap.
- DoVolume effect = (8,400 − 8,000) × 180 = +72,000.
- Don'tVolume effect = 400 × 173.33 ≈ 69,333.
Volume is valued at the plan rate.
The rate effect, and why the pairing matters
The rate effect takes the rest of the gap: the actual lessons times the change in contribution per lesson.
Rate effect = actual lessons × (actual rate − plan rate). For the month with 8,400 lessons at 173.33 against a plan of 180: 8,400 × (173.33 − 180) ≈ −56,000. With the volume effect of +72,000: 72,000 − 56,000 = 16,000, the whole gap.
Why exactly these pairs? Write the gap as L₁r₁ − L₀r₀ (1 = actual, 0 = plan) and add and subtract L₁r₀: (L₁ − L₀)·r₀ + L₁·(r₁ − r₀). The first term is volume at the plan rate, the second the rate change at the actual volume. Nothing is left over.
Pair them inconsistently, say both at plan values, and a cross term ΔL × Δr goes missing: 400 × (−6.67) ≈ −2,667 here. Pick one convention, say which, and keep it every month.
- DoVolume at the plan rate, rate at the actual volume: 72,000 − 56,000 = 16,000.
- Don'tRate effect = 8,000 × (173.33 − 180) with volume at the plan rate.
About 2,667 of the gap is then left unexplained.
Inside the rate: mix and price
A rate per lesson can fall without any price moving. The plan average of 180 was a weighted mean of subjects, as in Weighted mean and mix: 6,000 English lessons at 190 and 2,000 maths at 150. The actual month had 5,600 English and 2,800 maths, more of the thinner subject.
So the rate effect splits again:
- Mix effect: actual lessons at each subject's plan rate, minus the same lessons at the plan average: 5,600 × 190 + 2,800 × 150 − 8,400 × 180 = 1,484,000 − 1,512,000 = −28,000.
- Price effect: what each subject's own rate did, at actual lessons. English earned 185 instead of 190 after a promotion: 5,600 × (185 − 190) = −28,000. Maths was unchanged: 0.
Together: volume +72,000, mix −28,000, price −28,000, total +16,000. A mix effect appears whenever the shares of subjects change and the subjects earn differently, even at the same total volume and the same prices. Exchange-rate effects are split out the same way, through the dollar cost per lesson.
- Do"No price fell; the mix moved towards maths, which earns 40 UAH less per lesson."
- Don't"The average per lesson fell, so someone cut a price."
A shift in mix lowers the average at unchanged prices.
Computing a plan-vs-actual bridge
A clean plan-vs-actual note follows four steps:
- Plan and actual totals, and the gap.
- Volume: (L_actual − L_plan) × plan average.
- Mix: Σ actual lessons × plan rate − L_actual × plan average.
- Price: Σ actual lessons × (actual rate − plan rate), subject by subject.
Then check that volume + mix + price = gap. If not, a step used the wrong pair.
Example: plan 4,000 English at 200 and 1,000 programming at 260, so 1,060,000 and an average of 212; actual 4,500 English at 195 and 900 programming at 260, so 877,500 + 234,000 = 1,111,500. Gap +51,500. Volume: 400 × 212 = +84,800. Mix: 900,000 + 234,000 − 5,400 × 212 = −10,800. Price: 4,500 × (195 − 200) = −22,500. Check: 84,800 − 10,800 − 22,500 = 51,500.
A shift towards the higher-earning subject gives a positive mix effect, towards the lower one a negative effect.
- DoFinish with the check: 84,800 − 10,800 − 22,500 = 51,500 = the gap.
- Don'tCompute the mix effect at actual rates: 877,500 + 234,000 − 5,400 × 212.
That folds the price effect into the mix.
The same split at home
The same idea explains personal savings. A change in savings over a year splits into two parts: change = contributions + growth.

Savings went from 200,000 to 236,000 UAH, a change of 36,000. If 30,000 of new money went in during the year, growth was 36,000 − 30,000 = 6,000, about 3% of the starting balance. Most of the progress came from saving, not from the market.
The split keeps a yearly review honest: a good year in the market and a good year of saving look the same on the total. It also needs the contributions to be recorded; without them, every hryvnia added looks like return.
How it fits together: a decomposition splits a total into parts that add back exactly: sums of squares into between and within, R² from that split, plan versus actual into volume, mix and price, savings into contributions and growth. Module 6 turns to growth over time: compounding, discounting and series.
- Do"Savings +36,000: 30,000 of contributions and 6,000 of growth."
- Don't"My investments earned 36,000 this year."
30,000 of it was new money paid in.
Ready to practise?
Answer the lesson's exercises and earn 250 points the first time you finish it.
Start the exercises