

Theory
p and 1 − p
Probability as a share, its complement 1 − p, retention as 1 − churn, and why p(1 − p) peaks at 0.5.
~9 min read · 9 exercises · 250 points
Before you start
How likely is it, and how sure can we be?
Klasna, the online tutoring school whose numbers you've been checking, runs on yes-or-no outcomes: a trial learner buys or doesn't, a Club member stays or cancels, a test result is real or a fluke.
This module turns those outcomes into probabilities and asks how far you can trust them: conditional probability, expected value, many tests at once, the normal curve and statistical power. This first lesson starts with the simplest pair of all: a probability p, its complement 1 − p, and their product p(1 − p), which sits inside every standard error of a share.
A probability is a share
A probability is the share of many similar cases in which something happens. Count the cases where the event happened and divide by all the cases: p = cases with the event ÷ all cases. That is why every probability lies between 0 (never) and 1 (always), and why it can also be written as a percent: 0.24 = 24%.
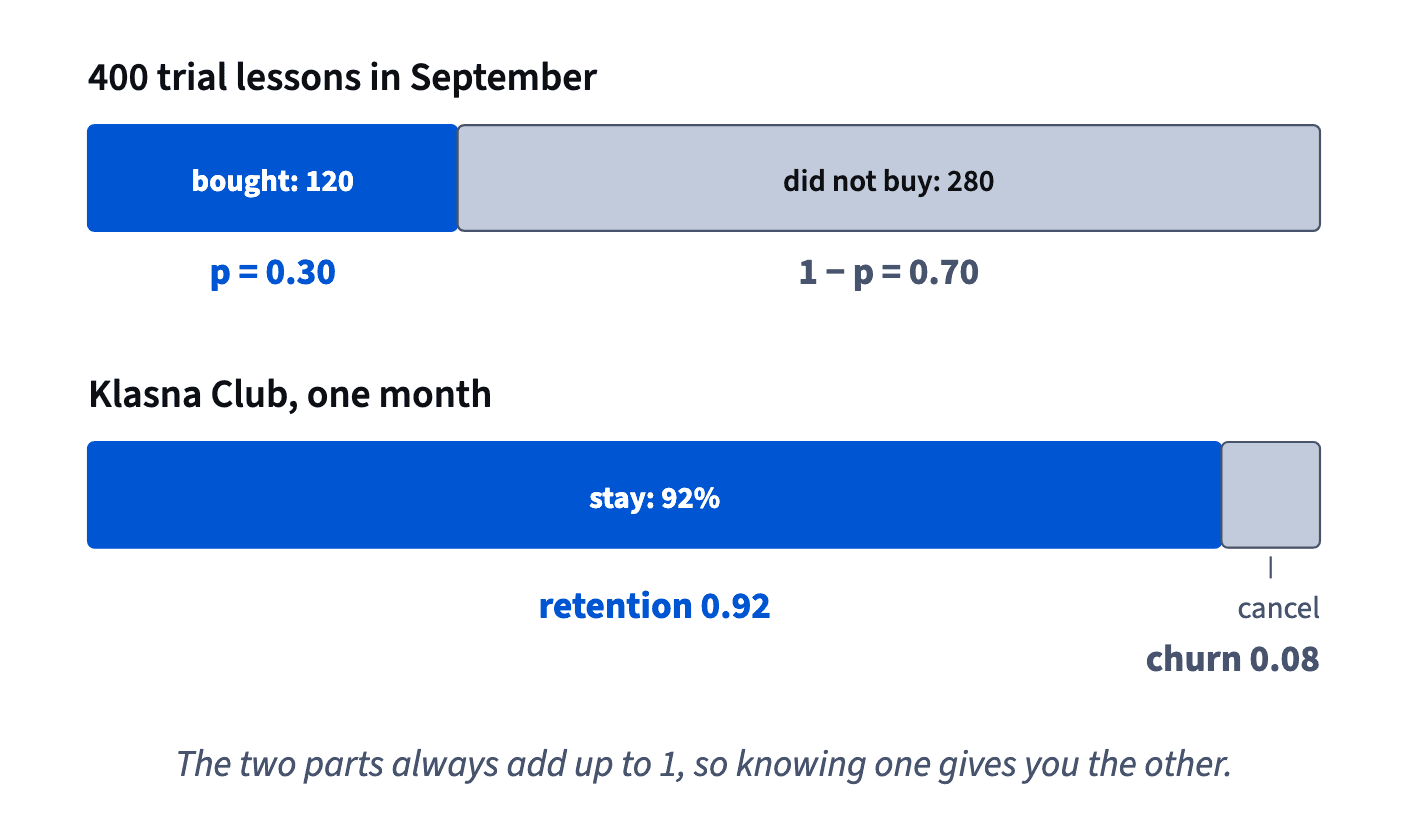
In September, 400 people took a free trial lesson at Klasna and 120 bought a package afterwards: p = 120 ÷ 400 = 0.30. For the next trial learner you can't say yes or no, but you can say 0.30: in a long run of similar learners, about 30 in 100 buy.
Two habits keep the number honest. Put the counted cases on top and all cases at the bottom; a "probability" above 1 means the fraction is upside down. And read p as a long-run share, not as a promise about one person or about the exact count in the next small group.
- Do"About 30% of trial learners buy a package: 120 of 400 in September."
A share of many similar cases, with the counts behind it.
- Don't"This learner will buy with a probability of 120."
A count is not a probability; divide by all cases.
The complement: 1 − p
The complement of an event is everything that isn't the event: for "a trial learner buys", it is "a trial learner doesn't buy". The two cover every case and never overlap, so their probabilities add up to exactly 1: P(not A) = 1 − P(A).
At Klasna, 0.30 of trial learners buy a package, so 1 − 0.30 = 0.70 don't. If 97% of lessons start on time, 3% start late or not at all. Mind the wording of that second side: "late or not at all". A complement collects every other outcome, not just the most obvious one.
Why learn a rule this simple? Because one side is often far easier to measure or to say than the other. A report that gives one share has quietly given you the other as well, and a probability that is awkward to count directly can often be found as 1 minus its complement.
- Do"30% of trial learners buy a package, so 70% leave without one."
- Don't"3% of lessons start late," when that 3% also includes lessons that never happened.
The complement of "on time" is "late or not at all"; name all of it.
Two checks before you write 1 − p
The rule P(not A) = 1 − P(A) is only as good as the "not A" you pick. Check two things first.
Every case is covered. "Buys a package" and "buys a single lesson" don't overlap, but they don't cover everyone either: some trial learners buy nothing. If 30% buy a package and 25% a single lesson, the two add up to 0.55, and the complement of "buys a package" is "a single lesson or nothing", 0.70.
No case is counted twice. "Went to a speaking club" and "used the AI partner" can both be true of the same Club member, so 1 minus one of them tells you nothing about the other.
When both checks pass, the complement is a shortcut. "Missed at least one lesson this month" is awkward to count: one miss, two, three… Its complement, "missed no lesson", is a single number, and 1 minus it gives all the rest.
- Do"85% of learners attended every lesson in May, so 15% missed at least one."
One clean complement replaces counting one, two, three misses.
- Don't"25% bought a single lesson, so 75% bought a package."
Forgets everyone who bought nothing.
Retention is 1 − churn
Subscriptions give the most common complement in product work. Churn is the share of members who cancel in a period; retention is the share who stay. Every member does one or the other, so retention = 1 − churn.
Klasna Club loses 8% of its members in a typical month, so its retention is 1 − 0.08 = 0.92, or 92%. In March churn was 6.5%, so retention was 100 − 6.5 = 93.5%. Working in percent, subtract from 100; working in shares, subtract from 1. Never mix the two: 1 − 6.5 means nothing.
Two things follow. A report that shows only churn already shows retention, so one column is enough. And when a formula needs the share that survives a month, as in Compounding, where a year of 8% monthly churn keeps 0.92¹² ≈ 0.37 of members, it wants 1 − churn, not churn itself.
- Do"Monthly churn 6.5%, so monthly retention 93.5%."
- Don't"Retention = 1 − 6.5 = −5.5."
Mixes a percent with a share; use 100 − 6.5 or 1 − 0.065.
p(1 − p): how hard the next answer is to guess
Code each trial learner as 1 if they bought and 0 if they didn't. The spread of those zeros and ones, their variance from Why we square, comes out to exactly p(1 − p). It measures how unpredictable a yes/no outcome is.
Try some values: p = 0.1 gives 0.1 × 0.9 = 0.09; 0.3 gives 0.21; 0.5 gives 0.25; then it falls back: 0.7 gives 0.21 and 0.9 gives 0.09. Two patterns stand out: the peak is at 0.5, and swapping p and 1 − p changes nothing.
A picture explains why. p(1 − p) is the area of a rectangle with sides p and 1 − p. The sides always add up to 1, and of all such rectangles the square holds the most area.
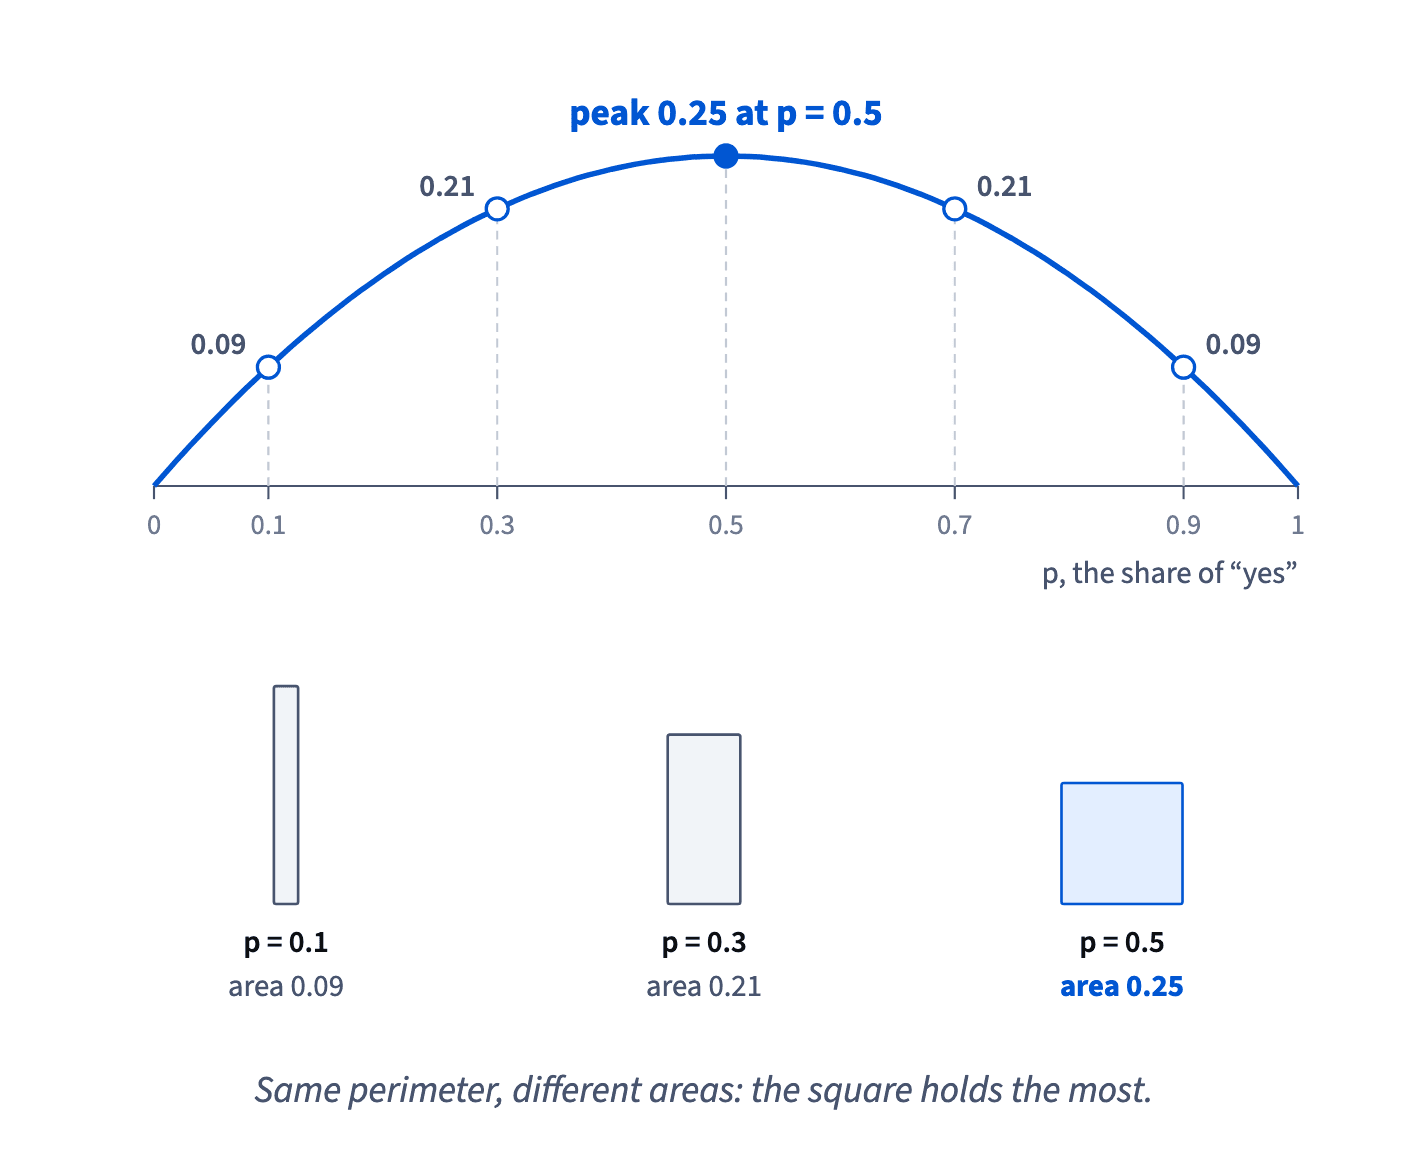
At 0.5 the next answer is a coin toss; at 0.02 you'd guess "no" and nearly always be right. So among funnel steps measured on the same number of people, the one closest to 0.5 has the largest p(1 − p).
- Do"Conversion of 0.45 is near the middle, so this step is about as unpredictable as a yes/no gets."
- Don't"The higher the conversion, the larger p(1 − p)."
It grows only up to 0.5, then falls in mirror.
p(1 − p) inside sample-size formulas
p(1 − p) turns up wherever a formula measures the noise in a share. The sample-size formula for an A/B test on conversion adds it for both variants: p₁(1 − p₁) + p₂(1 − p₂). The noisier the outcome, the more people the test needs.
Computing it takes two steps: first the complement, then the product. For a baseline conversion of 4%: 1 − 0.04 = 0.96, and 0.04 × 0.96 = 0.0384. For a second variant at 5%: 0.05 × 0.95 = 0.0475. Together that is 0.0859.
Notice what happens with rare events. When p is small, 1 − p is almost 1, so p(1 − p) is almost p itself: 0.0384 against 0.04. That gives a quick sanity check. For conversions of a few percent, p(1 − p) should come out a little under p. A result above p, or near 0.25, usually means a percent slipped in where a share belongs: 4 instead of 0.04.
- Dop₁ = 0.04 → p₁(1 − p₁) = 0.04 × 0.96 = 0.0384, just under 0.04.
- Don'tp₁(1 − p₁) = 4 × 96 = 384.
Percents instead of shares; use 0.04 and 0.96.
The standard error of a share
The standard error of a share, from Square roots and √n, is SE = √(p(1 − p) ÷ n): the noise of one yes/no outcome, p(1 − p), spread over n people, then square-rooted to get back to the units of a share.
For Klasna's trial lesson, p = 0.30 and n = 400: √(0.21 ÷ 400) = √0.000525 ≈ 0.023. So the 30% is known to about ±2.3 percentage points per standard error.
Because p(1 − p) is symmetric, so is the standard error. A share of 20% and a share of 80% measured on the same number of people have exactly the same SE, since 0.2 × 0.8 = 0.8 × 0.2 = 0.16. Reporting "80% are satisfied" instead of "20% are not" changes the headline, not the precision.
What does change the SE is how close p is to 0.5 and how many people were measured. A share near 0 or 1 is pinned down with fewer people than a share near the middle.
- Do"30% bought, ± about 2.3 pp per standard error (n = 400)."
- Don't"80% satisfied is a more precise number than 20% dissatisfied."
Same n, same p(1 − p) = 0.16, same SE.
Unknown share? Plan with 0.5
Before a survey or a test, the share you want to measure is unknown, yet the standard error formula needs a p. Use p = 0.5. It gives the largest p(1 − p), 0.25, and so the largest SE for your n: the worst case.
Formula: p: the observed share; n: how many people it was measured on. · shown above
For 625 parents: √(0.25 ÷ 625) = 0.5 ÷ 25 = 0.02, or 2 percentage points. If the true share turns out to be 20%, p(1 − p) is 0.16 and the SE drops to √(0.16 ÷ 625) = 0.016. Whatever the answer, the precision can only be better than planned.
A low guess is the risky one. Plan with 10% and get a true share near 50%, and the error is bigger than the sample was built for.
How it fits together: a probability is a share; its complement is 1 − p; their product p(1 − p) is the noise of a yes/no outcome and peaks at 0.5. The next lesson adds a condition: the probability of A given B, and the 2×2 table behind precision and recall.
- Do"We don't know the share yet, so we size the survey for p = 0.5."
- Don't"Surely few will say yes, so we plan with 10%."
If the guess is wrong, the sample is too small.
Ready to practise?
Answer the lesson's exercises and earn 250 points the first time you finish it.
Start the exercises