

Theory
Flows: customers and cash
One rule for every stock, end = start + in − out: MRR, churn, NRR and GRR; profit vs cash, working capital, DSO and runway; CAC payback and incrementality against a holdout.
~9 min read · 10 exercises · 250 points
Before you start
One rule for every stock
The last bridge into unit economics, still at Klasna. Many business numbers are stocks: subscribers, monthly recurring revenue, cash. They change only through flows in and out, like water in a bathtub.
Using Klasna Club's March revenue, you'll apply one rule to every stock, compute churn and revenue retention from the right starting base, follow cash in and out to see how long the money lasts, and check how fast new customers pay back what they cost.
Stocks and flows: end = start + in − out
Many business numbers are stocks: amounts measured at a moment, like subscribers, monthly recurring revenue (MRR) or cash in the bank. A stock changes only through flows over a period, what comes in and what goes out, like water in a bathtub. One rule covers them all: end = start + in − out.
For MRR the flows have names: new (members who joined), expansion (existing members paying more), contraction (paying less) and churned (revenue of members who left). So MRR_end = MRR_start + new + expansion − contraction − churned.
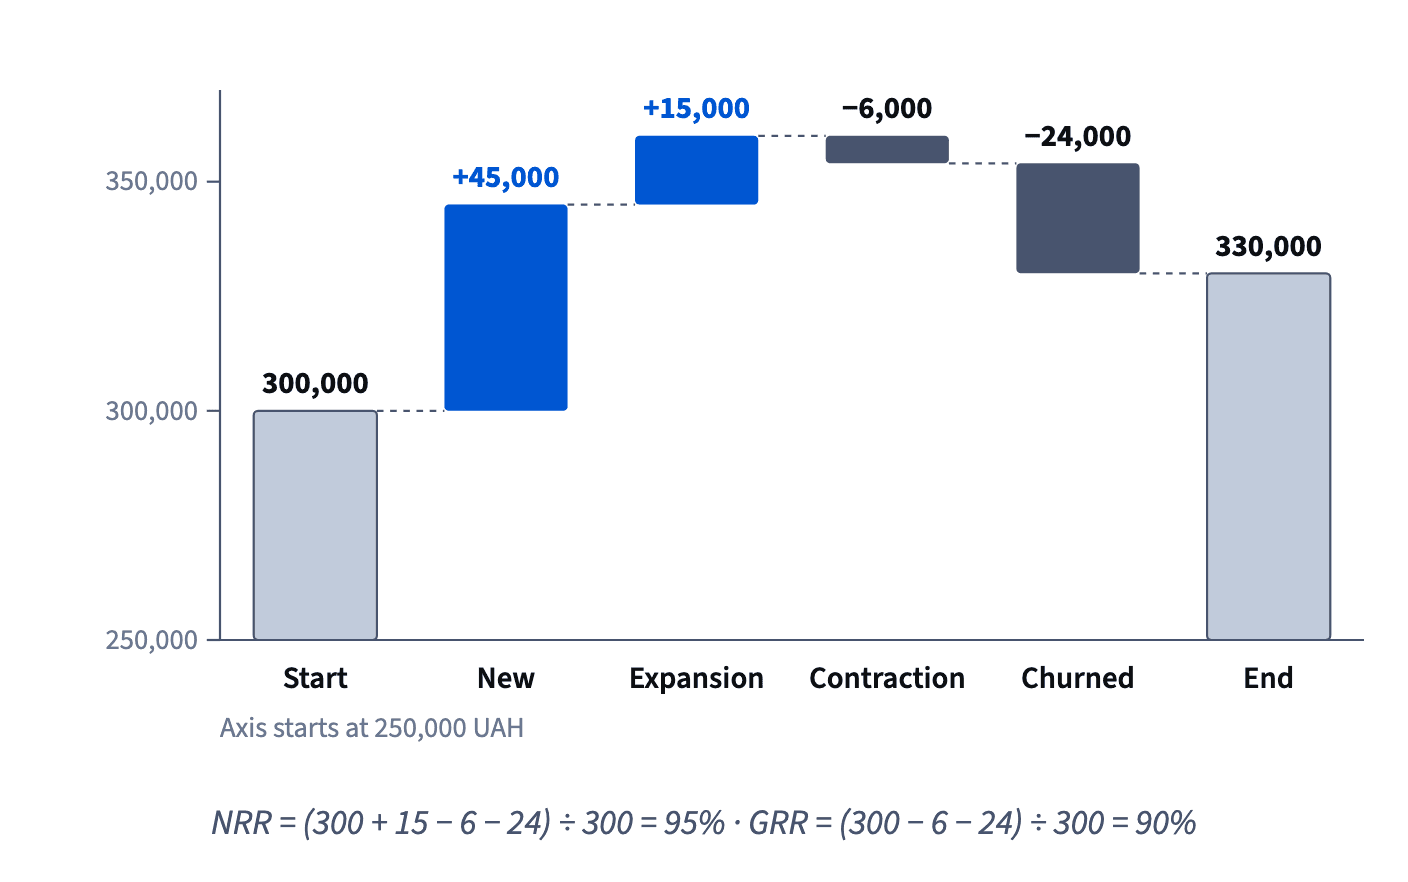
Klasna Club started March at 300,000: 300,000 + 45,000 + 15,000 − 6,000 − 24,000 = 330,000. April then started at 330,000, because each period's end is the next one's start.
The rule is also a check. If a report's end figure doesn't equal start plus the listed flows, a flow is missing or double-counted.

- Do330,000 + 50,000 + 12,000 − 9,000 − 27,000 = 356,000: the bridge adds up.
- Don'tReporting April's end MRR without checking it against March's end.
Each period's start must be the previous period's end.
NRR divides by the start
Retention ratios for revenue all divide by the start of the period, because they ask what happened to the revenue you already had. Revenue churn = churned ÷ start. NRR, net revenue retention, = (start + expansion − contraction − churned) ÷ start: what last period's members pay now, as a share of what they paid then.
New revenue stays out of NRR on purpose: it comes from people who weren't there at the start. In March, Klasna Club had a start of 300,000, expansion 15,000, contraction 6,000 and churn 24,000: NRR = 285,000 ÷ 300,000 = 95%, and churn = 24,000 ÷ 300,000 = 8%. Total MRR still grew to 330,000, thanks to 45,000 of new members.
So NRR below 100% means last period's members shrink as a group, even while total MRR rises. Above 100%, their expansion outweighs contraction and churn.
- DoNRR = (330,000 + 12,000 − 9,000 − 27,000) ÷ 330,000 ≈ 92.73%.
- Don'tNRR = 356,000 ÷ 330,000 ≈ 108%.
Includes the 50,000 from new members, so it isn't retention any more.
GRR: retention without expansion
GRR, gross revenue retention, is NRR with expansion left out: GRR = (start − contraction − churned) ÷ start. It answers a stricter question: how much of the revenue you had did you keep, before anyone upgraded?
Because the only difference is the expansion term, which can only add, GRR ≤ NRR always, and GRR can never pass 100%. In April Klasna Club started at 330,000 with expansion 12,000, contraction 9,000 and churn 27,000: GRR = 294,000 ÷ 330,000 ≈ 89.09%, NRR ≈ 92.73%.
Read the two together. A high NRR with a low GRR means many members leave or downgrade while a few pay much more: the revenue holds up, but the base is leaky. When the two are close, expansion is small and NRR mostly reflects how well members stay.
Both divide by the start. Dividing by the end, or by an average, gives a different and harder-to-compare number.
- Do"GRR 89%, NRR 93%: most of the gap is a few upgrades, so watch the 11% we lose."
- Don't"GRR 104% this month."
GRR leaves expansion out, so it can't exceed 100%.
Profit is not cash: the timing flows
Cash is a stock too, but its flows aren't the lines of the profit statement. Profit counts a lesson when it is taught; cash moves when someone pays. Three balances hold the difference:
- receivables (AR): invoiced but not yet paid to you, as when Klasna for Teams, the school's lessons for companies, bills 300,000 on 60-day terms;
- payables (AP): bills you haven't paid yet;
- deferred revenue: prepaid lessons not yet taught.
So Δcash ≈ profit − ΔAR + ΔAP + Δdeferred. Growing receivables take cash away; growing payables and prepayments bring it in early. A month with 200,000 of profit, AR +150,000, AP +30,000 and deferred +80,000 gains 200,000 − 150,000 + 30,000 + 80,000 = 160,000 of cash.
The money tied up this way is working capital: WC = AR − AP − deferred. A profitable month can still lose cash when receivables grow faster than profit; prepaid packages are the friendly case.
- DoΔcash = 200,000 − 150,000 + 30,000 + 80,000 = +160,000.
- Don'tΔcash = 200,000 + 150,000 + 30,000 + 80,000 = 460,000.
Receivables that grow are cash not yet received; subtract them.
DSO: how many days customers take to pay
DSO, days sales outstanding, turns the receivables stock into time: DSO = AR ÷ yearly credit sales × 365. The share AR ÷ sales says what part of a year's invoices is still unpaid; times 365 gives it in days.
Klasna for Teams has 450,000 UAH of receivables on 2,190,000 of credit sales a year: 450,000 ÷ 2,190,000 ≈ 0.2055 of a year, × 365 = 75 days. Customers pay about two and a half months after the invoice, longer than the 60-day terms on paper.
The other side works the same way: DPO, days payables outstanding, counts how long you take to pay. With no inventory, the cash conversion cycle is DSO − DPO: the days your cash is out before it comes back. At 75 days of DSO and 20 of DPO, each hryvnia of sales is out for 55 days.
Keep the units consistent: yearly sales go with 365, quarterly sales with about 91.
- DoDSO = 450,000 ÷ 2,190,000 × 365 = 75 days, against 60-day terms.
- Don'tDSO = 450,000 ÷ 182,500 (one month of sales) × 365.
Monthly sales with 365 days inflates DSO twelvefold; use yearly sales.
Runway = cash ÷ net burn
Runway turns the cash stock into time: runway = cash ÷ monthly net burn. Net burn is cash out minus cash in per month, the monthly fall in the cash stock. It is not the loss on the profit statement.
The two differ for the reasons in the cash formula: receivables, payables and prepayments shift money in time. Klasna with 2,400,000 UAH in the bank, 950,000 going out and 650,000 coming in each month burns 300,000: runway = 2,400,000 ÷ 300,000 = 8 months. If its books show a loss of only 180,000, dividing by that would promise about 13.3 months, five months that aren't there.
Formula: Δ: the change over the period; WC: working capital, the money tied up in day-to-day operations. · shown above
The reverse also happens. A company with a profit on paper can burn cash while its receivables grow, so a profitable company can still have a short runway.
Runway assumes the burn stays as it is. Use the average net burn you expect ahead, not one unusual month.
- DoRunway = 2,400,000 ÷ (950,000 − 650,000) = 8 months.
- Don'tRunway = 2,400,000 ÷ 180,000 (the monthly loss) ≈ 13 months.
The loss isn't the cash that leaves; burn is.
CAC, payback and LTV ÷ CAC
CAC is what one new customer cost: spend ÷ new customers. Payback is the first month k in which the cumulative margin from that customer reaches CAC. It is a count of months that must cover something, so you take the first month that does, never a fraction rounded down.
With churn, later months are worth less, because fewer members are still there. Expected margin in month k is margin × (1 − churn)^(k − 1), and the cumulative sum is the finite geometric series from Geometric series. For a member leaving 150 UAH a month at 4% churn, the sum after k months is 3,750 × (1 − 0.96^k): about 1,153 after 9 months and 1,257 after 10. With CAC = 1,200, payback falls in month 10, two months later than 1,200 ÷ 150 = 8 suggests.
Letting k run forever gives LTV = margin ÷ churn = 3,750, so LTV ÷ CAC = 3,750 ÷ 1,200 ≈ 3.1.
- Do"Cumulative margin passes 1,200 in month 10 (≈ 1,257), so payback is month 10."
- Don't"Payback = 1,200 ÷ 150 = 8 months."
Ignores churn; fewer members are left to pay in later months.
Incremental CAC: count only what the spend added
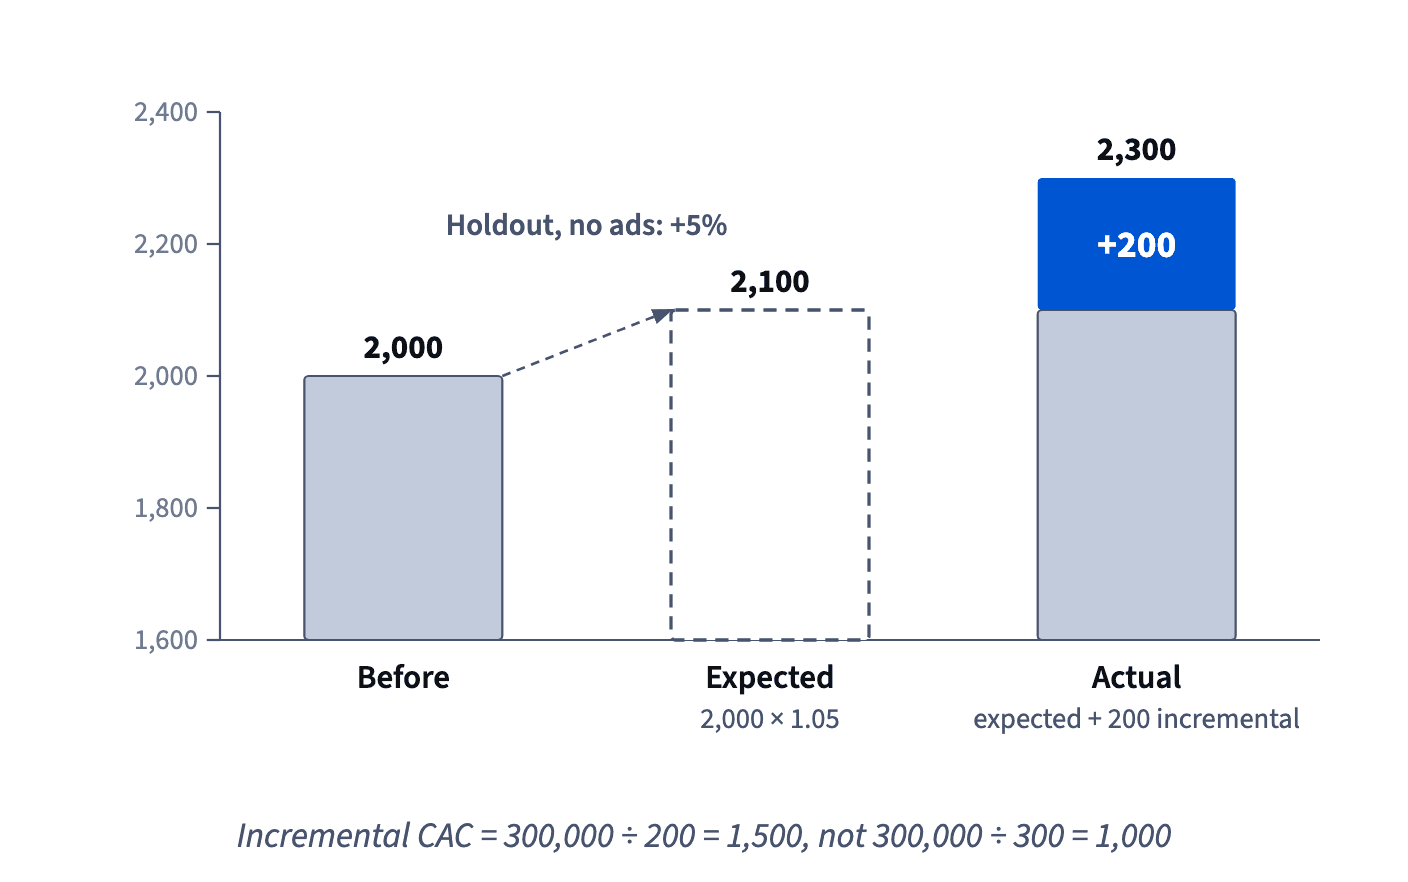
Plain CAC credits the spend with every new customer, including those who would have come anyway. To count only what the spend added, build the counterfactual baseline from What do we divide by? Denominator traps: expected = before × the holdout's growth, where the holdout is a comparable group with no campaign. Then incremental = actual − expected, and incremental CAC = spend ÷ incremental.
Klasna ran ads only in Lviv: 2,000 sign-ups before, 2,300 during, while the rest of the country grew 5%. Expected = 2,000 × 1.05 = 2,100, so only 200 are incremental. With 300,000 UAH spent, incremental CAC = 1,500, not 300,000 ÷ 300 = 1,000.
How it fits together: every number here is a stock moved by flows, read on the right base: MRR and NRR on the start, cash through timing, runway and DSO as time, CAC only on what the spend added. The next module, money over time, prices waiting: interest, loans, inflation and taxes.
- DoExpected 800 × 1.10 = 880; incremental 980 − 880 = 100; CAC 140,000 ÷ 100 = 1,400.
- Don'tCAC = 140,000 ÷ (980 − 800) ≈ 778.
Credits the ads with growth the holdout shows would have happened anyway.
Ready to practise?
Answer the lesson's exercises and earn 250 points the first time you finish it.
Start the exercises