

Theory
Winners that don't repeat: luck, skill and closed funds
Where yesterday's top funds rank later, how dropping closed funds flatters the average and how long it takes to tell skill from luck.
~7 min read · 7 exercises · 250 points
Before you start
Ride the winners?
Still May at Zapas. Yesterday Grace showed what costs do to the average active dollar; today Ethan arrives with a spreadsheet of 20 active funds with 14-year records. His plan: list the top five and let users ride the winners.
You'll split the record in two, pick the winners on the first half and check them on the second, the only fair test. Then you'll see what the result says about luck and skill.
Pick on the past, check on the future
A ranking of funds by past return always has a winner, even when nobody has any skill. The Zapas data holds 20 synthetic active funds with 14-year records, built with no skill at all, and one of them still came first with 9.88% a year, almost 3 points above the index. The question that matters for a user is different: does a fund that ranked high before keep ranking high afterwards?
The fair test splits the history in two. Use the first period only to pick the winners, as a user would have done at that moment. Then look at the second period, which the choice could not have seen. If skill drives the ranking, the winners should stay near the top. If luck drives it, they scatter: some above the middle, some below, roughly at random.
In the Zapas data the period-1 top five ranked 13th, 8th, 9th, 7th and 20th (closed) in period 2. Not one stayed in the top five, and not one beat the index fund.
Chart data
| Fund | Years 1–7 | Years 8–14 |
|---|---|---|
| F19 Star Growth | 9.88 | 4.1 |
| F02 Ottervale Focus | 8.58 | 5.21 |
| F16 Tallowmere Opportunities | 8.18 | 4.52 |
| F18 Fernhollow Select | 7.78 | 5.43 |
| F04 Brackwater Dynamic | 7.67 | 0.56 |
Show 1 more row
| Index fund | 7 | 6 |
- Do“Choose the top five on years 1–7, then judge them on years 8–14.”
- Don't“These five funds have the best 14-year records, so they are the ones to own.”
The ranking already used the years it claims to predict.
When winners scatter, it was mostly luck
In data built with no skill, each period's return is the index plus a fresh draw of luck minus the fee. The funds that drew the best luck in period 1 look like stars. In period 2 they draw again, and on average they get average luck, so they land around the index minus their fee. Last period's luck doesn't carry over.
That is exactly the pattern in the Zapas data: the top five of period 1 averaged 3.96% in period 2, slightly below the 4.20% of all 20 funds and well below the index fund's 6.00%. The fees are still there in period 2; the luck is gone.
Real fund records look much the same: past winners mostly drift back to the pack after their costs. A high ranking tells you mainly who was lucky, and only a little about who will be. Persistent results at the bottom are more common, because high costs repeat every year.
Chart: The top 5 of years 1–7, and what they did in years 8–14 · shown above
- Do“Their period-1 lead mostly came from luck, so expect about the index minus fees.”
- Don't“They beat the index for seven years, so they'll keep beating it.”
Survivorship: the funds you can no longer see
Funds that do badly rarely stay around. Their providers close them or merge them into another fund, and the record disappears from today's lists. This is survivorship bias: a sample made only of the survivors looks better than the full group that started.
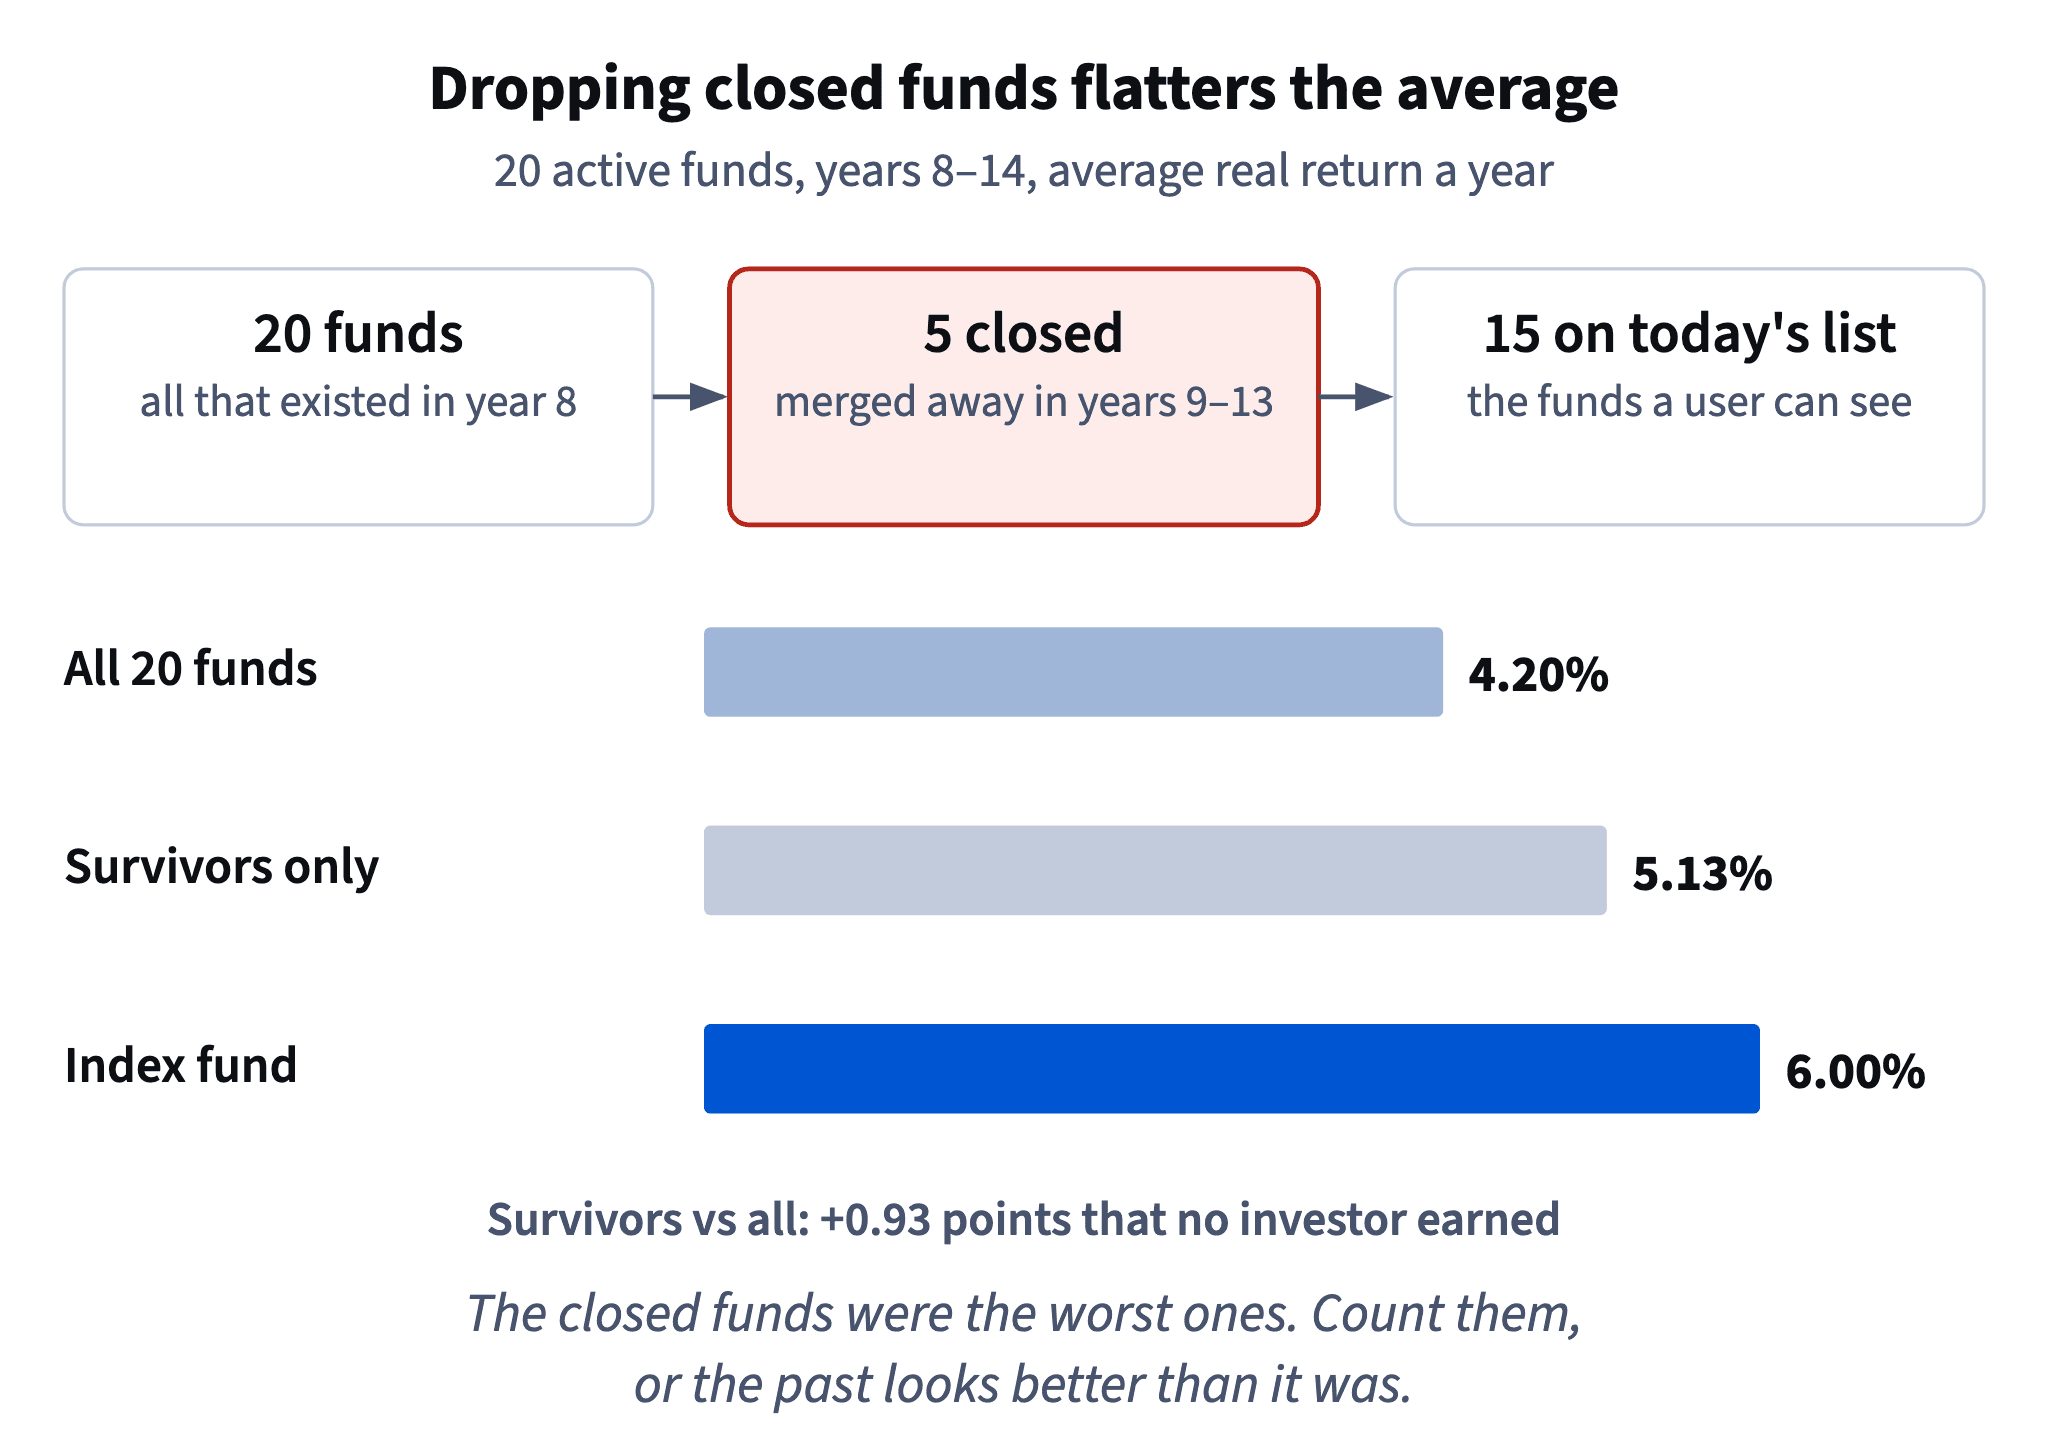
In the Zapas data, 5 of 20 funds closed in years 9–13, and they were the five worst of period 2. All 20 averaged 4.20% a year in years 8–14; the 15 survivors averaged 5.13%. Dropping the closed funds adds 0.93 points a year that no investor ever earned, because real people held the closed funds until they shut.
So whenever you see "the average active fund returned X", ask what the starting list was. The fair denominator is every fund that existed at the start of the period, including the ones that later vanished. The same trap shows up in start-ups, apps and trading strategies: the failures stop reporting.
- Do“Average every fund that existed in year 8, closed ones included.”
- Don't“The funds on the platform today returned 5.13% on average.”
True, and misleading: the losers were removed from the list.
Choose the denominator before you look
Most misleading performance claims don't use false numbers. They use a convenient list. "Funds on our platform", "strategies still running", "apps in the top 100" are all lists filtered by survival, and survival is correlated with good results.
The fix is to decide the list before looking at the outcome: every fund that existed on the start date, every user who signed up in March, every strategy that was launched. Then follow each one to the end of the period, and if it closed, count its result up to the closing date. That is how the 4.20% for all 20 funds is built: the closed funds' returns run until the year they shut.
For a product, this is also a trust question. A comparison screen that silently drops failures will look better at launch and worse the day someone notices.
- Do“All 20 funds open in year 8, followed to year 14 or to closing.”
- Don't“Our 15 active funds beat inflation by 5.13% a year.”
Skill hides in noise for a very long time
A fund's yearly result relative to the index wanders up and down; how far it typically wanders is its tracking error. The average of n years is less noisy, but only with the square root of n: its standard error is tracking error ÷ √n. You can trust an edge when it is at least about two standard errors.
Put in realistic numbers, a true edge of 1 point a year and a tracking error of 6, and you need (2 × 6 ÷ 1)² = 144 years of data. A seven-year record has a standard error of about 2.3 points, so a 2–3 point lead over seven years is entirely consistent with pure luck.
That's the practical answer to "some managers must be good": maybe, but nobody, including the managers, can show it in a human lifetime from returns alone. The standard error lesson in the statistics course explains the √n rule.
- Do“A 2.9-point lead over 7 years is within the noise; it proves nothing either way.”
- Don't“Seven years is a long record, so the lead must be skill.”
Factor tilts: a rule-based active bet
Between pure index funds and stock pickers sit funds with a tilt: they follow a written rule that leans towards one kind of company, such as cheap ones compared with their profits, small ones, or recent winners. They are often cheaper than classic active funds and easier to explain.
But a tilt is still a departure from the market. It holds more of some companies and less of others, so its result differs from the market's, and in the arithmetic of the average investor someone else must hold the other side. Such tilts have had long periods ahead of the market and long periods behind it, long enough to test any user's patience.
For Zapas the rule is simple: the default is global, broad and market-weighted. Anything else is called an active bet and is judged like one, after all costs, with the same caution about short records.
- Do“This fund tilts to small companies; that's an active bet and may trail for years.”
- Don't“It follows a rule, so it's passive.”
Passive means holding the market, not just following rules.
Ready to practise?
Answer the lesson's exercises and earn 250 points the first time you finish it.
Start the exercises