

Theory
Volatility and a typical bad year
Standard deviation of yearly returns, what a typical bad year and the worst year look like for stocks and short bonds.
~7 min read · 7 exercises · 250 points
Before you start
Is −12% normal?
March at Zapas, and the beta users are writing to support more often. One question tops the list: "My balance is −12% this month. Is this normal, or is something broken?" Ethan would like to reply that markets go up on average.
As the PM you'll answer a lot of these, so this month is about how much users can lose. Today you'll look at how much a single year really swings and what a typical bad year looks like.
The average year is not a typical year
An average return squeezes many very different years into one number. For Tessaro World over 40 synthetic years it is +10.3% a year in dollars, but the years behind it run from −30.0% to +34.0%.
That is why an average says little about next year. In our history, 9 of 40 years lost money. A user who joins and meets one of those years early sees a minus, not +10%.
Chart data
| Year | World stocks | Short bonds |
|---|---|---|
| 1 | 25.7 | 4.8 |
| 2 | -7.3 | 4.2 |
| 3 | 13.2 | 3.7 |
| 4 | -6.1 | 5.1 |
| 5 | 17.5 | 4.1 |
Show 35 more rows
| 6 | 13.6 | 5 |
| 7 | 20.7 | 4.8 |
| 8 | 9.7 | 4.1 |
| 9 | 18.8 | 4.8 |
| 10 | -4.2 | 3.6 |
| 11 | 6.4 | 4.7 |
| 12 | 14.6 | 4 |
| 13 | 13.1 | 4 |
| 14 | 17.1 | 3.9 |
| 15 | 2.1 | 2.9 |
| 16 | 24.2 | 5.7 |
| 17 | 28.3 | 4.1 |
| 18 | 0.6 | 3.4 |
| 19 | 2.5 | 4.2 |
| 20 | 16 | 3.7 |
| 21 | -22 | 3.9 |
| 22 | -30 | 6.1 |
| 23 | 28 | 4.2 |
| 24 | 18 | 4.4 |
| 25 | 15 | 5.3 |
| 26 | 8.9 | 4.5 |
| 27 | -2 | 5.2 |
| 28 | 14.3 | 4.4 |
| 29 | 11 | 4.4 |
| 30 | -1.9 | 4.1 |
| 31 | 22 | 5.7 |
| 32 | 3.7 | 5.7 |
| 33 | 26.8 | 3.2 |
| 34 | 14 | 3.9 |
| 35 | -4 | 5 |
| 36 | -18 | 6.5 |
| 37 | 6 | 7.5 |
| 38 | 34 | 6.2 |
| 39 | 32.7 | 6 |
| 40 | 29.2 | 4.4 |
The width of outcomes is called volatility: how much returns swing around their average. Stocks swing a lot; short bonds hardly at all. Their yearly returns stayed between +2.9% and +7.5% and never fell below zero.
For an investing app, this means every "average" on a screen needs company: how often a year is negative and how bad the worst year was. Users judge the app in the bad years, not in the average ones.
- Do"Average +10.3% a year; 9 of 40 synthetic years were negative, the worst −30%."
- Don't"Markets go up about 10% a year."
An average sold as a typical year.
Standard deviation in plain words
The standard deviation measures how far returns usually land from their average. A small SD means years look alike; a large one means they jump around.
For an investor it becomes useful once you turn it into two years people can picture:
- a typical bad year = average − 1 SD;
- a typical good year = average + 1 SD.
For Tessaro World: 10.3 − 14.7 = −4.4% and 10.3 + 14.7 = +25.0%. For short bonds, with an average of 4.635% and an SD of 0.970 (4.6 and 1.0 rounded): 4.635 − 0.970 = 3.7%, so even their bad year earns something.
Remember what the band leaves out. In our data 28 of 40 years fell inside it, so about one year in three landed outside, and the worst, −30.0%, is far below the typical bad year. SD describes ordinary swings, not the deepest fall.
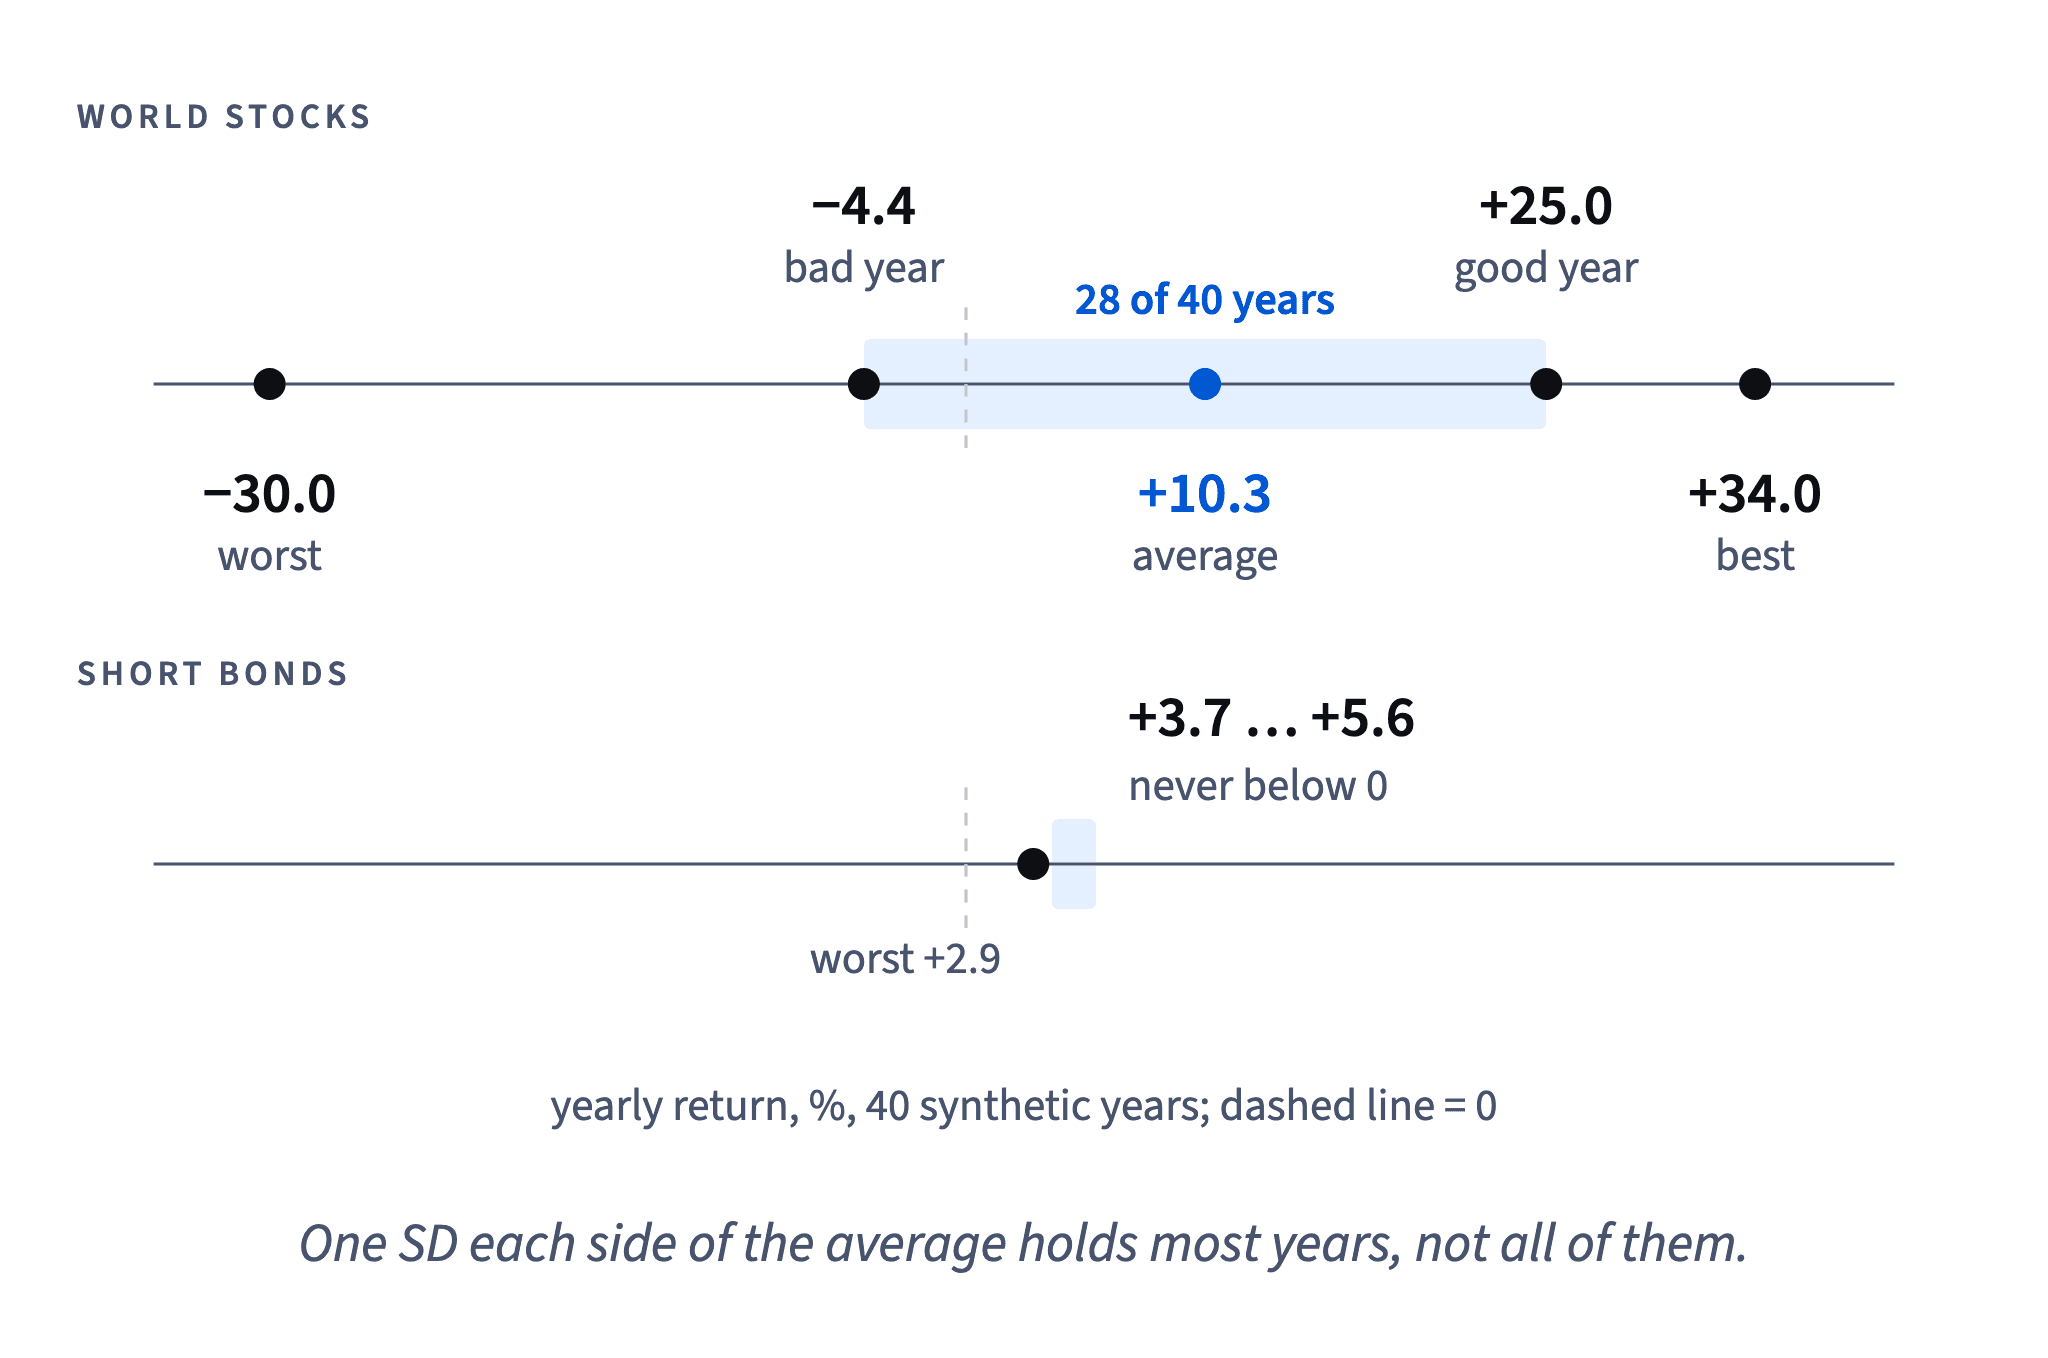
Chart: Tessaro yearly returns, 40 synthetic years · shown above
- Do"In a typical bad year this mix fell about 4%; in the worst of 40 years, 30%."
- Don't"Volatility: 14.7%." with nothing else.
Correct, but meaningless to most users.
Long-run average vs next year
An average return is what patient owners received across many years. It is not a forecast for any single year.
The wider the swings, the less the average tells you about the next twelve months. With an SD of 14.7 points around +10.3%, next year could be a typical bad one (−4.4%), a typical good one (+25.0%) or something outside both. In our 40 synthetic years, the worst was −30.0%, the best +34.0%.
The average becomes useful only over long periods, when good and bad years have had time to mix. That's why Zapas talks about horizons of five years or more, and why a first-year promise is a trap: the user who joins just before a bad year will remember the broken promise, not the long-run average.
Short bonds are the opposite case: their SD is 1.0, so next year looks a lot like their average, but that average is low.
- Do"Over 10+ years the average matters; any single year can be −30% to +34%."
- Don't"Expect about +10% in your first year."
Three numbers that describe risk
A single number can't describe how risky an investment feels. Use three, each answering a different question:
- Standard deviation: how much do ordinary years swing? World stocks 14.7 points, short bonds 1.0.
- Typical bad year (average − 1 SD): what does a normal disappointment look like? World −4.4%, short bonds +3.7%.
- Worst year: what is the deepest single-year loss so far? World −30.0% (year 22), short bonds +2.9%.
Next lesson adds a fourth: how far a portfolio can fall across several years in a row, and how long it takes to come back. One bad year rarely tells the whole story; a crash often stretches over two.
Write all of them in the same units and the same period: yearly, in the same currency, nominal or real. Mixing a monthly worst case with a yearly average confuses everyone.
Chart: Tessaro yearly returns, 40 synthetic years · shown above
- Do"SD 14.7, a typical bad year −4.4%, the worst year −30.0%."
Showing risk to users
Most people don't think in standard deviations. They think in stories: "how bad can a year get?" A risk line on a product screen should answer that question in money or percent they can feel.
A good pattern names two cases: an ordinary bad year and the worst one seen so far. "In a typical bad year this fell about 4%; in the worst of 40 synthetic years, 30%." Both numbers come straight from the data: 10.3 − 14.7 = −4.4%, and year 22's −30.0%.
Dataset · 40 rows
Tessaro market, 40 synthetic years (nominal %, inflation %)
First 5 of 40 rows
Turning percent into money helps even more: on 10,000 dol., a 30% fall is 3,000 dol. gone on paper. People who have pictured that number in advance are less surprised when it happens.
Label the source honestly. Our data is synthetic and the future can be worse than the worst year in it. A word like "so far" or "in our history" keeps the line from becoming a promise.
- Do"On 10,000 dol., the worst synthetic year would have meant −3,000 dol. on paper."
- Don't"Risk level: 4 of 7."
A score with no picture of a loss behind it.
Months are noisier than years
Checking a portfolio monthly shows more red than checking it yearly. In the Tessaro history a month averaged +0.81% with an SD of 3.62 points, so a typical bad month is about 0.81 − 3.62 = −2.8%.
Falls of 5% or more happened in 25 of 480 months, 5.2% of the time: roughly once every year and a half. A user who invests for 20 years will meet more than a dozen of them. A −10% month is rare: once in 480. The worst was −11.15%, in year 22.
Dataset · 40 rows
Tessaro World month by month, 40 synthetic years (%)
Monthly returns of the world stock fund, nominal, in dollars: 480 months. The average month was +0.81% with an SD of 3.62 points; 25 months lost 5% or more, one lost more than 10%, and the worst was −11.15% (year 22, March). Synthetic data made for this course.
First 5 of 40 rows
For support and product this gives a useful scale. "−3% this month" is ordinary noise. "−6%" is uncomfortable but common. "−12%" in a broad world fund would be outside our whole history, so check first whether the user holds something narrower, like a theme fund.
Shorter windows mean more swings to look at, but the same long-run growth.
- Do"A −5% month came about once every year and a half in our history."
- Don't"A −5% month means the market is breaking."
A support reply about a fall
A worried user needs three things in a short reply: a sense of scale, a check of their own situation, and honesty about what nobody knows.
Scale: put their number next to history. "About one month in twenty lost 5% or more" turns panic into context.
Their situation: a broad world fund and a narrow theme fund fall very differently. Look before you reassure; the answer for a theme fund is not the answer for the world.
Honesty: never promise a date or a recovery. Our worst year was −30.0%, and nobody knows whether the next one will be worse. Link the decision to the horizon the money was meant for, not to the news.
Keep the tone calm and plain, without jargon, and avoid "don't worry": it dismisses a real feeling and quietly promises something you can't guarantee.
- Do"Falls like this happen; let's look at what your portfolio holds and what the money is for."
- Don't"Don't worry, it will be back next month!"
A promise nobody can keep.
Ready to practise?
Answer the lesson's exercises and earn 250 points the first time you finish it.
Start the exercises