

Theory
Timing the market and the best months you miss
What staying invested earns vs missing the few best months, and why the best months sit next to the worst.
~6 min read · 7 exercises · 250 points
Before you start
A sell button with a brain
Late May at Zapas. The fund-picking idea is parked, but beta users keep asking support the same thing: "Should I sell now and buy back later?" Ethan wants to answer with a signal that warns users before a fall and calls them back when it's calm.
Before building it, you and Grace will price the risk of getting it wrong. You'll rerun 40 years of monthly returns with a few months taken out and see what staying out costs.
A few months carry decades
Over 40 years a broad stock index has 480 monthly returns. Most are small, a few are large, and the large ones carry a surprising share of the total. Compounding multiplies every month by the next, so removing one +10% month lowers everything that comes after it.
In the Tessaro data, $1,000 invested in every month became $34,550, about 9.3% a year in nominal terms. Missing the 5 best months left $21,739. Missing the 10 best left $14,528, and missing the 20 best only $7,163, about 5.0% a year.
This is the cost side of any plan that steps out of the market: each month outside is a month in which one of the rare big gains can happen without you. "Time in the market" is a short way of saying that you can't collect the best months unless you are invested when they arrive.
Chart data
| Scenario | Value at the end of year 40 |
|---|---|
| In all months | 34,550 |
| Missed 5 best | 21,739 |
| Missed 10 best | 14,528 |
| Missed 20 best | 7,163 |
| Missed 10 worst | 82,976 |
Show 1 more row
| Missed 10 best and 10 worst | 34,892 |
- Do“Stay invested through the plan, so the rare big months are included.”
- Don't“A month or two in cash won't matter over 40 years.”
It depends entirely on which months those are.
How to compare two final values
When you compare two outcomes, say which one is the base. "Missing the best months cuts the result by X%" uses the invested-all-the-time value as the base: (34,550 − 14,528) ÷ 34,550 = 58.0%.
Turned around, the same pair says staying invested gives 34,550 ÷ 14,528 ≈ 2.4 times as much. Both are true; mixing them up is how numbers in a pitch grow.
Yearly rates hide the size of the gap. 9.3% against 6.9% sounds like "a bit less", but over 40 years compounding turns those 2.4 points a year into less than half the money. When a user is deciding whether to step out, show the money as well as the rate.
And keep the time share in view: 10 months are 10 ÷ 480 = 2.1% of the period. A tiny slice of time carried more than half of the outcome.
Chart: What 1,000 dollars became after 40 years · shown above
- Do“Missing 10 of 480 months cut the final value by 58%.”
- Don't“It's only 9.3% vs 6.9%, a small difference.”
Over 40 years that gap is less than half the money.
Extremes come in clusters
Big monthly moves don't spread evenly over time. They bunch up in nervous periods, when prices swing hard in both directions. Calm years have few extreme months of either kind.
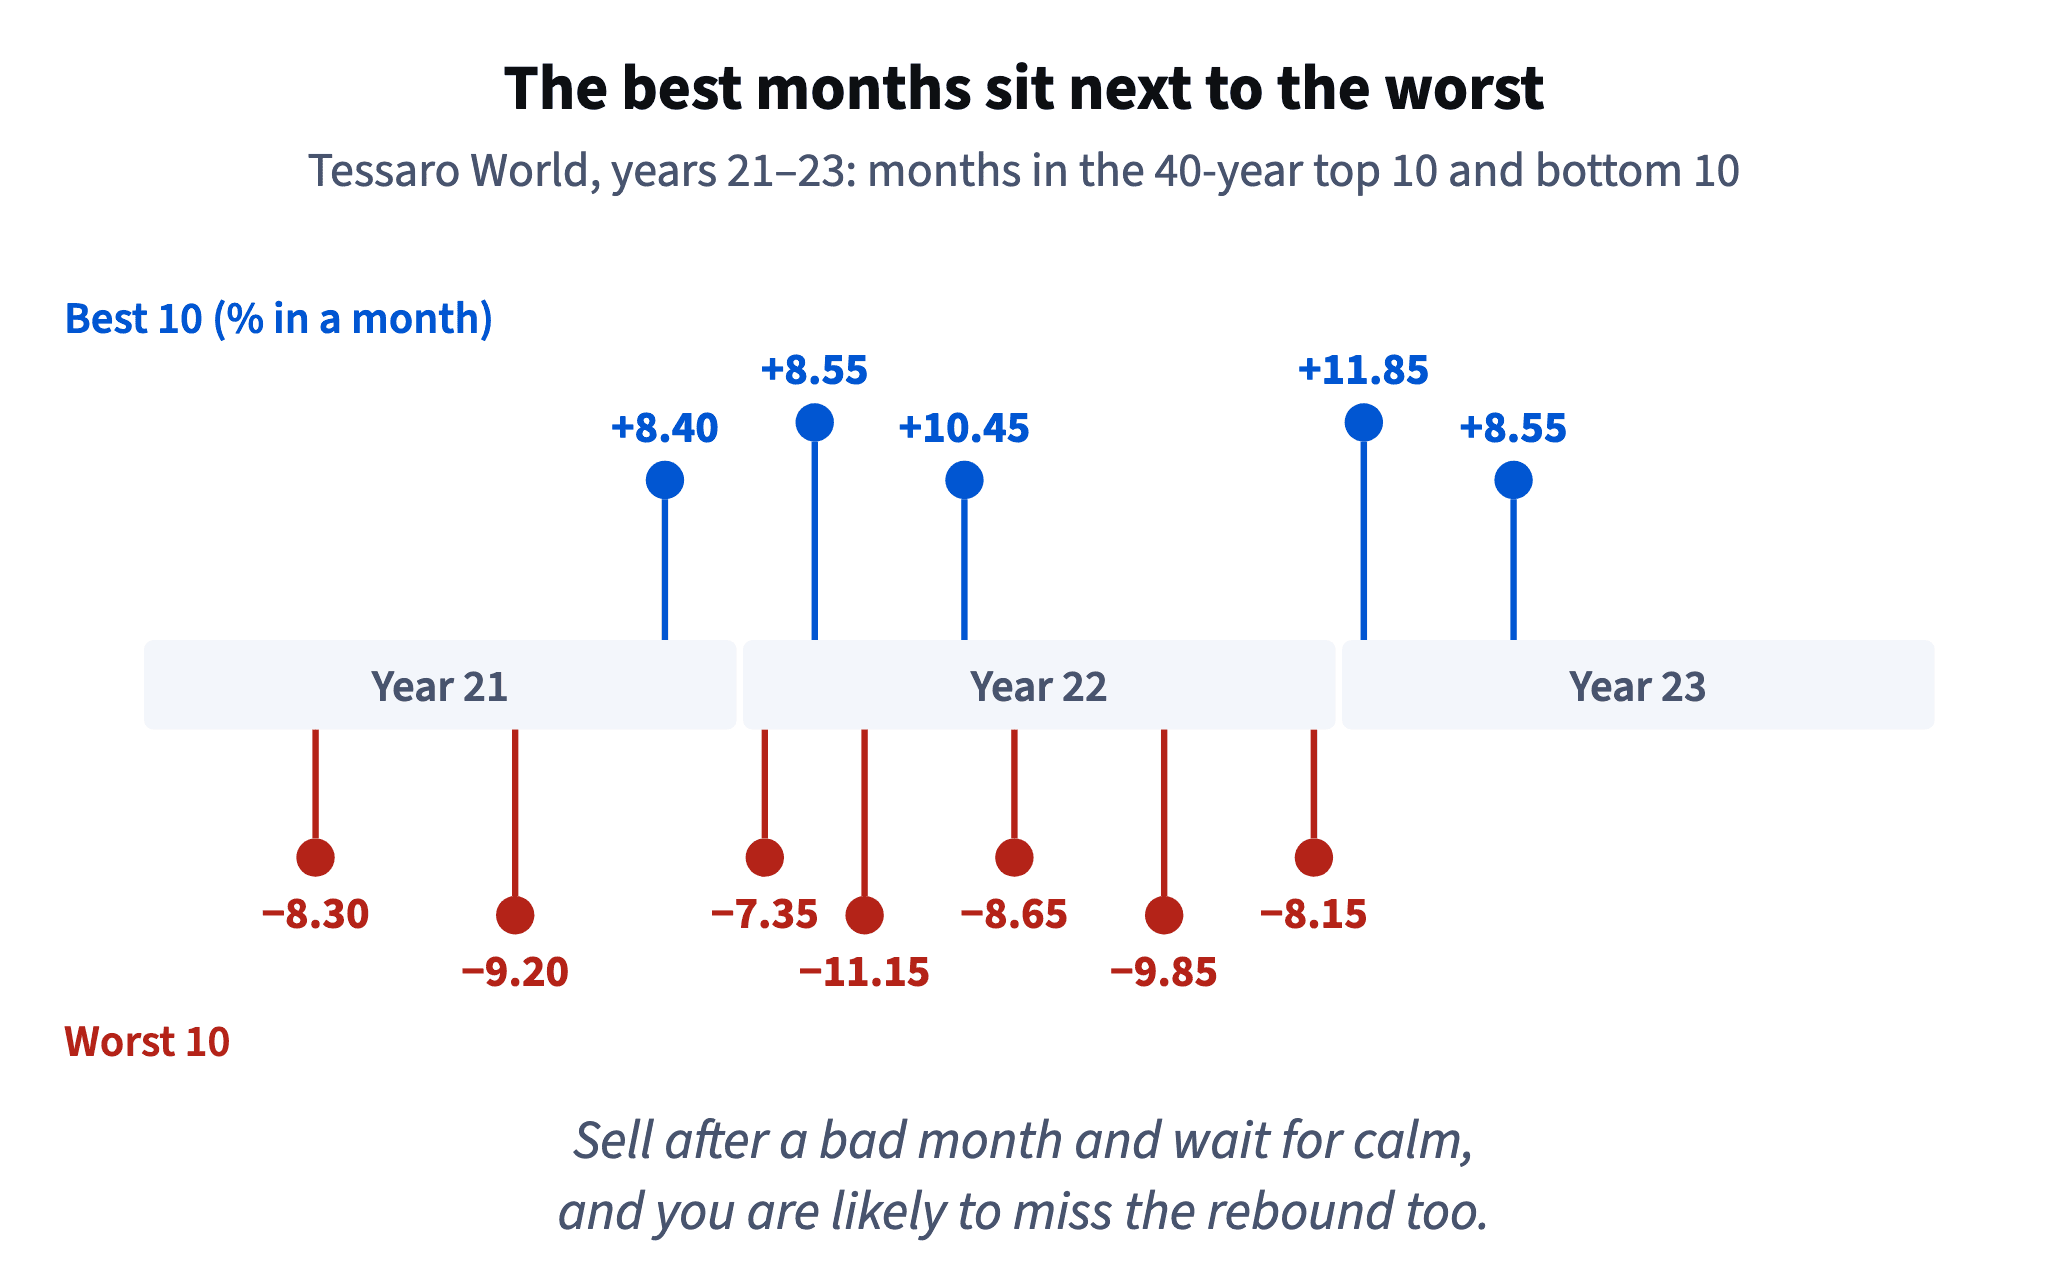
In the Tessaro data the crash and rebound years 21–23 hold 5 of the 10 best months of 40 years, mixed in with most of the 10 worst. The single best month, +11.85% in year 23, came straight after a −8.15% month, and 4 of the 10 best months came within three months of one of the 10 worst.
Dataset · 10 rows
The 10 best and 10 worst months of Tessaro World in 40 years (synthetic)
best_year and best_month locate the month; best_pct is its return in %. The same for the worst months.
First 5 of 10 rows
That is what makes timing so hard. The moment that feels most like "get out" is also the neighbourhood where the biggest gains appear. Someone who sells after a bad month and waits for calm is out of the market exactly when the rebound comes, and calm usually returns only after prices have already recovered.
- Do“After a −10% month, the next month is as likely to be a big gain as another loss.”
- Don't“Let's wait until things calm down, then buy back.”
Calm tends to return after the rebound, not before it.
Waiting for calm means waiting past the rebound
"I'll sell now and come back when things settle" sounds prudent. The problem is the order of events. Rebounds tend to start while news is still bad and prices still swing hard. Calm is a sign that the recovery has already happened, so the "come back when it's calm" rule buys back after the gains it was waiting for.
Replay it on the Tessaro table. A user who sold right after the worst month, year 22 month 3, and returned at the start of year 24 sat out three of the ten best months of 40 years: +10.45% in year 22, +11.85% and +8.55% in year 23. They also avoided a few bad months, so they missed both kinds, which is what real timers usually do.
Dataset: The 10 best and 10 worst months of Tessaro World in 40 years (synthetic) · shown above
For product design, the useful question is not "when should users come back?" but "how do we keep them from leaving in the first place?"
Picture: The best month, +11.85%, came right after the worst stretch. · shown above
- Do“Rebounds start while the news is still bad.”
- Don't“I'll buy back once the market feels safe again.”
By then the best months may be gone.
The timer has to be right twice
Market timing is two decisions, not one. You have to sell before the fall and buy back before the rebound. Getting only the first right is not enough: if you sell well but return late, the missed recovery eats the saved loss.
The Tessaro scenarios show the trade-off. Dodging only the 10 worst months would turn $1,000 into $82,976, but that needs perfect foresight. Missing only the 10 best leaves $14,528. Because the best and worst months sit side by side, a real timer tends to miss some of each, and missing all 20 ends at $34,892, practically the same as the $34,550 of doing nothing.
And that is before costs. Every exit and re-entry pays spreads, and in many countries selling at a gain triggers tax. A strategy that only ties with staying invested before costs loses after them.
Chart: What 1,000 dollars became after 40 years · shown above
- Do“To win at timing you must sell before the fall and buy before the rebound.”
- Don't“We'll get users out before crashes, so they'll earn more.”
Half a correct call, and the missed rebound costs more than the dodged fall.
What an app says in a fall
An investing app speaks to users exactly when their nerves are worst. Whatever it says then becomes a trading signal, even if it was meant as information. "Consider moving to cash" is a timing call; "stay calm, markets always recover" is a promise. Neither belongs in the message.
A better message does three things: it names the fall honestly, it puts it in context with data the app can stand behind (falls like this happened before, and the biggest gains often came soon after the biggest losses), and it points back to the plan the user chose in calm times. It doesn't predict the next month.
This also connects to the drawdown message designed in March: the trigger and the wording were chosen before any fall. The best time to decide how to behave in a crash is when there isn't one.
- Do“Your world fund is down 9% this month. Falls like this are in the plan you chose.”
Honest, no forecast, back to the plan.
- Don't“Don't worry, it will bounce back next month.”
A forecast nobody can make.
Ready to practise?
Answer the lesson's exercises and earn 250 points the first time you finish it.
Start the exercises