

Theory
Stocks vs bonds: risk capacity, tolerance and the job you have
How different stock and bond mixes behaved, and how horizon, income and nerves decide the mix.
~6 min read · 6 exercises · 250 points
Before you start
How much in stocks?
Still July at Zapas. Bonds are no longer the "safe" part, so today you and Grace decide how much of each model portfolio goes into stocks and how much into bonds.
Grace has run six mixes, from all bonds to all stocks, through the forty synthetic Tessaro years. You'll compare what each mix earned and how badly it fell, and separate how much risk a user can afford from how much they can stand.
More stocks: a higher end and a rougher path
Over long periods stocks have earned more than bonds, so a mix with more stocks usually ends higher. In the synthetic Tessaro history the geometric real return rises step by step from 1.7% a year for 0/100 to 5.9% for 100/0, and $1,000 grows to $1,932 or to $9,875.
The other columns climb too, in the wrong direction. The worst real year goes from −12.7% to −31.8%, the largest fall from −22.8% to −48.2%, and 100/0 spent 11 years below its old peak.
Dataset · 6 rows
Model mixes over 40 synthetic years, real terms
Stocks = Tessaro World; bonds = half Tessaro Short Bonds, half Tessaro Long Bonds; rebalanced every year-end. avg/geo = arithmetic/geometric real return a year; worst_real_year_pct and worst_year; max_drawdown_real_pct from peak year to trough year; years_underwater = from the peak until back above it (not_by_40 = still below at the end of year 40); real_value_of_1000 after 40 years. Synthetic data.
First 5 of 6 rows
Compounding makes the gap at the end look huge, but it only arrives for someone who stays invested through every fall. A user who sells halfway down gets neither the end value nor the recovery. That is why a mix is chosen by the falls a person can live through, and the end value is the reward for doing so.
Chart data
| Stocks/bonds, % | Return a year | Worst year | Largest fall |
|---|---|---|---|
| 0/100, all bonds | 1.7 | -12.7 | -22.8 |
| 20/80 | 2.7 | -15.1 | -25.2 |
| 40/60 | 3.6 | -17.6 | -27.6 |
| 60/40 | 4.4 | -20 | -30 |
| 80/20 | 5.2 | -24.3 | -38 |
Show 1 more row
| 100/0, all stocks | 5.9 | -31.8 | -48.2 |
- Do“100/0 ended with $9,875, but fell 48.2% on the way and took 11 years to get back.”
- Don't“Pick the mix with the highest final value.”
The end value is earned only by holding through the falls.
Describe a mix by three risk numbers
One volatility number hides what users feel. Describe every mix by three things:
- worst year: the deepest single calendar-year loss, after inflation;
- largest fall (maximum drawdown): how far it dropped from a peak to the bottom, possibly over several years;
- time under water: how many years until it was back above the old peak.
In the Tessaro data the largest fall grows from −22.8% (0/100) to −27.6% (40/60), −30.0% (60/40), −38.0% (80/20) and −48.2% (100/0). Up to 60% stocks the falls stay close together; above that, the stock crash of years 21–22 dominates and the falls jump.
Show all three next to the return. "4.4% a year, worst year −20.0%, largest fall −30.0%, 6 years under water" lets a user picture the bad stretch before choosing.
Chart: Real return vs worst year and largest fall, by mix · shown above
- Do“60/40: 4.4% a year real; worst year −20.0%; largest fall −30.0%; 6 years under water.”
- Don't“60/40: medium risk.”
A label without numbers tells the user nothing about the bad years.
Low swings are not the same as low risk
An all-bond portfolio swings less, but it has its own risks. The first is inflation: in the Tessaro inflation years 35–37 bonds lost value in real terms, and the 0/100 and 20/80 mixes were still below their year-34 real peak at the end of year 40. The 60/40 mix, which fell at the same time, was back above its peak 3 years after the bottom.
Dataset: Model mixes over 40 synthetic years, real terms · shown above
The second is too little growth. At 1.7% a year real, $1,000 became $1,932 in forty years; a 60/40 made $5,700. For a long goal, a portfolio that barely beats inflation can fail the goal even without any crash.
So "careful" means choosing which risk to carry. Short horizons carry the risk of a fall, so less in stocks. Long horizons carry the risk of not growing enough, so some stocks are part of being careful too.
- Do“Bonds swing less, but in the inflation years they lost value and hadn't recovered by year 40.”
- Don't“All bonds means no risk.”
Risk capacity vs risk tolerance
Two separate questions set how much of a portfolio can go into stocks.
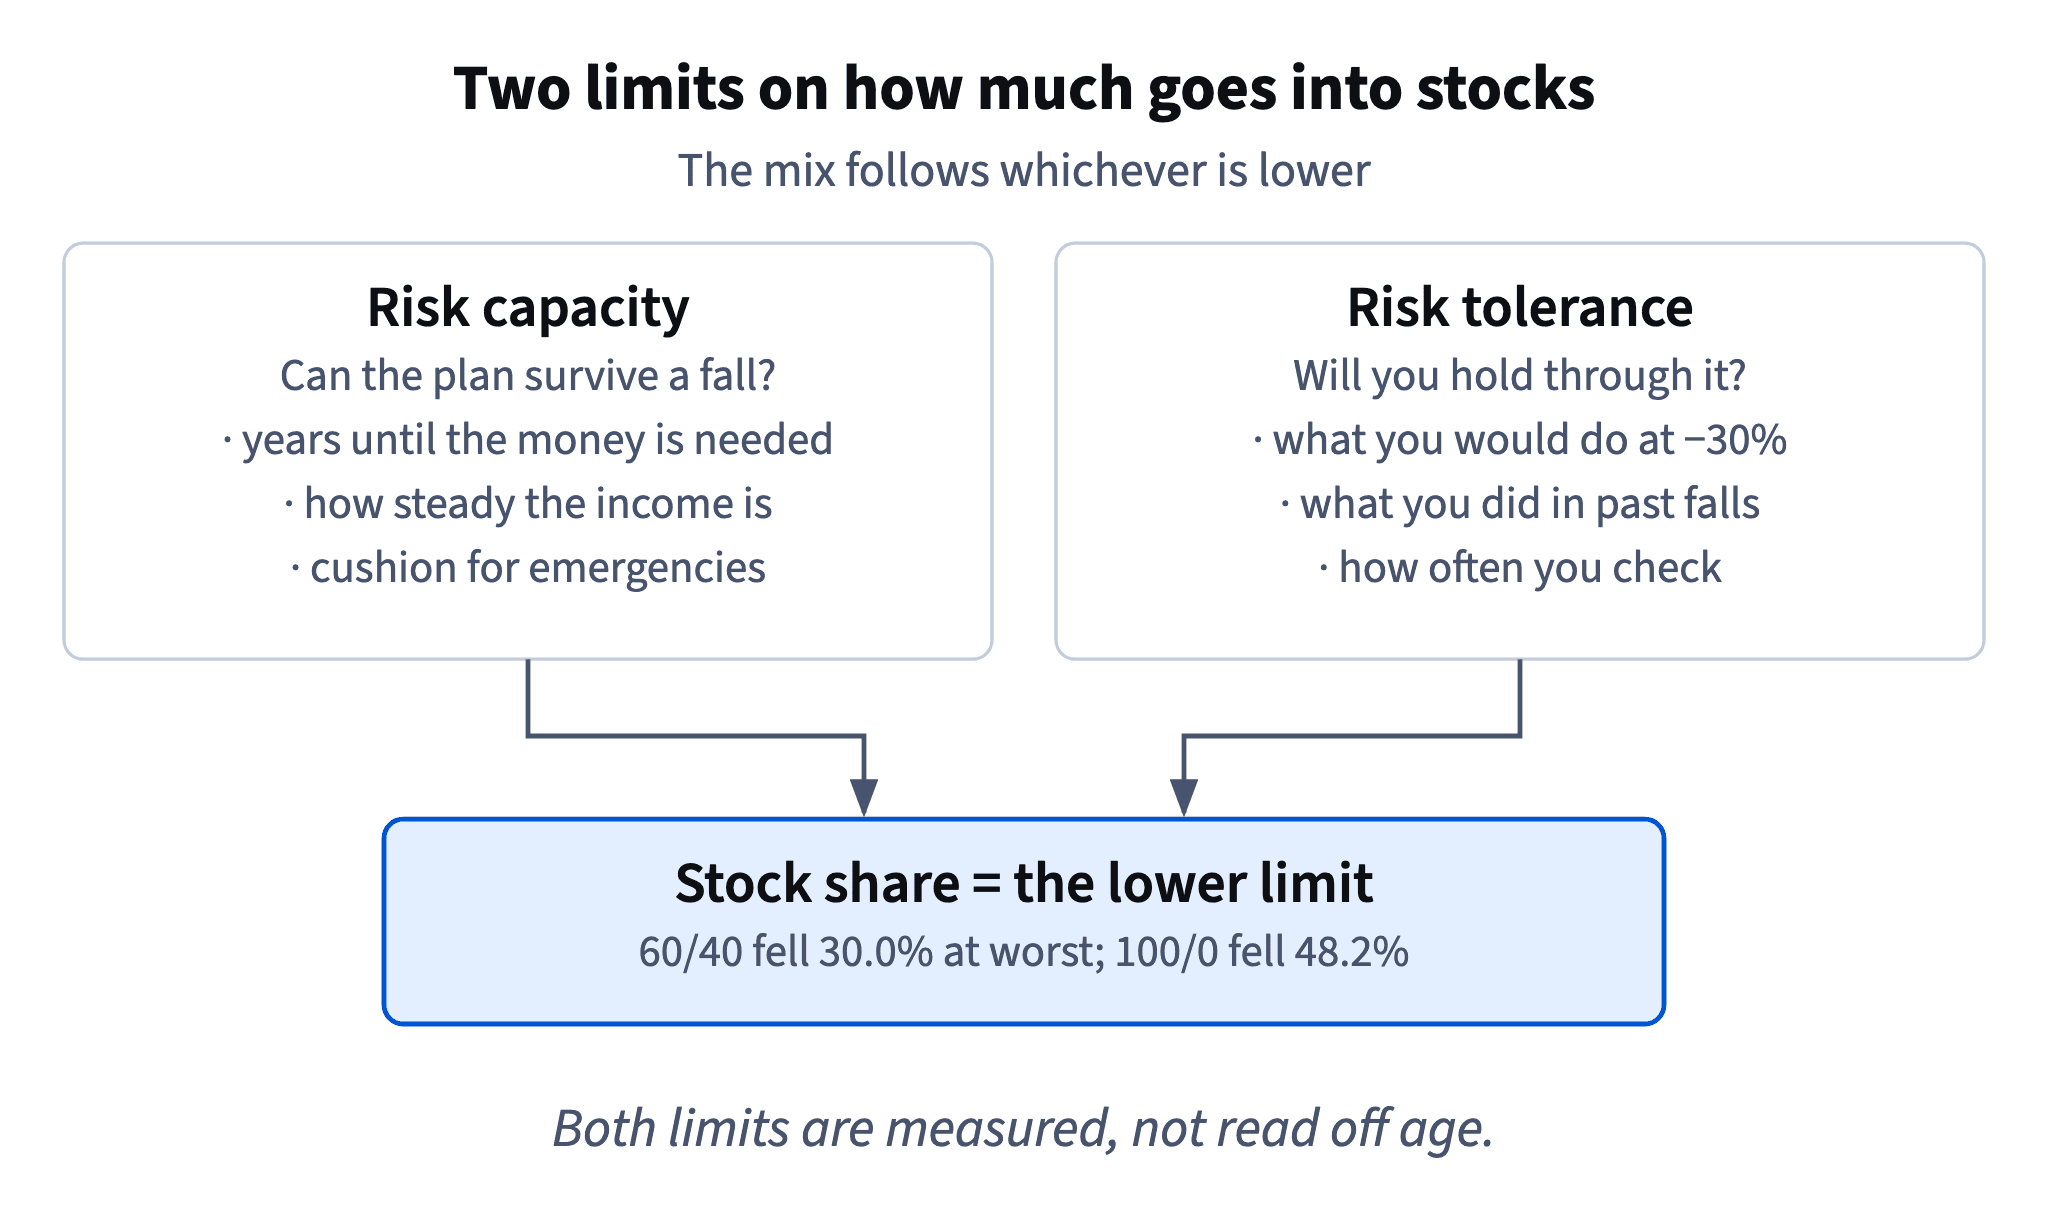
Risk capacity is about the plan: could it survive a deep fall without selling? It grows with a long horizon, a steady income that keeps paying the bills and a cushion for emergencies. A founder whose income can stop for months has less capacity than a salaried PM with the same horizon, because a bad year at work could force a sale at the bottom.
Risk tolerance is about the person: would they actually hold through a −30% screen, or sell? Zapas doesn't guess it; it asks. Onboarding turns a −30% fall into the user's own dollars and asks what they would do, and for users who were already invested during a past drop the app can also see what they actually did.
Use the lower of the two. High tolerance doesn't fix low capacity, and plenty of capacity doesn't help a user who answers "I'd sell". Rules of thumb such as "a bond share that grows with age" are only a starting point: they ignore income, cushion and nerves, so treat them as one trade-off among several.
- Do“Long horizon, but irregular income and no cushion: start with fewer stocks.”
- Don't“You're under 30, so 100% stocks.”
Age is one input; income, cushion and nerves are others.
Questions that measure each limit
Good onboarding asks about both limits, with plain questions that have concrete answers.
Capacity questions are facts about the user's situation: when the money is needed, how steady the income is, whether there is a cushion for several months of costs, whether there are debts or people who depend on this money. They can be checked and rarely change overnight.
Tolerance questions are about reactions: what the user would do if the balance showed −30%, what they did in a past fall, how often they plan to check. People tend to overrate their calm when markets are rising, so concrete numbers ("−30%, about $3,000 on $10,000") work better than words like "aggressive".
Score both and place the user by the lower one. If they differ a lot, say so on the screen: "Your plan could carry more stocks than you said you're comfortable with."
- Do“If your $10,000 showed $7,000, what would you do?”
- Don't“Are you an aggressive investor?”
A flattering label, not a measurement.
Ready to practise?
Answer the lesson's exercises and earn 250 points the first time you finish it.
Start the exercises