

Theory
Reading a factsheet: index fund, ETF, accumulating, tracking difference, domicile
What the lines on a fund factsheet mean and which of them change what you actually pay and get.
~7 min read · 8 exercises · 250 points
Before you start
Six factsheets on the table
Mid-June at Zapas. The fund line-up for the November launch has to be fixed this month, and Grace has printed six factsheets: two Zapas funds, a third-party index fund, an active fund, a theme fund and a bank fund.
Ethan only looks at the fee and the five-year return. Before anyone picks, everyone on the team should be able to read the whole sheet. You'll go through its lines and find the ones that cost more than the fee.
Index fund, ETF, active fund
Fund labels mix two different ideas, and it helps to pull them apart.
What the fund holds. An index fund owns the companies in an index by fixed rules, in proportion to their size, so its return follows the index minus costs. An active fund has a manager who picks what to own; its result depends on those picks and on its higher costs. A theme fund follows a narrow index, like one sector: rules-based, but concentrated.
How you buy it. An exchange-traded fund (ETF) trades on an exchange all day like a share, so you pay a bid-ask spread. Other funds are bought and sold once a day at the fund's own price, with no exchange spread but sometimes an entry fee.
So "index ETF" means a rules-based fund bought on an exchange, and "ETF" alone tells you nothing about how diversified or cheap the fund is.
- Do“S5 Robo Theme is an ETF, but it holds 60 companies in one sector.”
- Don't“It's an ETF, so it's a cheap, diversified index fund.”
Tracking difference: the receipt, not the price tag
The ongoing charge is the yearly fee a fund says it takes. The tracking difference is the fund's actual return minus its index's return over a year. It is what the investor really lost (or, rarely, gained) against the index, after everything that happens inside the fund:
- the ongoing charge itself;
- trading costs when the index changes;
- a little cash that isn't invested;
- tax withheld on dividends before they reach the fund;
- small extra income, for example from lending shares.
On the synthetic factsheets every index fund trails by a bit more than its fee: S1 0.25% vs 0.20%, S2 0.06% vs 0.05%, S3 0.18% vs 0.15%, S5 0.75% vs 0.65%. For index funds, compare tracking differences over several years, not fees. An active fund has no index to track, so there you add its ongoing charge and its in-fund trading costs instead.
Chart data
| Fund | Ongoing charge | Tracking difference |
|---|---|---|
| S1 Zapas World Stock | 0.2 | 0.25 |
| S2 Halden World Index | 0.05 | 0.06 |
| S3 Zapas Short Bond | 0.15 | 0.18 |
| S5 Robo Theme | 0.65 | 0.75 |
- Do“S1 trailed Tessaro World by 0.25% last year: that's its real fund-level cost.”
- Don't“Fee 0.20%, so the fund costs 0.20%.”
Accumulating or distributing, physical or synthetic
Companies pay dividends, and a fund has to decide what to do with them.
An accumulating fund reinvests them inside the fund: the price per unit grows, and nothing is paid to you. A distributing fund pays them out in cash. For a long-term saver that adds work and cost: tax may be withheld before the money arrives, a payout in dollars may be converted, and the money sits idle until it is reinvested. In the factsheets S1, S3, S5 and S6 accumulate; S2 and S4 distribute.
Dataset · 6 rows
Six fictional fund factsheets
Synthetic. Percent columns are % a year except `typical_spread_pct` (per trade, half on buying and half on selling), `entry_fee_pct` and `fx_fee_pct` (per conversion). `tracking_difference_pct` = fund return minus index return over a year; empty for funds that track no index.
First 5 of 6 rows
One more line: replication. A physical fund owns the securities in its index. A synthetic one, like S5, gets the index return through a contract with a bank, which adds a small risk that the bank fails to pay.
Neither line is good or bad by itself, but both change what reaches the user, so they belong in the all-in sum.
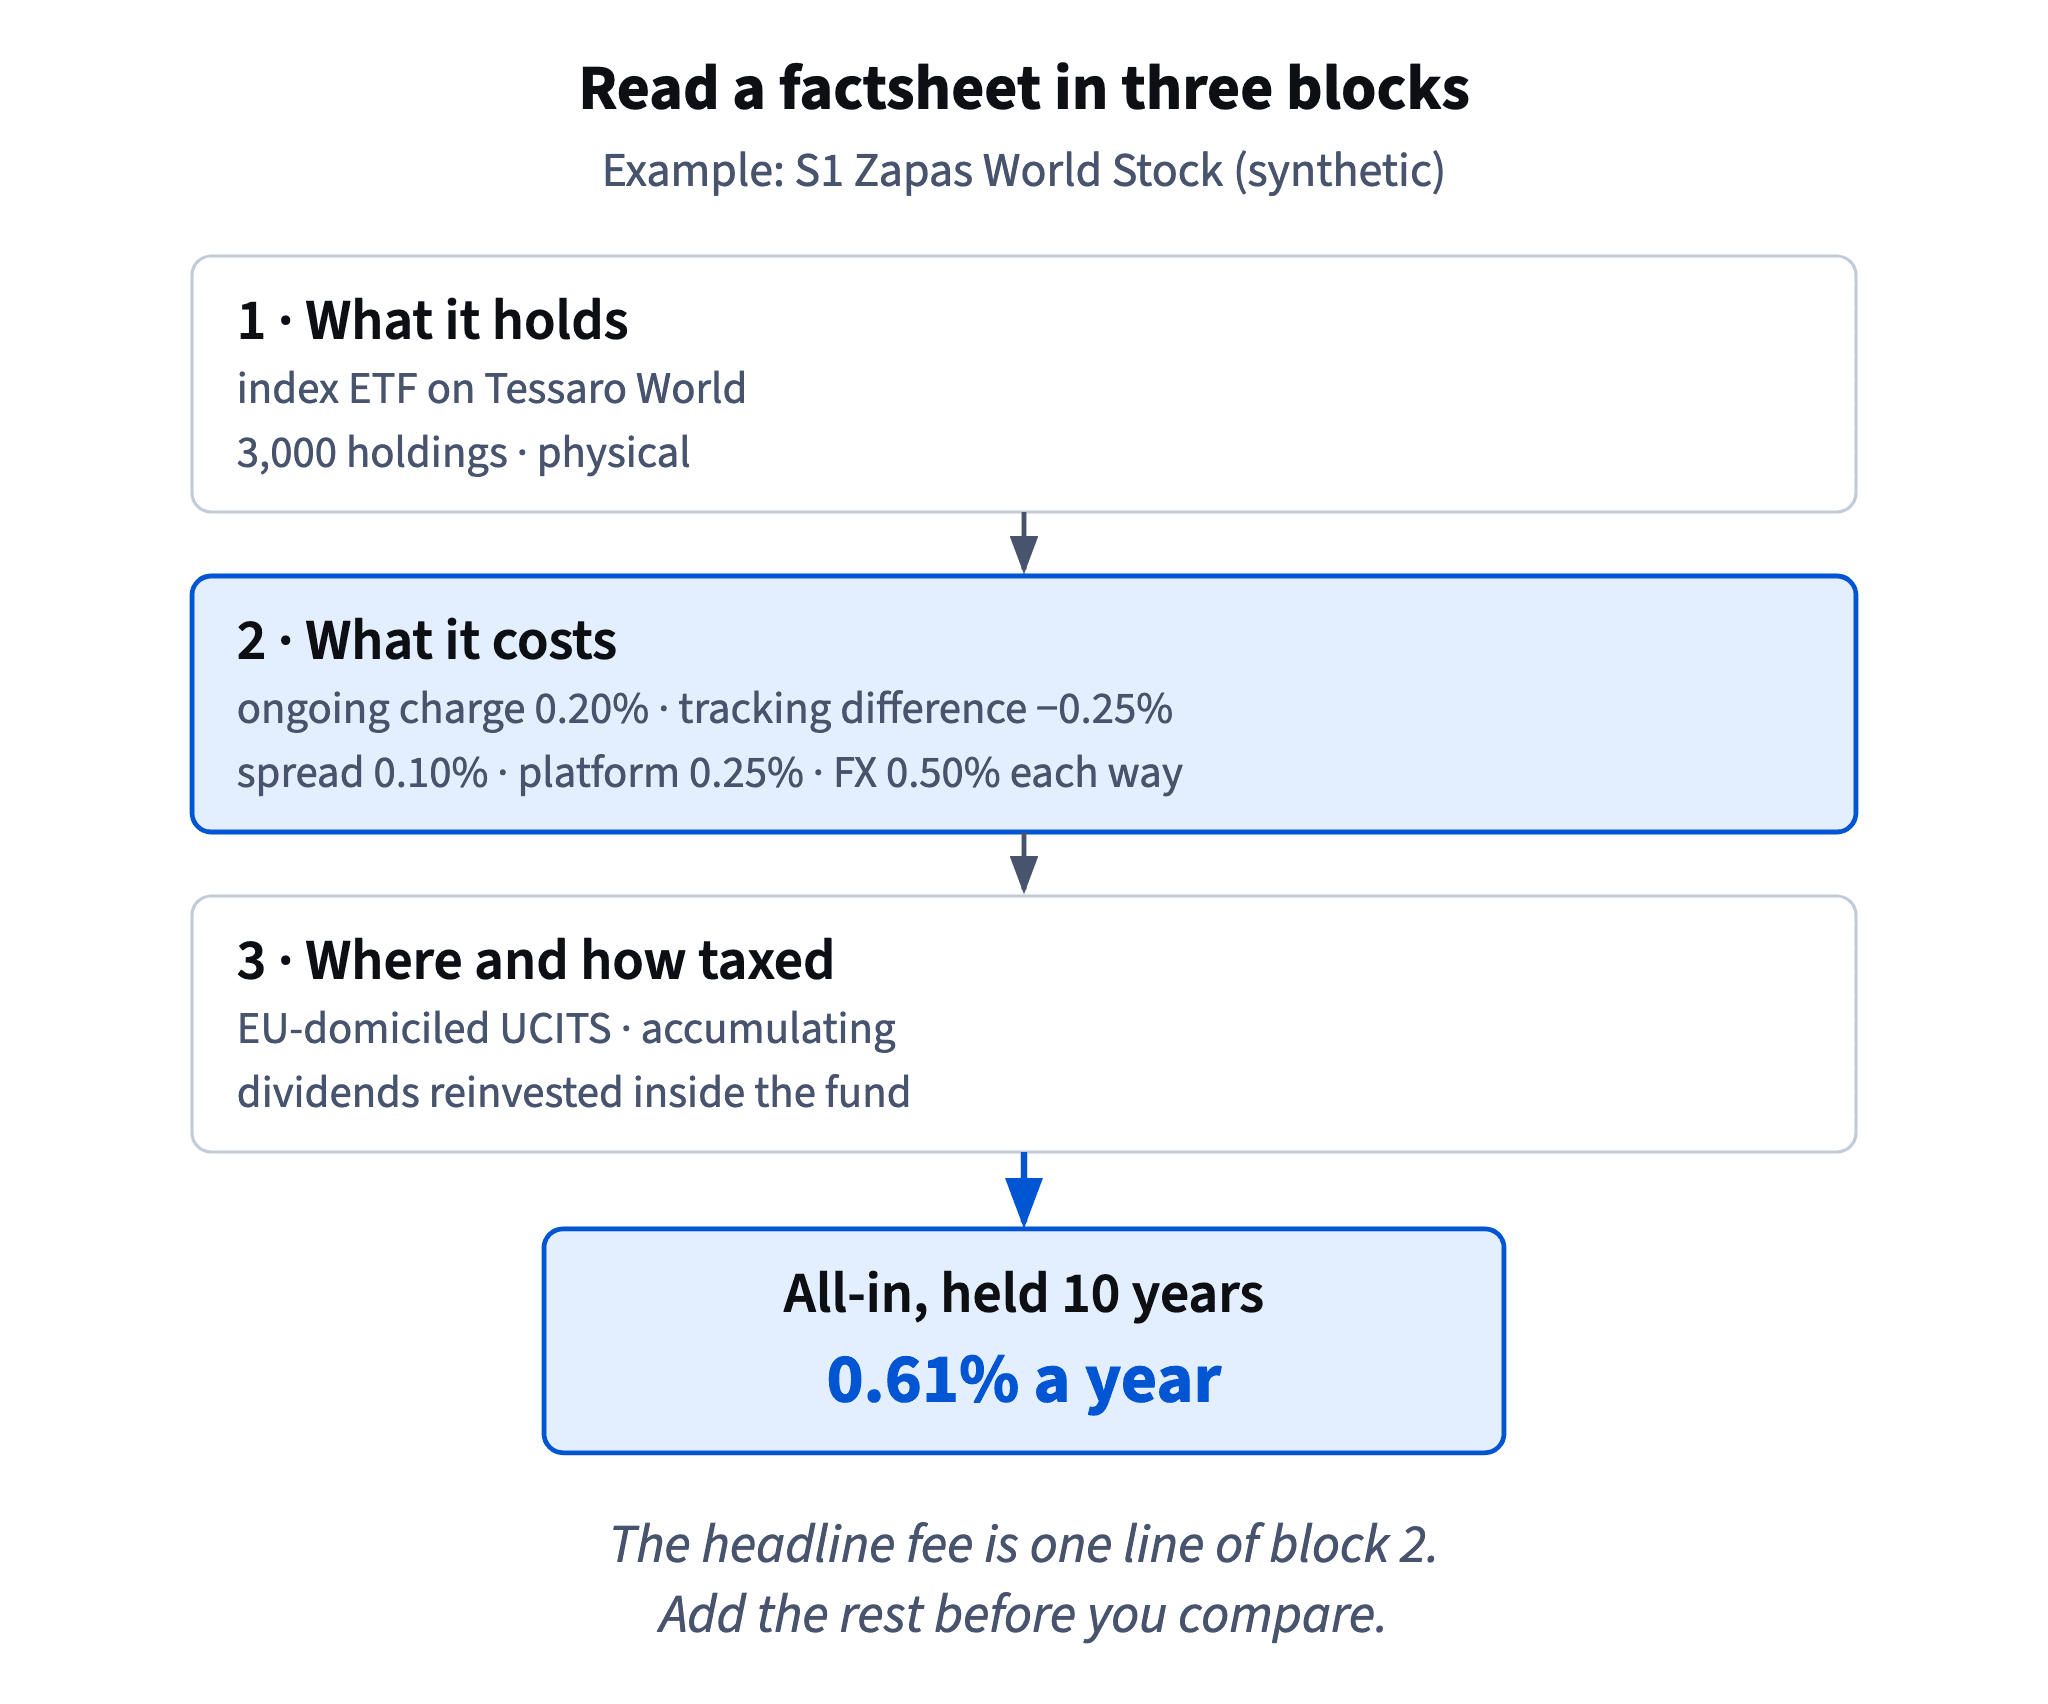
Picture: Holdings, costs, domicile: the headline fee is one line of the middle block. · shown above
- Do“S2 pays dividends out, so add the tax withheld on them to its all-in cost.”
- Don't“Distributing funds pay you extra income on top of the return.”
The payout is part of the return, not extra.
Domicile and the tax on dividends
A fund's domicile is the country where it is legally registered. The factsheets name two kinds: an EU-domiciled UCITS fund (registered in the EU under a common set of rules for funds sold to the public) and a US-domiciled fund.
Dataset: Six fictional fund factsheets · shown above
For now one effect matters: domicile, together with tax treaties, decides how much withholding tax is taken from dividends before they reach the investor. For an accumulating fund that tax is already inside its tracking difference. For a distributing fund it is an extra layer you add yourself: dividend yield × withholding rate. S2 yields 1.8% and 30% is withheld, so 0.54% a year disappears to tax. S4 yields 1.0% with 15% withheld: 0.15%.
The full picture (which funds a user in Ukraine can buy, protection schemes, declaring income) comes in the autumn module. Until then, treat the domicile and distribution lines as cost lines.
- Do“1.8% yield × 30% withheld = 0.54% a year of tax drag.”
- Don't“Domicile is legal small print; it doesn't affect returns.”
One number from a whole factsheet
To compare funds fairly you need one yearly number per fund for the same holding period. We use ten years:
- fund level: the size of the tracking difference for an index fund, or ongoing charge plus in-fund trading costs for a fund with no index;
- plus the platform fee a year;
- plus tax drag for a distributing fund: dividend yield × withholding;
- plus one-off costs spread over the holding: (spread + two FX conversions + entry fee) ÷ 10.
For S1 that gives 0.25 + 0.25 + 0 + 1.10 ÷ 10 = 0.61% a year, three times its 0.20% fee. The holding period matters: a user who stays two years spreads the same one-off costs over two years, not ten, so short holders pay much more per year.
The method is simple on purpose. It is not a forecast, just a fair way to line funds up before choosing.
Picture: Holdings, costs, domicile: the headline fee is one line of the middle block. · shown above
- Do“S1: 0.61% a year all-in over 10 years, about $61 on $10,000.”
- Don'tAdding the spread and both conversions every year for a 10-year holder.
They are paid once; spread them over the holding.
Compare like with like
The ongoing charge is useful as a first filter: a fund charging 1.6% has a lot to make up. But between index funds on the same index the useful number is the tracking difference, because it already includes the fee plus everything else that happens inside the fund. Look at several years: one year can be lucky or unlucky.
Then remember that the fund is only part of the bill. Outside it sit the spread, the conversions, the platform fee and, for distributing funds, tax drag. Two funds with almost the same tracking difference can end up far apart once those are added, especially if one of them needs a separate broker account with its own fees.
A good factsheet reading ends with one all-in number per fund over the same holding period. Only then does a comparison mean something.
Chart: Index funds: ongoing charge vs what they lost to the index · shown above
- Do“Same index: S1 trails by 0.25%, S2 by 0.06%. Now add what each costs outside the fund.”
- Don't“Lowest fee wins.”
Cost lines hide all over the factsheet
A factsheet is not organised around what you pay. The cost lines are scattered:
- fund level: ongoing charge, in-fund trading costs, tracking difference;
- trading: the typical spread for an ETF, or an entry fee for some funds bought directly (S6 charges 3%);
- account: the platform fee and FX conversion, which depend on where you buy rather than on the fund;
- tax: distribution policy, dividend yield and withholding, which together give the tax drag.
Dataset: Six fictional fund factsheets · shown above
Other lines describe the fund without changing the cost: holdings, the index, replication, currency. They still matter, for risk and diversification. And some lines matter for nothing at all: the name, the logo and a five-year return on its own.
Reading a factsheet well means pulling the cost lines into one place, adding them up for one holding period and keeping the descriptive lines for the risk side of the decision.
Picture: Holdings, costs, domicile: the headline fee is one line of the middle block. · shown above
- Do“S6: 2.2% charge + 0.2% trading + 3% entry spread over 10 years = 2.70% a year.”
- Don't“Star Growth returned 9.9% a year, so its fee doesn't matter.”
Ready to practise?
Answer the lesson's exercises and earn 250 points the first time you finish it.
Start the exercises