

Theory
A range, not a number: twenty-five years of possible paths
Where long-run returns come from, and how to read twenty-five years of simulated paths as a range with a median, a 10th and a 90th percentile.
~7 min read · 7 exercises · 250 points
Before you start
One line or many paths?
Last week of February at Zapas. Yesterday's goal screen drew a smooth 6% line, but real markets never move in a straight line. Ethan worries that a range looks weak: users want one number.
Today you and Grace replace that line with something honest. You'll see where returns come from, why they swing from year to year, and how to show users a spread of possible outcomes over twenty-five years instead of a single promise.
Owning vs lending
Long-run returns are not magic; each comes from somewhere, and knowing the source tells you how steady it can be.
A company share gives you a slice of a business's profits. Some profits are paid out as dividends, the rest is reinvested to grow the business. Over decades profits rise with the economy, and that is the engine of stock returns. But the price the market pays for those profits changes with mood and interest rates, so a year can bring +30% or −30%.
A bond is a loan to a government or company. The interest is agreed in advance, so returns are steadier and lower, unless the borrower fails or rates jump.
Cash earns a short-term rate and is the steadiest of all, but it barely keeps up with prices.
Higher expected return comes with bigger swings. Anything that promises the first without the second deserves suspicion.
- Do"Stocks pay from profits, so they swing; bonds pay agreed interest, so they swing less."
- Don't"High returns with no risk."
A promise no honest investment can make.
Reading percentiles
Line up all 2,000 simulated results from smallest to largest. The percentile tells you where a value sits in that line.
- The 10th percentile is the value with 10% of results below it: a bad but not the worst case.
- The median (50th percentile) splits the results in half: as many ended above as below.
- The 90th percentile has 90% below it: a good but not the best case.
The 25th–75th percentiles hold the middle half of all outcomes.
Percentiles are better than an average here because the outcomes are lopsided: a few lucky paths end very high and pull the average up, while the median stays with the typical user.
Remember what percentiles are not: the 10th percentile is not the floor. One plan in ten ends below it.
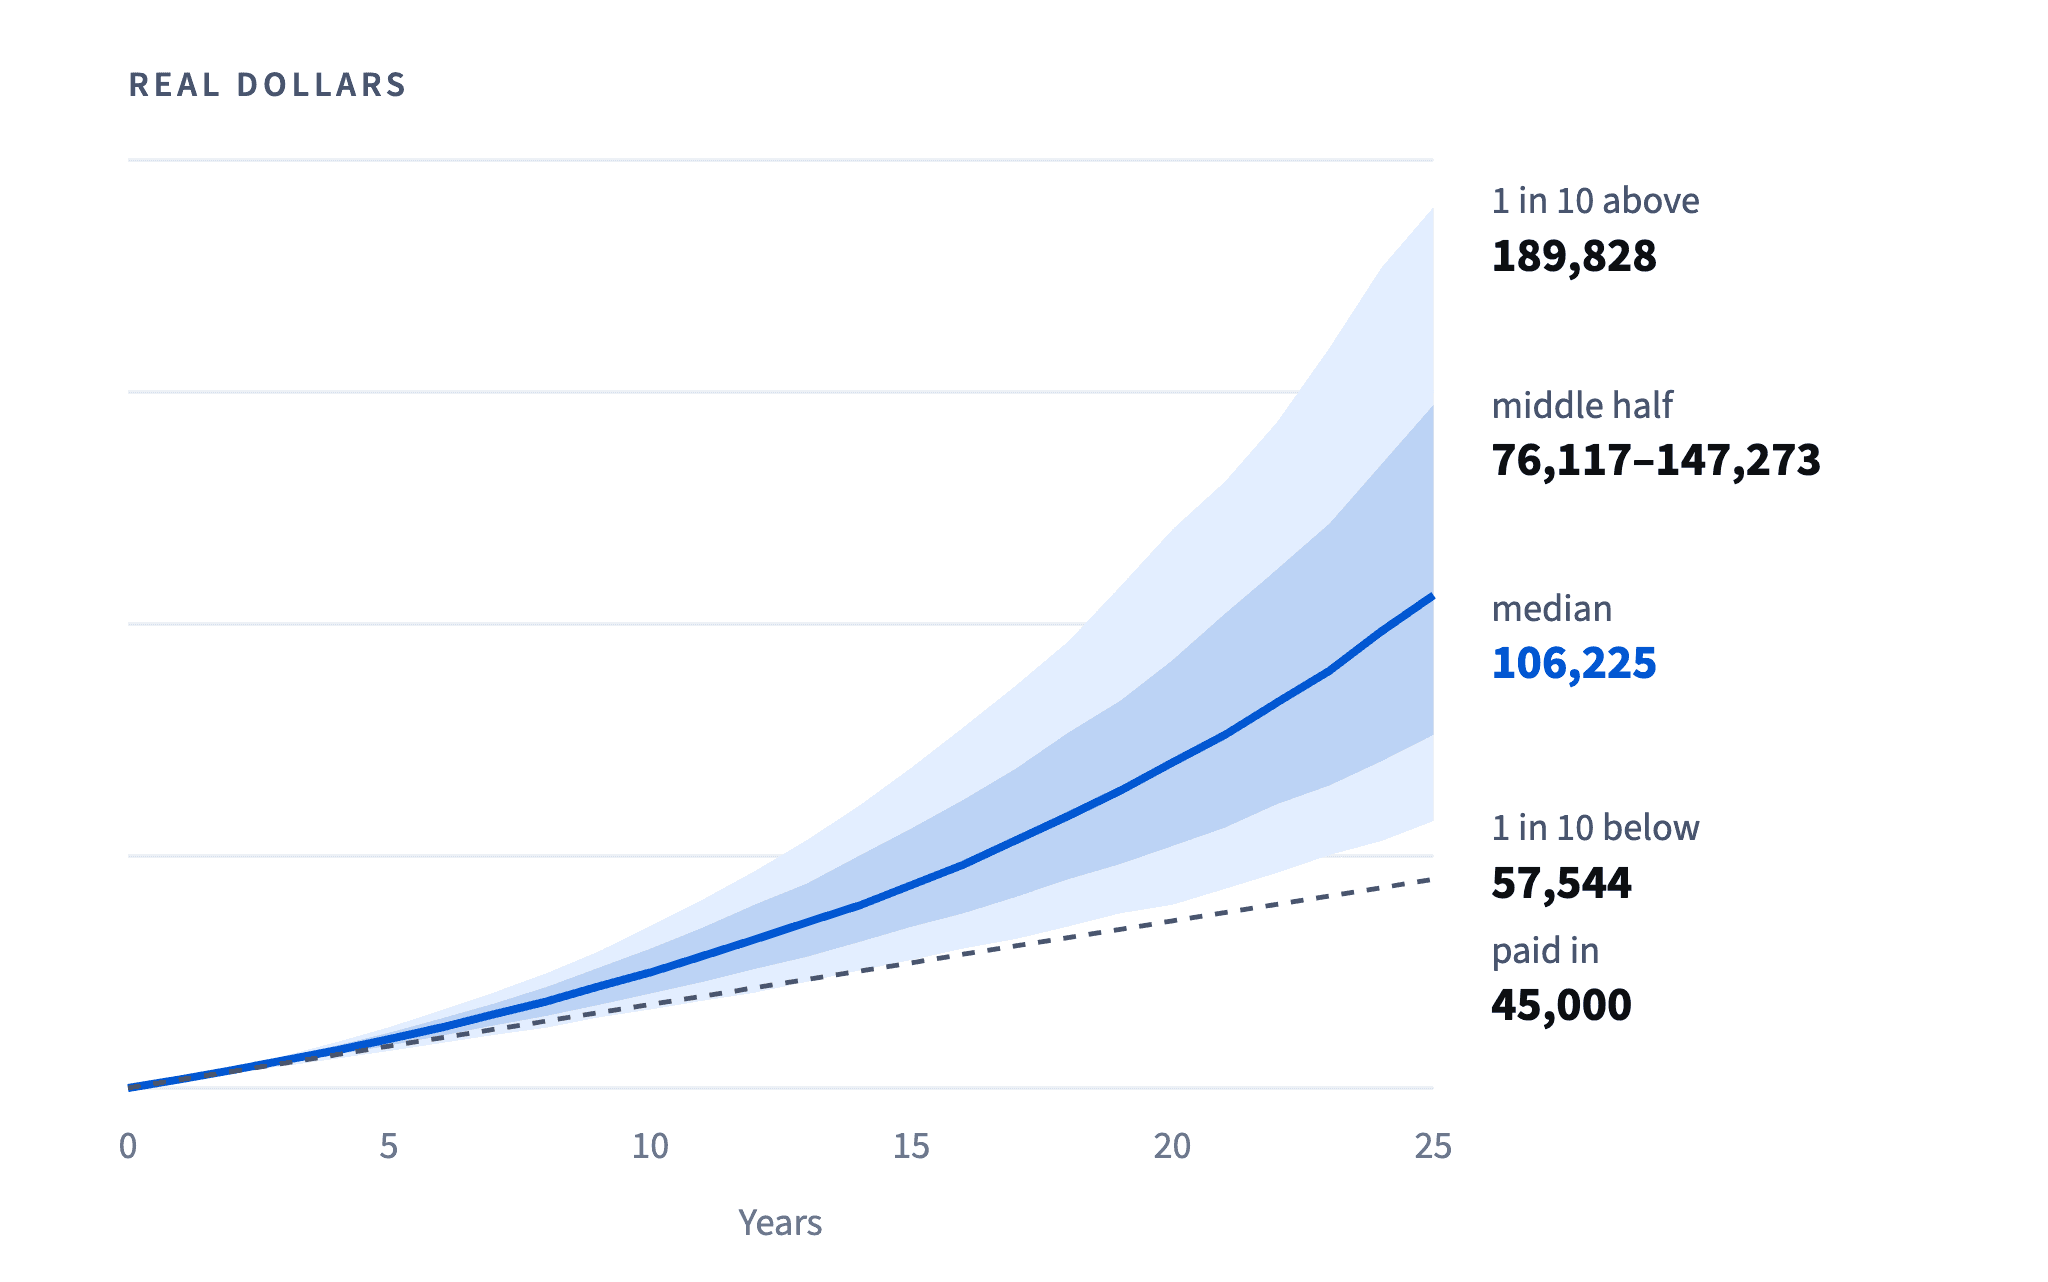
- Do"In 8 of 10 simulated paths the balance ended between about 58,000 and 190,000."
- Don't"At worst you'll have 57,544."
The 10th percentile isn't the worst case.
Why the same history gives different results
Our simulation builds each path by drawing 25 years at random from the 40 Tessaro World years, with replacement. So a path is a lottery ticket over the history: it can pick a good year three times and skip a bad one entirely.
The history holds three years that lost more than 20% after inflation, and twelve losing years in all. Counting what each path drew shows where the spread comes from. The bottom tenth of paths drew the deep-fall years about 3.6 times on average and about 10 losing years in total. The top tenth drew the deep falls fewer than once and about 5 losing years.
When a bad year lands also shifts the result a little, but the count of bad years is the main driver here. The width of the fan is not an error in the model: it is the real uncertainty a user takes on.
Chart data
| Year | 90th percentile | 75th percentile | Median | 25th percentile | 10th percentile | Paid in |
|---|---|---|---|---|---|---|
| 1 | 1,994 | 1,925 | 1,881 | 1,782 | 1,705 | 1,800 |
| 5 | 13,085 | 11,944 | 10,550 | 9,188 | 8,017 | 9,000 |
| 10 | 34,906 | 30,024 | 24,907 | 20,360 | 16,877 | 18,000 |
| 15 | 69,059 | 55,963 | 43,694 | 34,790 | 27,560 | 27,000 |
| 20 | 120,315 | 92,234 | 70,153 | 52,167 | 39,490 | 36,000 |
Show 1 more row
| 25 | 189,828 | 147,273 | 106,225 | 76,117 | 57,544 | 45,000 |
- Do"Your result depends on how many bad years your 25 years happen to contain, which nobody can know."
- Don't"Same plan, same result."
Time shrinks, but doesn't remove, the chance of a loss
A loss over one year is common in stocks. Over many years good and bad years start to offset each other, so the chance of ending below what you paid in falls.
In our 2,000 simulated plans of 150 dol. a month, the share of paths below the money paid in was 30.7% after 1 year, 21.6% after 5, 14.1% after 10, 6.2% after 20 and 3.8% after 25.
Two lessons for a product. First, money for a goal within a few years has a real chance of being below what was put in, so it doesn't belong in stocks. Second, even 25 years isn't a guarantee: 3.8% is small, not zero.
These numbers come from reshuffling our synthetic history. A real future can contain a worse stretch than any in the data, so treat them as a sense of scale, not as odds to quote.
Chart data
| Years invested | Below paid in |
|---|---|
| 1 | 30.7 |
| 5 | 21.6 |
| 10 | 14.1 |
| 20 | 6.2 |
| 25 | 3.8 |
- Do"Over 5 years, about 1 plan in 5 ended below what was paid in; over 25 years, about 1 in 26."
- Don't"Stay 10 years and you can't lose."
14.1% of 10-year paths were below the money paid in.
How to state an expected return
An expected return is a best guess about the middle of many possible outcomes, not a prediction of yours. Honest wording has four parts:
- A range, usually the 10th to 90th percentile: "about 58,000 to 190,000".
- A middle, the median, rounded: "middle about 106,000".
- A horizon and units: "after 25 years, in today's dollars".
- A risk line: "not a guarantee; you can get back less than you put in".
Round the numbers. "106,225" sounds precise, as if we knew; "about 106,000" sounds like what it is, a simulation.
A single number, especially a nominal yearly one like "12% a year", leaves out three of the four parts.
- Do"After 25 years, in 8 of 10 simulated paths: about 58,000–190,000 in today's dollars."
- Don't"Expected value: 106,225."
False precision, no range, no risk.
Testing a promise against the range
When someone proposes a single number, put it on the fan chart and ask: what share of outcomes reach it?
Chart: 150 dol. a month for 25 years, 2,000 simulated paths · shown above
Turn the promise into the same units first. "12% a year" is nominal; at 3% inflation it is 8.7% real. A steady 8.7% real on 150 dol. a month for 25 years gives 152,443. In our simulation 22.1% of paths end there or higher.
That number lands between the 75th and 90th percentiles. So the promise describes a good outcome, not a typical one: nearly four users in five would end below it.
The same test works for any headline: a "doubling" claim, a target balance, a competitor's projection. If the promise sits above the median, it is selling the lucky case.
- Do"That target is reached in about 1 of 5 simulated paths."
- Don'tQuoting the 90th percentile as "what you could have".
Explaining uncertainty to users
Most people read a chart in two seconds and keep one idea. Decide which idea that is: "your result will probably land inside this band, and nobody knows where".
Good chart copy does three things. It names the band in plain words: "8 of 10 simulated paths ended here". It anchors the middle with a rounded median and the money paid in, so users see growth and uncertainty together. And it states the risk without drama: a simulation, not a guarantee, and short periods can end below what was paid in.
Avoid jargon such as "P10" on the user's screen; "1 in 10 ended lower" says the same thing. And avoid colouring the top of the band as if it were the goal: the median is the honest anchor.
Chart: 150 dol. a month for 25 years, 2,000 simulated paths · shown above
- Do"1 in 10 paths ended below about 58,000; 1 in 10 above about 190,000."
- Don't"P10–P90 CI: 57,544–189,828."
Jargon and false precision.
Ready to practise?
Answer the lesson's exercises and earn 250 points the first time you finish it.
Start the exercises