

Theory
Holding period and the chance of a loss
How often 1-, 5-, 10- and 20-year periods ended with a real loss, including a market that went nowhere for 13 years.
~7 min read · 7 exercises · 250 points
Before you start
How long is long enough?
Another March day at Zapas. The onboarding team asks you, as the PM, one question: what minimum horizon should the app ask for before it suggests a stock-heavy portfolio? Ethan wants a big line on the first screen: "Stay 10 years and you can't lose."
Instead of guessing, you and Grace will test every possible start year in the 40 synthetic years and see how often holding for 1, 5, 10 or 20 years ended with less buying power.
Rolling periods
A single return "over 20 years" depends heavily on where you start and stop. Starting just before a crash or just after one can flip the story.
Rolling periods fix that by testing every start. With 40 years of history and a holding period of h years, there are 40 − h + 1 windows: 40 one-year windows, 36 of five years, 31 of ten, 21 of twenty. For each window you check one thing, here: did the investor end with less buying power than at the start?
The share of windows with a loss is a fair answer to "how often did people who held this long lose money?" It covers good and bad entry points alike.
Two cautions. Long windows overlap a lot, so 21 twenty-year windows are far from 21 independent tries. And history, especially synthetic history, is not a guarantee for the next window.
- Do"Of 31 ten-year windows in our synthetic history, 2 ended with a real loss."
- Don't"From year 1 to year 20 it gave X%, so 20 years is safe."
One start point is one story, not a pattern.
Time and the chance of a loss
For a broad world portfolio, a longer holding period sharply lowers the chance of ending behind inflation. In our 40 synthetic years, world stocks lost buying power in:
Chart data
| Holding period, years | Tessaro World | Tessaro Home |
|---|---|---|
| 1 | 30 | 42.5 |
| 5 | 19.4 | 25 |
| 10 | 6.5 | 35.5 |
| 20 | 0 | 38.1 |
- 30.0% of 1-year windows (12 of 40);
- 19.4% of 5-year windows (7 of 36);
- 6.5% of 10-year windows (2 of 31);
- 0.0% of 20-year windows (0 of 21).
Why? Over longer periods, good and bad years mix, and the steady growth from company profits gets time to outweigh the falls. The worst 20-year window still ended 15.0% up in real terms.
But "smaller" is not "zero". Ten years still left room for a loss, and the 20-year result rests on just 21 overlapping windows of a synthetic market. The next 20 years could include something worse than anything in this history.
- Do"Over 10-year windows, 2 of 31 lost buying power in our synthetic history."
- Don't"After 10 years you can't lose."
Five years is a minimum, not a guarantee
Five years is often quoted as the shortest sensible horizon for stocks. Our data shows why it's a minimum and not a safe zone.
Dataset · 4 rows
Rolling windows with a real loss, world vs home
7 of 36 five-year windows of world stocks ended with less buying power than they started with: 19.4%. And when a five-year window went wrong, it could go very wrong: the worst lost 42.2% after inflation, because a deep crash fits inside five years.
That changes how a product should phrase short horizons. A user with a 3-to-5-year goal isn't "safe because it's long-term"; they face roughly a one-in-five chance of a real loss in our history, sometimes a big one.
So the honest default is: the shorter the goal, the smaller the stock part. Exactly how small is a portfolio question we'll answer in summer; for now, show the numbers.
- Do"Over 5 years, about 1 window in 5 lost buying power; the worst lost 42.2%."
- Don't"Five years is long-term, so it's safe."
When time doesn't help
The comfort of a long horizon rests on one condition: what you hold has to keep growing over time. A broad mix of thousands of companies around the world has met that condition in our history. A single market doesn't have to.
Tessaro Home shows the risk. Between years 8 and 20 it rose 41.0% in dollars but only 0.5% after inflation: 13 years without real progress, while world stocks gained 179.4% in real terms. Its longer windows suffered too: a real loss in 35.5% of 10-year and 38.1% of 20-year windows, the worst −24.2%.
So holding period and diversification work together. A long horizon on a narrow bet can still end badly; a long horizon on a broad, global portfolio has much better odds. Next month's lessons look at why owning more of the world helps.
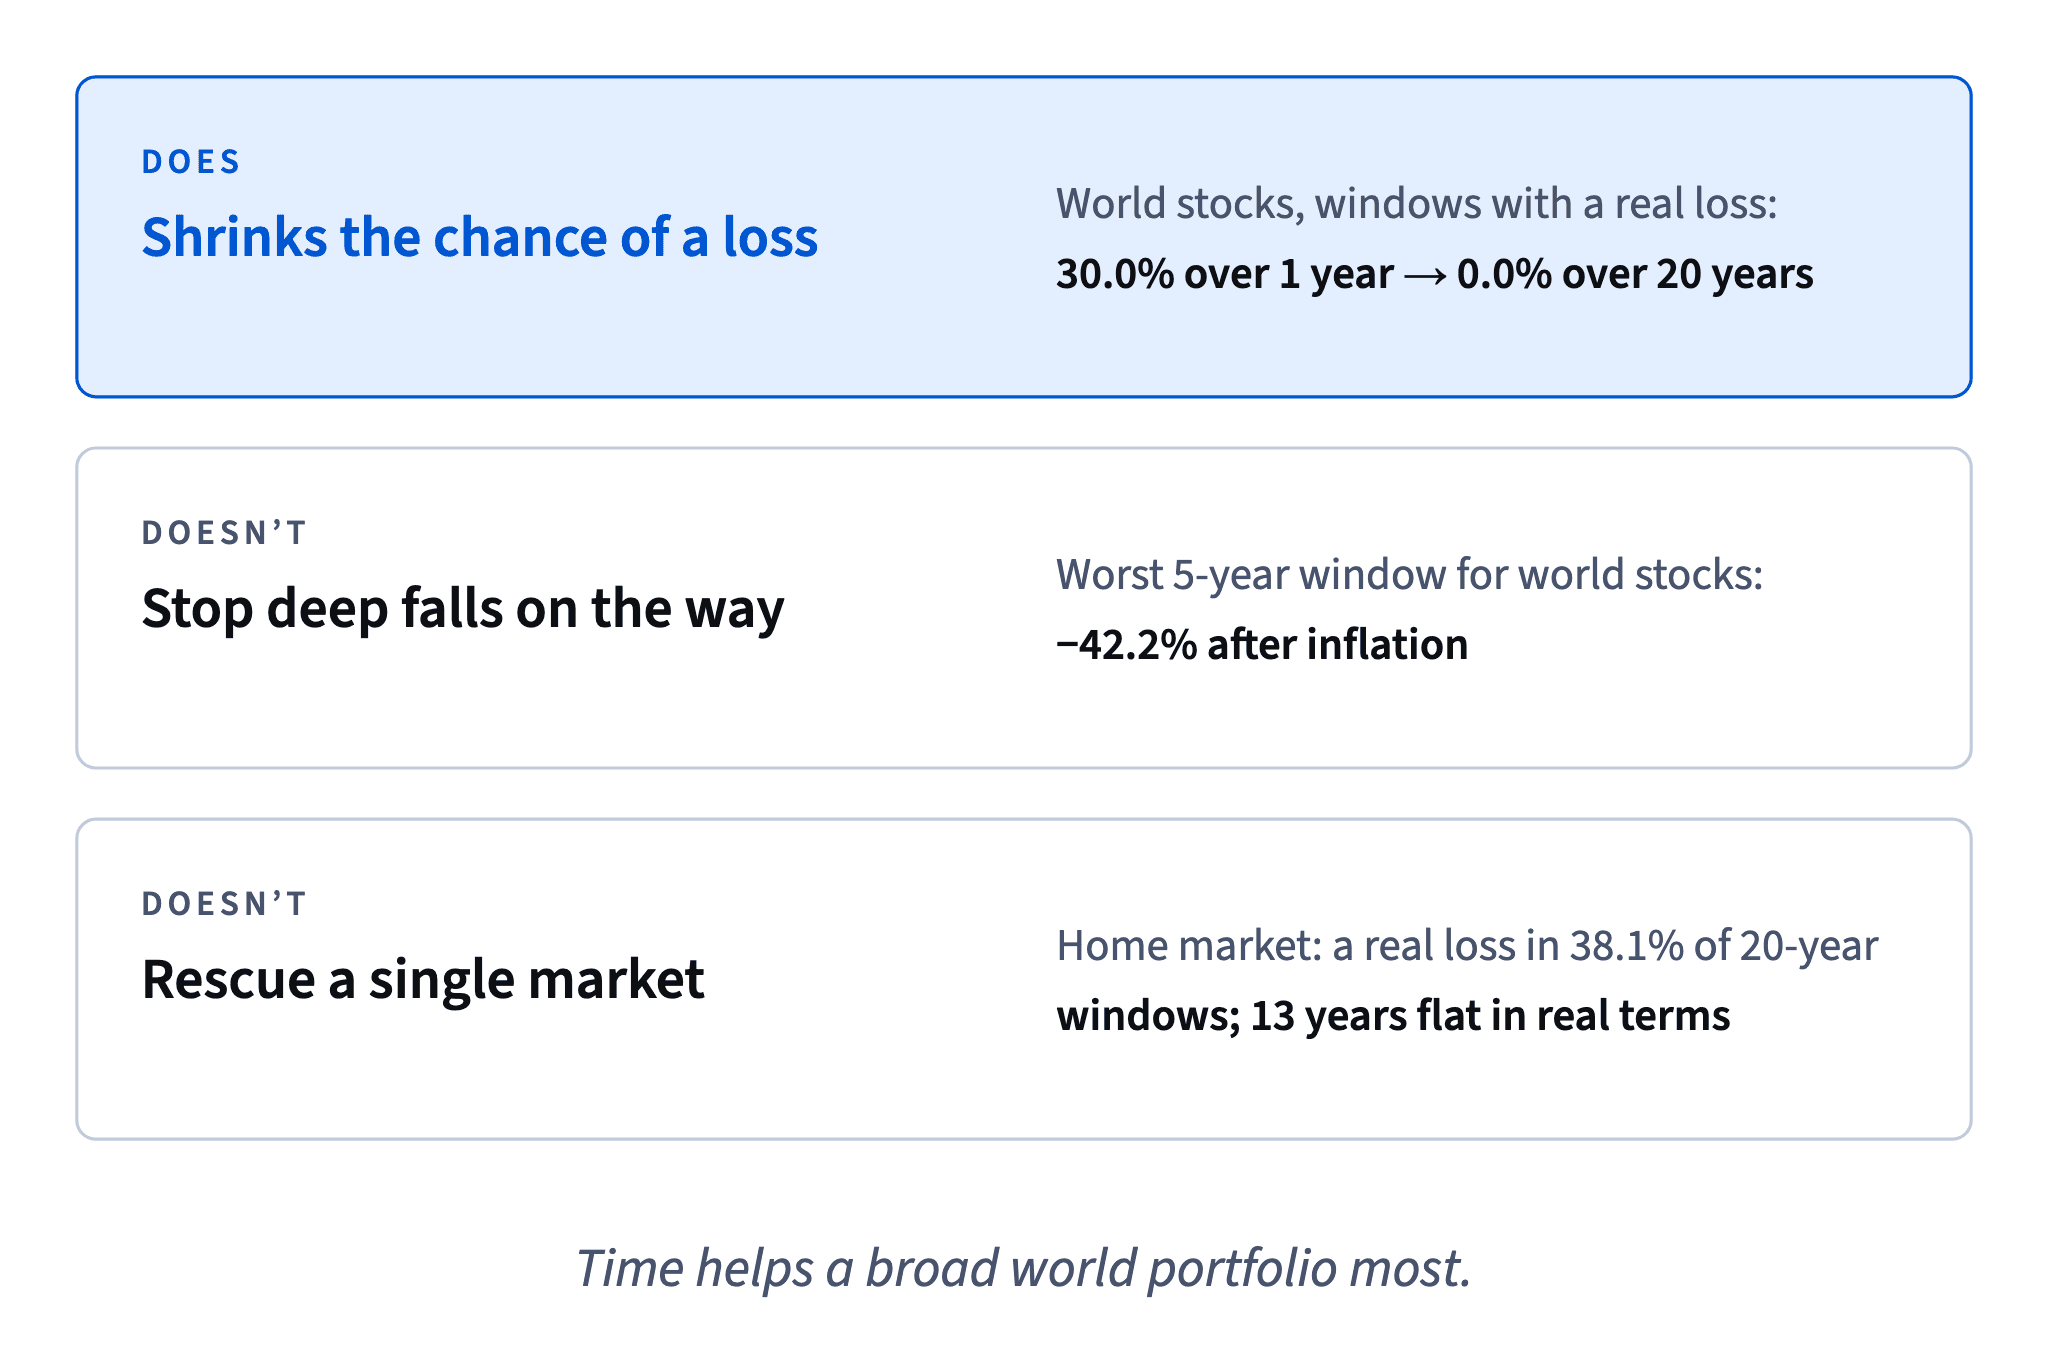
- Do"Long horizons helped the broad world index; one home market stayed flat for 13 years."
- Don't"Any stock market is safe if you wait 20 years."
Depth and odds are different questions
A share of losing windows tells you how often things went wrong. The worst window tells you how badly. A product needs both.
For world stocks in our data the two move together: the worst window improves from −31.8% over 1 year and −42.2% over 5 years to −7.8% over 10 and +15.0% over 20. Longer holding cut both the odds and the depth of a real loss.
Dataset: Rolling windows with a real loss, world vs home · shown above
For the home market it didn't: −35.9% was still possible over 10 years and −24.2% over 20, and the share of losing windows actually rose after 5 years, because the 13 flat years sit inside so many long windows.
When you design a horizon question, use both numbers: "how often" sets expectations, "how bad" tests whether the user could live with it.
- Do"5-year windows: 19.4% lost buying power; the worst lost 42.2%."
Asking for the horizon
The single most useful onboarding question for an investing app is "When will you need this money?" It decides how much a fall can hurt, because money needed soon has no time to wait for a recovery.
Turn the answer into the numbers from rolling windows:
- under 5 years: in our history stocks lost buying power in roughly a fifth to a third of windows, sometimes deeply, so most of the money belongs somewhere calmer;
- 5–10 years: losses got rarer (19.4% → 6.5%) but still happened;
- 20 years: a broad world portfolio never ended behind inflation in our data.
Ask about goals, not about appetite: "how would you feel about a fall" comes later. And never turn the answer into a guarantee: the history is synthetic, and the future can hold a longer slump than any in it.
- Do"When will you need this money?"
- Don't"Stay 10 years and you can't lose."
From a guarantee to evidence
Promises about time are tempting because they sound kind. "Stay 10 years and you can't lose" calms people down, until the user who lands in one of the losing windows reads it again.
An honest rewrite keeps the useful message (time helps) and swaps the guarantee for evidence:
- Say what time does: losing windows shrink with the horizon, from 30.0% over one year to 6.5% over ten and none over twenty for world stocks in our data.
- Say what it doesn't do: ten years still lost sometimes, and one market stayed flat for 13 years.
- Hand the decision back: ask when the user needs the money.
Chart: Share of rolling windows with a real loss · shown above
Keep the line short and label the data: "in our 40-year synthetic history". A careful sentence now saves a broken promise later.
- Do"The longer you stay, the less often it has lost: 6.5% of 10-year periods in our synthetic history."
- Don't"Stay 20 years and you're guaranteed to win."
Swaps one guarantee for another.
Ready to practise?
Answer the lesson's exercises and earn 250 points the first time you finish it.
Start the exercises