

Theory
A few big winners: why owning everything catches them
Over 20 years most companies do far worse than the index, almost half lose money and a handful make half the gains. Owning the whole market is the only sure way to own those few.
~6 min read · 7 exercises · 250 points
Before you start
Where the gains hide
Still April at Zapas, and the Top 10 debate with Ethan isn't over. Yesterday was about risk; today you look at what the same 200 synthetic companies actually returned over 20 years.
Ethan assumes a typical company did about as well as the index, so picking the better half should be easy. You'll see how widely the companies scatter and what that means for anyone trying to choose them in advance.
Most single companies disappoint
Look at companies one by one over a long period and a surprising picture appears. In the Zapas model of 200 synthetic companies over 20 years:
- 7 went to zero;
- 86 more lost money;
- so 93, or 46.5%, ended below where they started in real terms;
- only 12 grew more than tenfold.
Chart data
| 20-year real return, % | Companies |
|---|---|
| −100, went to zero | 7 |
| −99…0 | 86 |
| 0…100 | 27 |
| 100…300 | 35 |
| 300…1000 | 33 |
Show 1 more row
| 1000+ | 12 |
Yet the index of all 200 rose 235.4%. Both facts are true at once because the winners grew by far more than the losers could lose: a company can fall at most 100%, but it can rise 1,000% or more.
For an investor holding a few companies this is uncomfortable. Pick five at random and there is a real chance most of them end up as losers, even while "the market" did well.
- Do"Almost half the companies lost money, yet the index rose 235%."
- Don't"The market went up, so most stocks went up."
Skewed returns
Skewed returns means the outcomes are lopsided: many small or negative results and a long tail of very large ones. Single company returns over long periods look like that.
The reason is simple arithmetic. A share can lose at most 100% of its value, but it can gain without limit. Over 20 years, in the Zapas model, the best company returned +4,788.7%. One such company adds as much to the total as dozens of ordinary ones.
In a skewed set the median (the middle value) and the average split apart. Here the median company made 11.5% and the average, which is what the equal-amount index earns, made 235.4%.
So "the typical stock" and "the market" are different things. The market's return is carried by its tail.
Chart: 200 synthetic companies by 20-year real return · shown above
- Do"The median company made 11.5%; the index made 235.4% thanks to a few huge winners."
- Don't"The index made 235%, so a typical stock did about the same."
From a total return to a yearly one
Long-period returns are often quoted as a total: +235.4% over 20 years. To compare it with yearly numbers, convert it to a yearly rate that, compounded, gives the same total.
Add one, take the N-th root, subtract one: (1 + 2.354)^(1/20) − 1 = 6.2% a year.
Don't divide the total by the number of years. 235.4 ÷ 20 = 11.8% looks twice as good, because it ignores that each year's growth builds on the previous ones. The same mistake runs the other way: 6.2% a year sounds modest, yet over 20 years it more than triples the money.
When a product shows a long-run figure, say both forms: "+235% over 20 years, about 6.2% a year".
- Do"+235% over 20 years, about 6.2% a year."
- Don't"+235% over 20 years: that's 11.8% a year."
Simple division overstates the yearly rate.
Why owning everything catches the winners
If a small group of companies drives most of the market's gains, then the most important thing is to own that group. The trouble is that nobody can reliably name it in advance.
In the Zapas model, the top 10 of 200 companies (5%) produced 50.8% of all the net gains over 20 years. Only 53 companies (26.5%) beat the index at all. A short list chosen at the start is more likely to hold ordinary companies than tail winners, so its likely result is closer to the median company (11.5%) than to the index (235.4%).
A broad fund solves this without any forecasting: it owns every company, so it owns the future winners too. In real markets broad funds use market-cap weighting (bigger companies get a bigger share), so as winners grow, their weight grows with them.
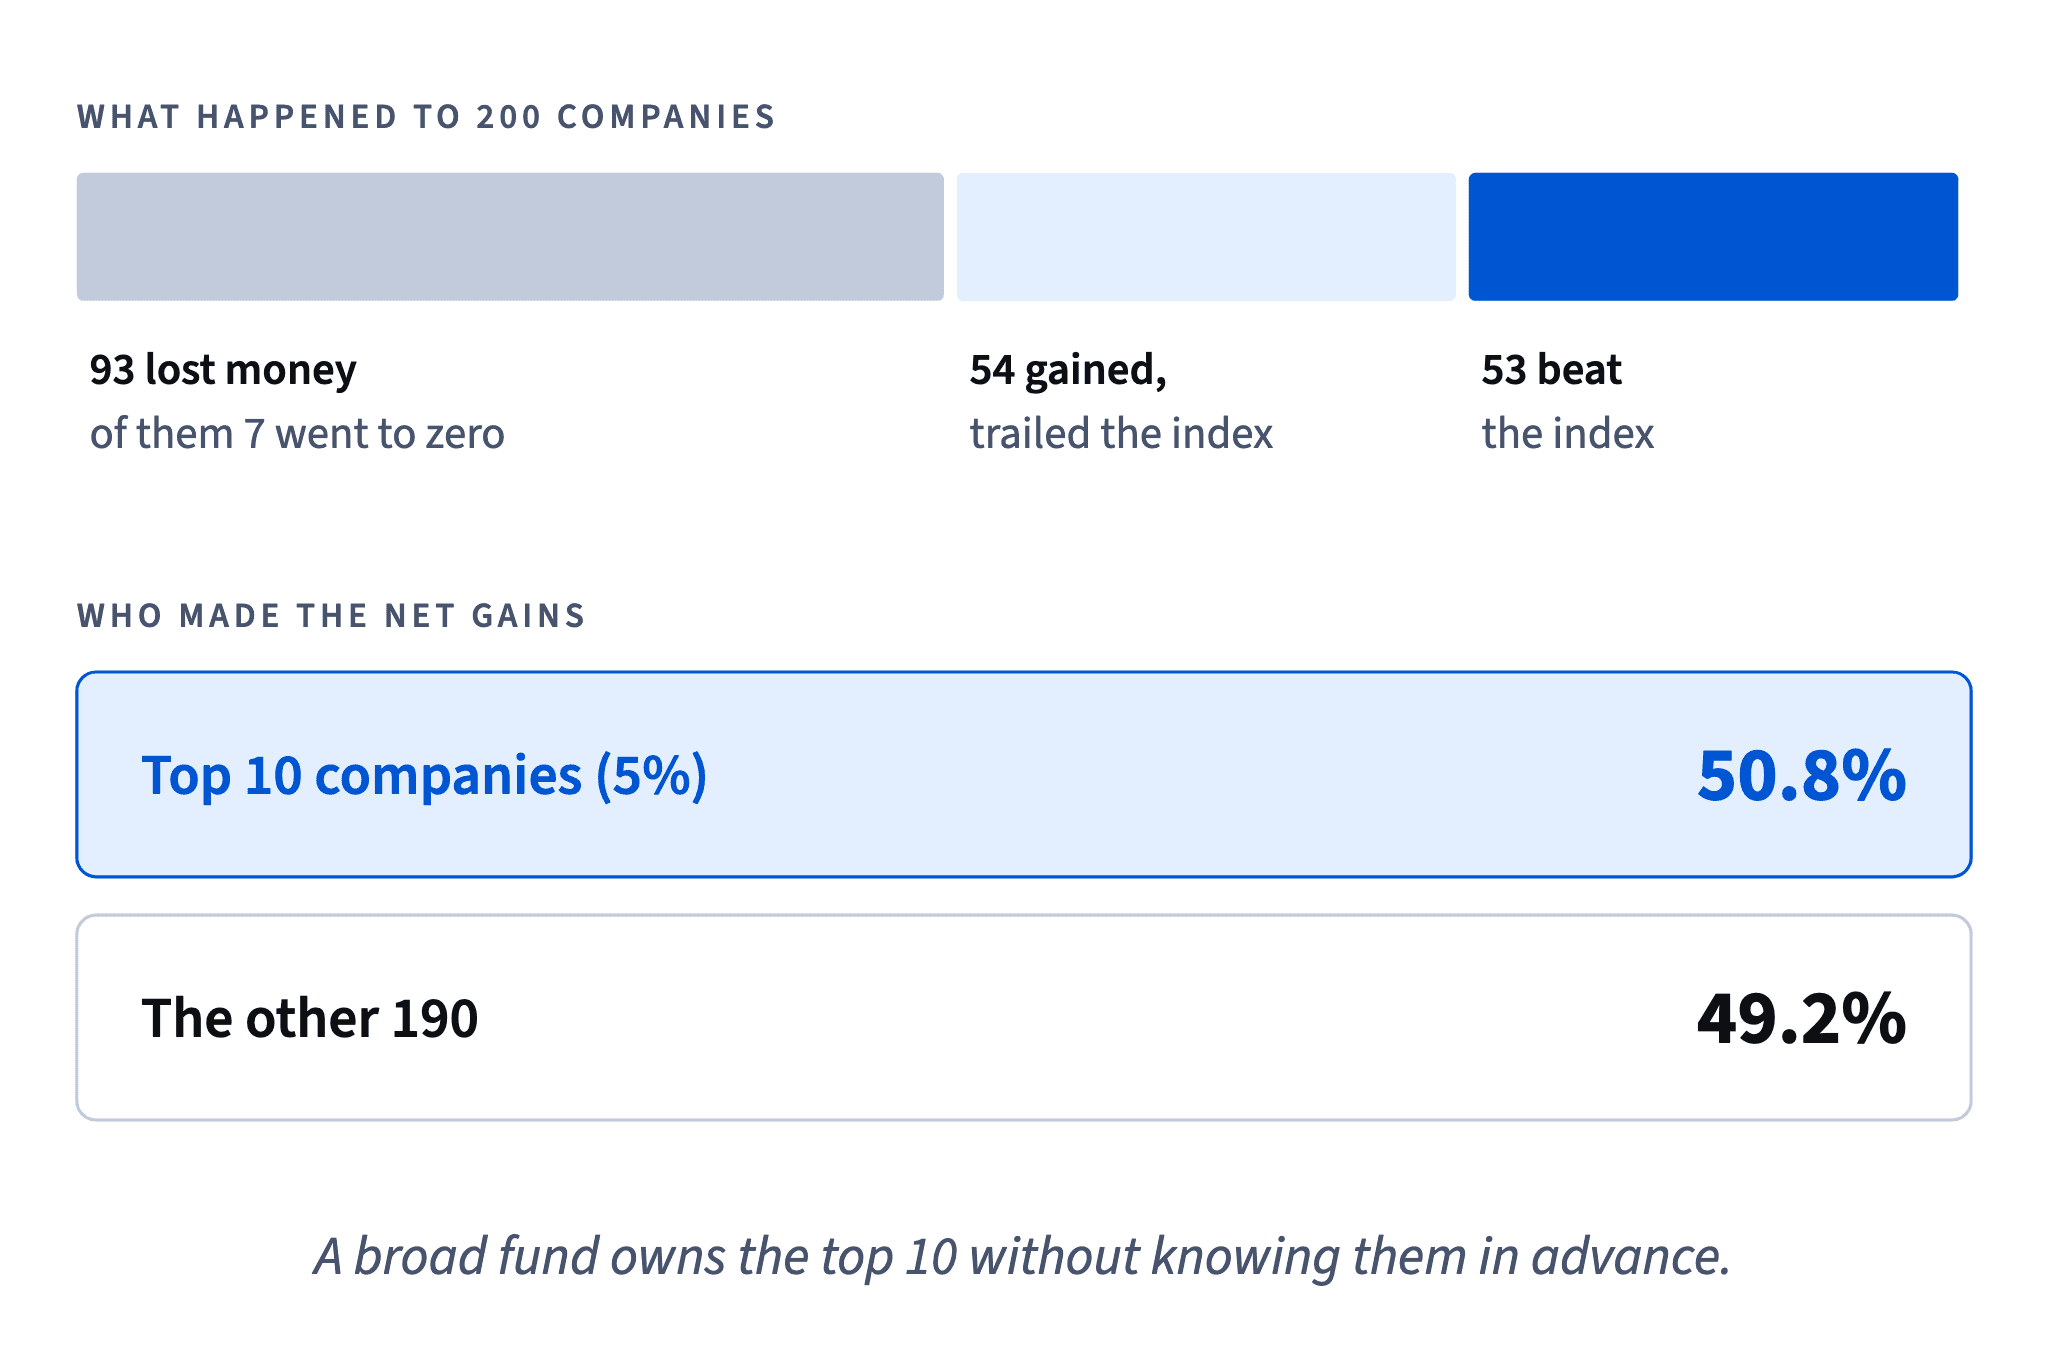
- Do"We own all of them, so we own whichever ones turn out to be the winners."
- Don't"We'll find the next big winners for you."
A promise nobody can keep reliably.
Concentration of gains
One way to measure how lopsided returns are is to ask: what share of all the gains came from the top few?
Add up the 20-year returns of all 200 companies, losers included, to get the net total. Then add up only the top 10. In the Zapas model the top 10 come to 50.8% of the net total. Ten companies did as much as the other 190 together.
This is why concentration cuts both ways. A portfolio that happens to own two or three of the tail winners can beat the market by a lot, and those stories get told. A portfolio that owns none of them lags badly, and those stories are rarely told. Because you can't tell in advance which portfolio you'll have, the expected result of a short list is worse than its best-case story suggests.
Picture: A broad fund owns the top 10 without knowing them in advance. · shown above
- Do"10 of 200 companies made 50.8% of the gains."
- Don't"My friend's three stocks beat the market, so picking works."
One lucky story, many silent ones.
What the model does and doesn't show
A model is useful only if you read it carefully. The 200-company data supports three claims:
- many single companies lose money over long periods even when the index rises (93 of 200);
- most companies trail the index; only 53 (26.5%) beat it;
- a small group makes a large share of the gains (the top 10 made 50.8%).
It does not show that picking is hopeless for everyone, that the same companies will win next time, or that real markets have exactly these numbers. It is a synthetic universe built to show a pattern, not a record of history.
In product copy, claim what the model shows and stop there. "In our model" is a short phrase that keeps the explainer honest.
Chart: 200 synthetic companies by 20-year real return · shown above
- Do"In our model, 10 of 200 companies made half the gains."
- Don't"Science proves stock picking never works."
Claims far more than a synthetic model can show.
Turning a finding into user copy
A newsletter paragraph is not a report. Users skim, so lead with the surprise, back it with one or two numbers, and end with what it means for them.
For this finding a strong order is:
- The surprise: almost half the companies lost money, and the middle one made only 11.5% in 20 years.
- The cause: a few companies, 10 of 200, made about half of all gains.
- The consequence: nobody can name them in advance, so the app owns everything, and therefore owns them.
Say the data is a synthetic model. Keep the tone calm: no "beat the market", no "guaranteed", and no hint that Zapas knows which companies will win. The point of the paragraph is that nobody does.
- Do"Ten companies made half the gains. Nobody knew which ten. So we own them all."
- Don't"Our model finds tomorrow's winners today."
Ready to practise?
Answer the lesson's exercises and earn 250 points the first time you finish it.
Start the exercises