

Theory
What 0.2% vs 1.5% does over 10 to 40 years
How much of the final balance different all-in costs take over decades of monthly contributions.
~6 min read · 7 exercises · 250 points
Before you start
A rounding error?
Still June at Zapas, a week after you counted every cost layer. The pricing page for the November launch is now on your desk. A bank fund charges 1.5% a year all-in, Zapas 0.2%, and Ethan calls the 1.3-point gap a rounding error: users care about returns, not decimals.
You'll take the same plan as on the goal screen, 100 dollars a month, change only the all-in cost and see what the decimals do over 10, 20, 30 and 40 years.
Fee drag: a small rate on a growing balance
Fee drag is how much of the final balance a yearly cost takes over the whole holding period. It is far larger than the yearly rate suggests, for two reasons.
First, the cost is charged on the whole balance, not on what you pay in this year. In year 35 of a plan, 1.5% is taken from tens of thousands of dollars.
Second, every dollar taken out stops compounding. It is gone together with all the growth it would have earned in the years left.
In our synthetic plan ($100 a month, 5% real before costs) the 1.5% cost takes 7.3% of the zero-cost balance after 10 years, 15.0% after 20, 22.8% after 30 and 30.5% after 40. The rate stays the same; its bite keeps growing. Always state a cost over the user's horizon, not only per year.
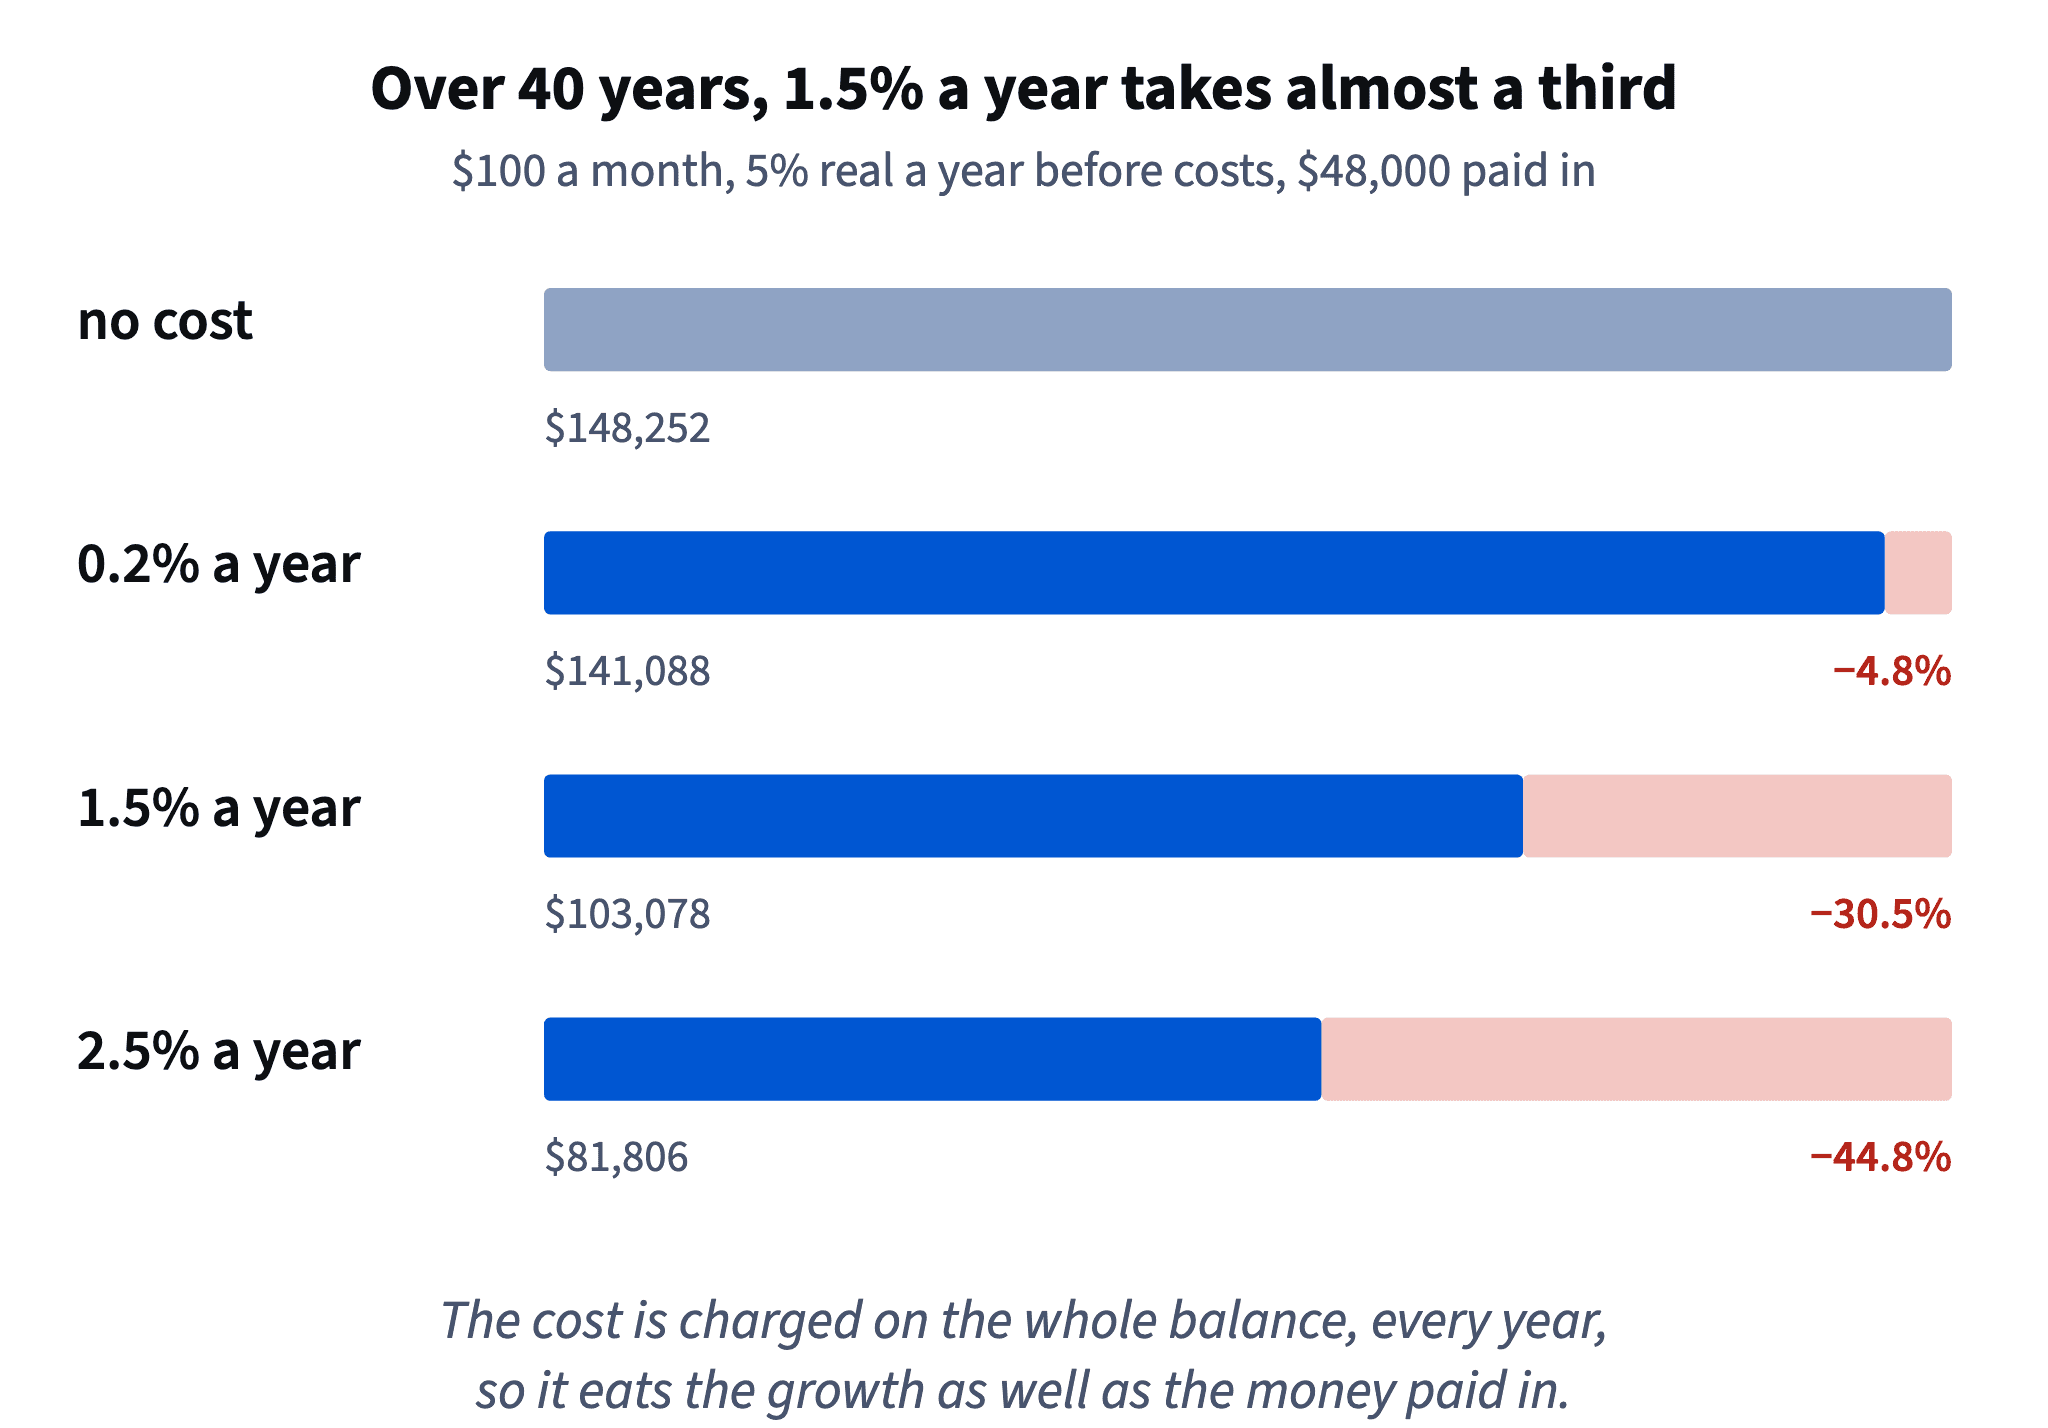
- Do“Over 40 years a 1.5% cost would take about 30% of this plan's balance.”
- Don't“It's only 1.5%, the difference is a rounding error.”
The rate is small; its effect on the final balance is not.
The drag grows with the horizon
To measure fee drag, compare two balances at the same horizon: the plan with zero cost and the plan with the cost. The share lost is 1 − balance with cost ÷ balance without cost.
Read across the horizons and a pattern appears. At a 1.5% all-in cost the share lost is 7.3% after 10 years, 15.0% after 20, 22.8% after 30 and 30.5% after 40. It roughly doubles from 10 to 20 years and keeps climbing, because the balance it is charged on keeps growing and the lost growth piles up.
For a 0.2% cost the same table reads 1.0%, 2.2%, 3.5% and 4.8%. The cheap plan also loses something, but even after 40 years it is less than a 1.5% plan loses in the first 10.
Dataset · 40 rows
\$100 a month for 40 years at 5% real before costs, by all-in cost
Synthetic. `contributed` = money paid in; `balance_c0`, `balance_c0_2`, `balance_c1_5`, `balance_c2_5` = balance at the end of the year with an all-in cost of 0%, 0.2%, 1.5% and 2.5% a year (monthly rate (1 + (5 − c)/100)^(1/12) − 1).
First 5 of 40 rows
That is why horizon belongs on every cost screen: a user saving for 30 years should see the 30-year number.
Chart data
| Year | Paid in | 0% cost | 0.2% cost | 1.5% cost | 2.5% cost |
|---|---|---|---|---|---|
| 0 | 0 | 0 | 0 | 0 | 0 |
| 5 | 6,000 | 6,781 | 6,748 | 6,538 | 6,380 |
| 10 | 12,000 | 15,436 | 15,280 | 14,302 | 13,597 |
| 15 | 18,000 | 26,482 | 26,064 | 23,524 | 21,764 |
| 20 | 24,000 | 40,580 | 39,698 | 34,477 | 31,003 |
Show 4 more rows
| 25 | 30,000 | 58,573 | 56,934 | 47,485 | 41,457 |
| 30 | 36,000 | 81,538 | 78,722 | 62,935 | 53,284 |
| 35 | 42,000 | 110,846 | 106,267 | 81,284 | 66,666 |
| 40 | 48,000 | 148,252 | 141,088 | 103,078 | 81,806 |
- Do“Lost share = 1 − 62,935 ÷ 81,538 = 22.8% at 30 years.”
- Don't“1.5% a year × 30 years = 45% lost.”
Costs don't simply add up; compare the two balances.
Show the gap in money
Percentages of percentages are hard to feel. The same comparison in money is not. Take the two balances at the user's horizon and subtract.
In our plan ($100 a month, 5% real a year before costs) the gap between a 0.2% and a 1.5% all-in cost is $977 after 10 years, $5,222 after 20, $15,788 after 30 and $38,011 after 40. The person paid in $12,000, $24,000, $36,000 and $48,000 at those points. By year 40 the cost gap is close to everything they paid in.
Dataset: \$100 a month for 40 years at 5% real before costs, by all-in cost · shown above
Two cautions keep this honest. These are real dollars in a synthetic plan with a steady 5% before costs; real markets jump around, so the balances are illustrations, not forecasts. But the cost gap is the part that holds whatever the market does: the cheaper plan keeps more in good decades and bad ones.
Chart: Balance of a \$100-a-month plan by all-in cost · shown above
- Do“Over 30 years the cheaper plan would keep about $15,800 more in this example.”
- Don't“Switch and you'll have $15,788 more.”
A promise of an exact amount; the market path is unknown.
Compare the cost with the return, not with 100%
"1.5%" sounds small because we compare it, silently, with 100% of the money. The fair comparison is with what the money is expected to earn. A diversified plan might earn something like 5% a year after inflation before costs, with a wide range around it.
Measured that way, a 1.5% cost takes 1.5 ÷ 5 = 30% of the expected real return every year. A 0.2% cost takes 4%. A 2.5% cost takes half.
Because costs are certain and returns are not, the share can be even larger in a weak decade. In a stretch where the market earns 2% real before costs, a 1.5% cost leaves almost nothing.
This is the quickest sense check for any product: divide its all-in cost by a sober real return. If the answer is above a quarter, the cost is a big part of the deal.
- Do“1.5% out of an expected 5% real is 30% of the return.”
- Don't“1.5% out of 100% is nothing.”
A higher cost is a yearly hurdle
A more expensive fund can still be worth its price, but only if it earns more before costs than the cheaper one, by at least the cost gap, year after year. Between a 0.2% and a 1.5% all-in cost the gap is 1.3 points. Over 40 years of our synthetic plan ($100 a month, 5% real a year before costs), failing to clear it costs $38,011.
That turns a vague promise ("our managers are good") into a test you can check: has this fund, after all costs, beaten a cheap fund on the same market by more than 1.3 points a year, over a long period, and is there a reason to expect that to continue? Long records of active funds show that early winners rarely repeat and that closed funds quietly drop out of the averages.
So treat a cost gap like a head start you give away. You need strong, lasting evidence to give it away for decades.
- Do“It has to beat the cheap fund by 1.3 points a year after costs, every year. Show me 15 years of that.”
- Don't“Last year it beat the index by 4 points, so the fee pays for itself.”
One year says little about the next forty.
Put the horizon on the cost
Users decide on what they see in the moment, and a yearly percentage looks harmless. A product that wants users to understand costs translates the rate into the user's own plan: their monthly amount, their horizon, the share of the balance or the dollars it would take.
Three rules keep that translation honest:
- use the user's horizon, not the most dramatic one;
- label the numbers as an illustration with stated assumptions (here: 5% real a year before costs, $100 a month);
- compare like with like: all-in costs on both sides.
Done this way, cost becomes a feature a low-cost product can show openly, instead of a footnote. It also protects users from the opposite trap: a fund with higher costs has to earn that much more every single year just to stay level.
Picture: Same plan, same market, only the cost differs. · shown above
- Do“Your plan, 30 years: about $15,800 more at 0.2% than at 1.5% (example, 5% real before costs).”
- Don'tShowing the 40-year number to a user saving for 5 years.
Ready to practise?
Answer the lesson's exercises and earn 250 points the first time you finish it.
Start the exercises