

Theory
Drawdown, recovery and time under water
Maximum drawdown, the gain needed to get back to the peak and how many months a portfolio can stay below it.
~7 min read · 7 exercises · 250 points
Before you start
The worst stretch
Still March at Zapas. Yesterday's beta questions were about one bad month. Today, as the PM who writes the risk screen, you need the worst stretch in the synthetic Tessaro history: the crash of years 21 and 22.
Ethan thinks the worst case is simply the worst year. You'll follow 100 dollars through that crash month by month and measure how deep the fall went and how long the money stayed below its old peak.
What a drawdown measures
A drawdown is how far a portfolio sits below its highest value so far. The maximum drawdown is the deepest such fall in a period: from a peak to the lowest point before that peak is regained.
To compute it, divide the trough by the peak and subtract from one. In the Tessaro crash: 1 − 63.32 ÷ 115.95 = 45.4%.
Chart data
| Month of the window | Value |
|---|---|
| 1 | 101.19 |
| 2 | 103.3 |
| 3 | 101.85 |
| 4 | 104.28 |
| 5 | 105.31 |
Show 91 more rows
| 6 | 105.94 |
| 7 | 107.83 |
| 8 | 106.96 |
| 9 | 108.55 |
| 10 | 110.6 |
| 11 | 113.03 |
| 12 | 115.95 |
| 13 | 112.36 |
| 14 | 105.39 |
| 15 | 110.03 |
| 16 | 100.9 |
| 17 | 96.26 |
| 18 | 103.09 |
| 19 | 99.17 |
| 20 | 90.05 |
| 21 | 93.02 |
| 22 | 87.72 |
| 23 | 95.09 |
| 24 | 90.43 |
| 25 | 83.78 |
| 26 | 90.94 |
| 27 | 80.8 |
| 28 | 77.21 |
| 29 | 85.28 |
| 30 | 77.9 |
| 31 | 72.8 |
| 32 | 75.6 |
| 33 | 68.15 |
| 34 | 65.87 |
| 35 | 68.93 |
| 36 | 63.32 |
| 37 | 70.82 |
| 38 | 75.1 |
| 39 | 71.76 |
| 40 | 77.9 |
| 41 | 79.96 |
| 42 | 78.08 |
| 43 | 80.93 |
| 44 | 82.19 |
| 45 | 79.27 |
| 46 | 81.21 |
| 47 | 81.98 |
| 48 | 81.04 |
| 49 | 79.48 |
| 50 | 80.92 |
| 51 | 80.51 |
| 52 | 87.04 |
| 53 | 88.97 |
| 54 | 89.86 |
| 55 | 92.96 |
| 56 | 95.46 |
| 57 | 91.99 |
| 58 | 91.44 |
| 59 | 94.26 |
| 60 | 95.64 |
| 61 | 93.79 |
| 62 | 89.24 |
| 63 | 91.45 |
| 64 | 94.7 |
| 65 | 91.51 |
| 66 | 94.18 |
| 67 | 94.1 |
| 68 | 95.6 |
| 69 | 100.29 |
| 70 | 105.25 |
| 71 | 110.75 |
| 72 | 109.99 |
| 73 | 109 |
| 74 | 113.29 |
| 75 | 107.35 |
| 76 | 107.59 |
| 77 | 110.64 |
| 78 | 106.84 |
| 79 | 100.76 |
| 80 | 100.83 |
| 81 | 102.97 |
| 82 | 109.99 |
| 83 | 111.99 |
| 84 | 119.77 |
| 85 | 123.47 |
| 86 | 127.36 |
| 87 | 125.27 |
| 88 | 124.35 |
| 89 | 121.35 |
| 90 | 126.05 |
| 91 | 125.45 |
| 92 | 116.07 |
| 93 | 116.96 |
| 94 | 119.6 |
| 95 | 117.77 |
| 96 | 117.37 |
Two things make drawdowns different from "the worst year". First, a fall can stretch over several years: year 21 was −22.0% and year 22 −30.0%, so the worst single year hides a much deeper slide. Second, losses multiply rather than add: 0.78 × 0.70 = 0.546, a 45.4% fall, not 52%.
A drawdown is the number a user actually lives through. Anyone who invested at the peak watched almost half of it disappear on screen before anything got better.
- Do"From its peak, this fell 45.4% over two years in our synthetic history."
- Don't"The worst year was −30%, so you can't lose more than 30%."
A fall can span several years.
Losses and gains are not symmetric
A percentage loss and the gain that undoes it are never the same size, because the gain starts from a smaller amount.
The rule: gain needed = 1 ÷ (1 − loss) − 1.
- a 10% loss needs +11.1%;
- a 20% loss needs +25.0%;
- a 30% loss needs +42.9%;
- a 50% loss needs +100.0%.
The deeper the fall, the faster the gap grows. In the Tessaro crash, the 45.4% drawdown needed +83.1% to recover: 115.95 ÷ 63.32 − 1.
This is one reason a broad portfolio matters. Small and medium falls are recovered by ordinary growth; very deep ones can take many years. The same arithmetic appears in the trading course, where it explains why large bets ruin accounts.
- Do"Down 30% means you need +42.9% to get back."
- Don't"It fell 45%, so a 45% rise brings it back."
A quick table of the way back
Keep a small table in your head; it makes risk messages honest without a calculator.
Formula: The gain needed to get back to the peak after a drawdown · shown above
Notice the shape. Up to about −20% the gain needed is only a little bigger than the fall. Past −30% it pulls away fast, and at −50% you need to double your money.
For product copy this means a simple line like "a 30% fall needs about 43% to recover" sets expectations better than a promise of quick rebounds. It also explains why protecting users from very deep falls in the part of their money they need soon matters more than squeezing out a little more return.
- Do"A 30% fall needs about 43% to get back."
Time under water
Time under water is how long a portfolio stays below its previous peak. It has two parts: the way down (peak to trough) and the way back (trough to a new peak).
In the Tessaro crash the way down took 24 months and the way back 48: 72 months under water in dollars. The recovery took twice as long as the fall, which is typical of deep drawdowns because of the asymmetry of gains and losses.
Chart data
| Month of the window | Drawdown |
|---|---|
| 1 | 0 |
| 2 | 0 |
| 3 | -1.4 |
| 4 | 0 |
| 5 | 0 |
Show 91 more rows
| 6 | 0 |
| 7 | 0 |
| 8 | -0.8 |
| 9 | 0 |
| 10 | 0 |
| 11 | 0 |
| 12 | 0 |
| 13 | -3.1 |
| 14 | -9.1 |
| 15 | -5.1 |
| 16 | -13 |
| 17 | -17 |
| 18 | -11.1 |
| 19 | -14.5 |
| 20 | -22.3 |
| 21 | -19.8 |
| 22 | -24.4 |
| 23 | -18 |
| 24 | -22 |
| 25 | -27.7 |
| 26 | -21.6 |
| 27 | -30.3 |
| 28 | -33.4 |
| 29 | -26.5 |
| 30 | -32.8 |
| 31 | -37.2 |
| 32 | -34.8 |
| 33 | -41.2 |
| 34 | -43.2 |
| 35 | -40.6 |
| 36 | -45.4 |
| 37 | -38.9 |
| 38 | -35.2 |
| 39 | -38.1 |
| 40 | -32.8 |
| 41 | -31 |
| 42 | -32.7 |
| 43 | -30.2 |
| 44 | -29.1 |
| 45 | -31.6 |
| 46 | -30 |
| 47 | -29.3 |
| 48 | -30.1 |
| 49 | -31.5 |
| 50 | -30.2 |
| 51 | -30.6 |
| 52 | -24.9 |
| 53 | -23.3 |
| 54 | -22.5 |
| 55 | -19.8 |
| 56 | -17.7 |
| 57 | -20.7 |
| 58 | -21.1 |
| 59 | -18.7 |
| 60 | -17.5 |
| 61 | -19.1 |
| 62 | -23 |
| 63 | -21.1 |
| 64 | -18.3 |
| 65 | -21.1 |
| 66 | -18.8 |
| 67 | -18.8 |
| 68 | -17.6 |
| 69 | -13.5 |
| 70 | -9.2 |
| 71 | -4.5 |
| 72 | -5.1 |
| 73 | -6 |
| 74 | -2.3 |
| 75 | -7.4 |
| 76 | -7.2 |
| 77 | -4.6 |
| 78 | -7.9 |
| 79 | -13.1 |
| 80 | -13 |
| 81 | -11.2 |
| 82 | -5.1 |
| 83 | -3.4 |
| 84 | 0 |
| 85 | 0 |
| 86 | 0 |
| 87 | -1.6 |
| 88 | -2.4 |
| 89 | -4.7 |
| 90 | -1 |
| 91 | -1.5 |
| 92 | -8.9 |
| 93 | -8.2 |
| 94 | -6.1 |
| 95 | -7.5 |
| 96 | -7.8 |
After inflation the wait was longer still. Prices kept rising while the index climbed back, so in buying power the year-20 peak was regained only in year 31, 11 years later.
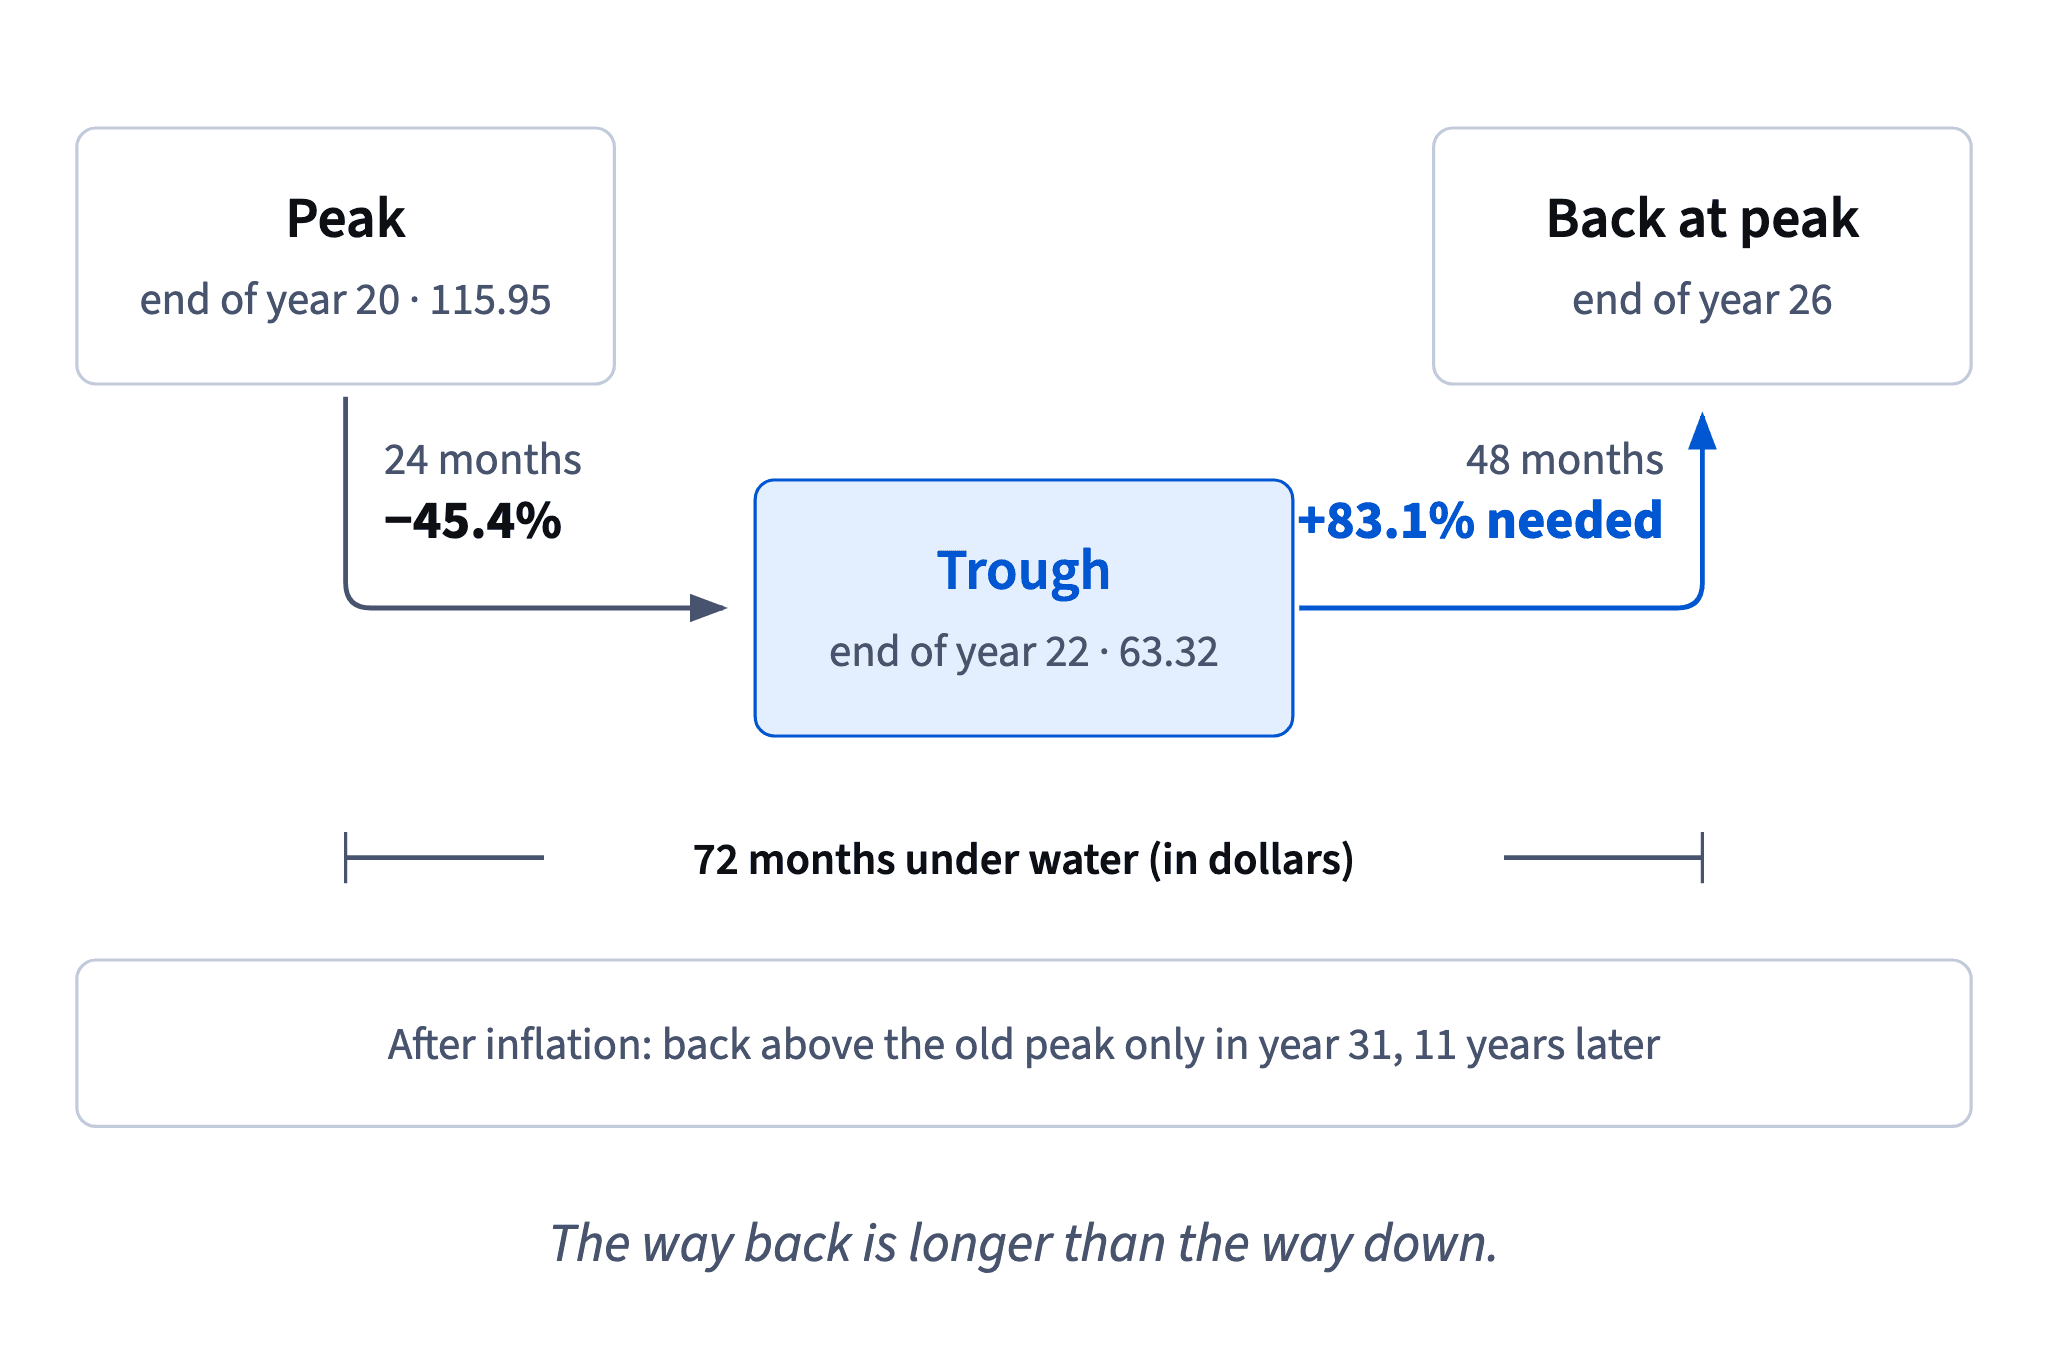
For a user, time under water often matters more than depth. A 20% fall that heals in a year feels very different from a 45% fall that takes six. Risk screens should show both: how deep, and how long.
- Do"In the worst synthetic crash, it took 72 months to get back to the old peak."
- Don't"Markets recover in a few months."
Count from the peak
"How long did recovery take?" has several honest-sounding answers, and only one fits the person asking.
Measured from the trough, the Tessaro index needed 48 months to regain its peak. Measured from the peak, the wait was 72 months, because the fall itself took 24. A user who bought at the top lives through the whole 72.
Then decide between dollars and buying power. In nominal dollars the peak came back at the end of year 26. In real terms, after inflation, it took until year 31.
The honest product answer names the starting point and the units: "from peak back to peak, 72 months in dollars; 11 years after inflation". It also labels the history as synthetic and adds that the next fall could be shorter or longer. No two crashes have the same shape.
- Do"Peak to peak: 72 months in dollars, 11 years in real terms (synthetic history)."
- Don't"Recovered within two years of the bottom."
True from the trough, misleading for anyone who bought earlier.
Nominal recovery is not real recovery
A chart in dollars can show a full recovery while the investor is still behind in what the money buys.
During the 72 months under water in the Tessaro crash, inflation kept running at about 3% a year. So when the index regained 115.95 in dollars at the end of year 26, those dollars bought noticeably less than at the end of year 20. In real terms, the old peak was passed only in year 31.
Chart: 100 dol. in Tessaro World, years 20–27, month by month · shown above
For long-term goals, buying power is what counts: a flat in 15 years, education, retirement. So when a product says "recovered", it should say in which units. Users with hryvnia goals have one more layer, the exchange rate, which we come to later in the course.
The practical habit: whenever you quote a recovery time, ask "nominal or real?" and show the real one for goal-based screens.
- Do"Back to the old peak in dollars after 72 months; in buying power after 11 years."
Writing an honest FAQ line about crashes
FAQ answers are read by people who are already a little worried, so every word gets weighed. Three things keep a crash answer honest.
Replace "always" with history. "Markets always bounce back" is a promise. "In our 40-year synthetic history, the deepest fall was 45.4% and took 72 months to regain its peak" is a fact with a source.
Give depth and time. How far it fell (45.4%), what it took to recover (+83.1%), and how long (72 months in dollars, 11 years in real terms).
Link it to the user's horizon. The point isn't to scare people away; it's to keep money needed soon out of a portfolio that might be under water when they need it.
Short sentences, no jargon, and one clear takeaway at the end.
- Do"The deepest synthetic fall took 72 months to undo; money needed sooner shouldn't wait on that."
- Don't"Don't worry, it always comes back fast."
Ready to practise?
Answer the lesson's exercises and earn 250 points the first time you finish it.
Start the exercises