

Theory
Regular amounts, a lump sum and rebalancing rules
Investing at once vs in monthly parts, and rebalancing yearly, by a band or never: drift and drawdown.
~7 min read · 7 exercises · 250 points
Before you start
All at once or bit by bit?
Early August at Zapas. The mixes are drafted, and two practical rules are still missing: how a user's first money goes in, and how each portfolio stays at its mix over the years.
A beta user's bank deposit has just matured, and they want to put 12,000 dollars in at once, while support says to drip it in over a year to be safe. You'll test both on the Tessaro history and then work out a sensible rule for bringing a drifting mix back on target.
At once or in parts: what the windows show
When someone has a lump sum, there are two ways in: invest it all now, or spread it over several months (often called averaging in). The second feels safer because a fall right after the start hurts less.
In the Tessaro test, $12,000 at once beat 12 monthly parts in 21 of 31 ten-year windows, 67.7%. The reason is simple: markets rise in most years, and money waiting in cash earns only the cash rate meanwhile. Spreading is a bet that prices will be lower during the waiting months, and that bet usually loses.
It wins when a fall comes soon after the start. Spreading doesn't raise the expected result; what it buys is a shallower hole in the first year if a fall does come. Both are honest choices if the user understands the trade-off. Investing a monthly salary each month is different: that money arrives monthly, so there is nothing to wait with.
Chart data
| Start year | At once | Over 12 months |
|---|---|---|
| 1 | 29,896 | 26,362 |
| 2 | 25,301 | 27,671 |
| 3 | 31,277 | 31,606 |
| 4 | 31,242 | 31,135 |
| 5 | 38,956 | 35,561 |
Show 26 more rows
| 6 | 33,848 | 33,391 |
| 7 | 37,013 | 34,951 |
| 8 | 39,345 | 39,096 |
| 9 | 36,085 | 31,596 |
| 10 | 31,136 | 31,515 |
| 11 | 37,683 | 37,977 |
| 12 | 27,622 | 25,411 |
| 13 | 16,876 | 16,070 |
| 14 | 19,102 | 17,995 |
| 15 | 19,254 | 19,800 |
| 16 | 21,692 | 19,102 |
| 17 | 19,019 | 17,484 |
| 18 | 14,525 | 15,331 |
| 19 | 16,501 | 15,765 |
| 20 | 17,869 | 17,093 |
| 21 | 15,117 | 17,776 |
| 22 | 23,649 | 27,884 |
| 23 | 35,023 | 29,280 |
| 24 | 34,694 | 32,442 |
| 25 | 33,516 | 33,671 |
| 26 | 27,982 | 28,928 |
| 27 | 21,064 | 21,011 |
| 28 | 22,788 | 22,605 |
| 29 | 26,713 | 24,442 |
| 30 | 31,936 | 31,727 |
| 31 | 42,069 | 38,867 |
- Do“At once won in 21 of 31 windows; spreading mainly shrinks a bad first year.”
- Don't“Spreading over a year is the safe way and earns more.”
In two windows of three it earned less.
The worst start, and its mirror
Averages hide the stories people remember. In the Tessaro test the worst window for investing at once started in year 22, just before the bottom of the crash. $12,000 invested on day one was worth $23,649 ten years later; spread over twelve months it was worth $27,884. The sharper difference came early. Twelve months in, the at-once money stood at about $8,400, 30% below what went in; the spread money was about $10,000, down 17%. That smaller first-year hole is what spreading buys.
The mirror case started a year later, in year 23, right after the bottom. Then waiting in cash cost money: $35,023 at once against $29,280 spread.
Nobody knows in advance which of the two years they are in. So a product can present both facts: investing at once usually ends higher; spreading over a few months makes the first year's worst case smaller. Let the user pick, and make the rule automatic so the choice isn't made again every week.
Chart: Value after 10 years: lump sum vs 12 monthly parts · shown above
- Do“Usually higher at once; spreading over 12 months softens a fall that comes right after.”
- Don't“Wait until the market calms down, then invest.”
An open-ended wait is market timing, not a rule.
Present a trade-off as a trade-off
Some product choices have no right answer for everyone, only a trade-off. Investing a lump sum is one of them: at once wins more often, spreading hurts less in the bad case.
A screen that pushes one option as "safer and better" either misleads (if it claims spreading earns more) or hides the risk (if it claims at once is always right). The honest pattern has three parts:
- the usual result, with its source: "in our synthetic history at once ended higher in 21 of 31 windows";
- the downside of each option, in plain words: a fall right after the start, or months of cash earning little;
- a default the user can change, carried out automatically so they don't have to decide again each month.
This is the same rule as everywhere in the course: a range or a trade-off, never a promise.
- Do“Default: invest now. Prefer 12 monthly parts? Switch here.”
- Don't“Our smart entry gets you in at the best price.”
Drift: a portfolio changes its mix by itself
A mix is set once, but the markets move its parts at different speeds. When stocks grow faster than bonds, as they did over most of the Tessaro history, their share rises year after year. This is called drift.
A 60/40 started in year 1 and never touched was 81.8% stocks by year 20 and 88.5% by year 40. The user still thinks they own a balanced portfolio, but its risk now looks like an 80/20 or a 90/10: in the Tessaro data such mixes fell 38.0% or more from a peak.
Rebalancing means selling some of what grew and buying what lagged to get back to the target. It is not a way to earn more. It is a way to keep the risk the user chose, so that the worst-case numbers shown at onboarding stay true.
Chart data
| Year | Never rebalanced | 5-point band |
|---|---|---|
| 1 | 63.7 | 63.7 |
| 2 | 61.3 | 61.3 |
| 3 | 63.6 | 63.6 |
| 4 | 60.3 | 60.3 |
| 5 | 62.8 | 62.8 |
Show 35 more rows
| 6 | 64.3 | 64.3 |
| 7 | 67.7 | 67.7 |
| 8 | 69.3 | 61.8 |
| 9 | 71.7 | 64.5 |
| 10 | 70.6 | 63.2 |
| 11 | 70.9 | 63.6 |
| 12 | 72.6 | 65.4 |
| 13 | 74.7 | 62.6 |
| 14 | 76 | 64.2 |
| 15 | 75.5 | 63.6 |
| 16 | 77.8 | 66.5 |
| 17 | 81 | 64.6 |
| 18 | 80.2 | 63.4 |
| 19 | 79.5 | 62.5 |
| 20 | 81.8 | 65.8 |
| 21 | 76.2 | 51.8 |
| 22 | 67.4 | 49.2 |
| 23 | 71.1 | 64.1 |
| 24 | 73.4 | 66.7 |
| 25 | 75.6 | 62.8 |
| 26 | 75.3 | 62.3 |
| 27 | 75 | 62 |
| 28 | 75.5 | 62.6 |
| 29 | 76.8 | 64.2 |
| 30 | 75.1 | 62.1 |
| 31 | 77.9 | 65.6 |
| 32 | 77.6 | 59.6 |
| 33 | 80.7 | 64.1 |
| 34 | 81.8 | 65.7 |
| 35 | 81.2 | 59.1 |
| 36 | 78.8 | 55.5 |
| 37 | 79.1 | 55.9 |
| 38 | 82.5 | 61.2 |
| 39 | 85.7 | 66.8 |
| 40 | 88.5 | 65.7 |
- Do“Your 60/40 has drifted to 70/30; we'll bring it back to 60/40.”
- Don't“Leave it, the stocks are doing great.”
That is how a 60/40 quietly becomes a 90/10.
Compare results at the same risk
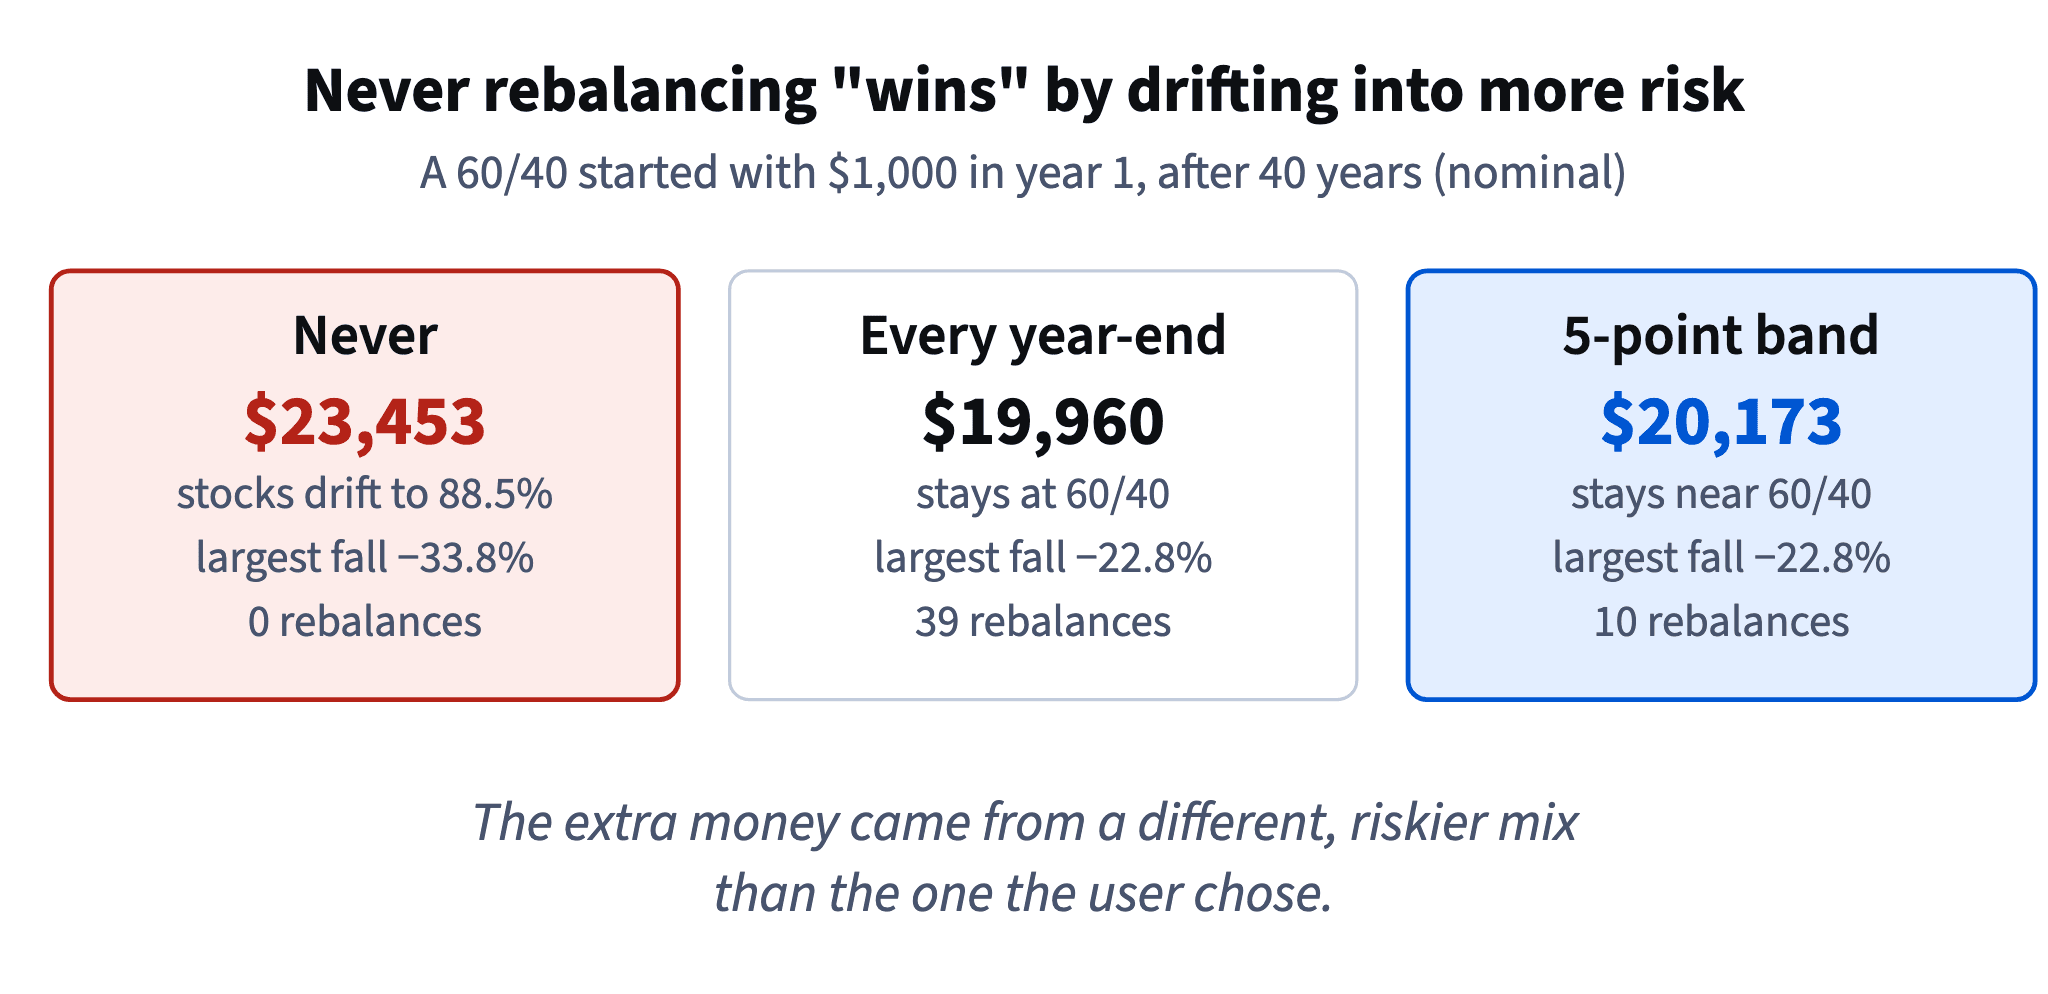
"Strategy A made more money than strategy B" means little until you check whether they carried the same risk. In the Tessaro test the never-rebalanced 60/40 ended with $23,453 ($6,698 in real terms), the yearly-rebalanced one with $19,960 ($5,700 real). The difference has a clear source: the never-rebalanced portfolio held 80–90% stocks for most of its life, and its largest fall was −33.8% instead of −22.8%.
If the user had wanted 80% stocks, they could have chosen that mix on day one and known its risk in advance. Drift gives them that risk without asking, usually at the moment it hurts most: just before a crash, after years of rising stocks.
For a product that promised a 60/40, rebalancing isn't optional tuning; it is part of delivering the product described on the screen.
- Do“Never rebalancing ended higher, but it was a 90/10 by then, with a −33.8% fall.”
- Don't“Never rebalancing earns the most, so it's the smart default.”
Calendar or band: two ways to rebalance
There are two common rebalancing rules. A calendar rule resets the mix at fixed dates, for example every year-end. A band rule acts only when a part drifts outside a band around its target, for example when stocks move more than 5 points away from 60%.
In the Tessaro test both kept the risk of a 60/40: the largest fall was −22.8% for each. The yearly rule traded 39 times in forty years; the 5-point band only 10 times, mostly after big moves such as the crash years 21–22. Fewer trades means fewer spreads and fewer sales that may be taxed. The final values were close: $19,960 and $20,173.
Dataset · 40 rows
A 60/40 started with 1,000 dollars: three rebalancing rules
Nominal, year-end. never = never rebalanced; yearly = back to 60/40 every year-end; band = back to 60/40 only when stocks are more than 5 points away from 60%. *_stocks_pct = stock weight at year-end before any rebalance; band_rebalanced = 1 if the band rule rebalanced that year. Synthetic data.
First 5 of 40 rows
Regular contributions can do part of the work for free: new money goes into whichever part is below target. For an app the point is that the rule runs automatically, so nobody has to decide to sell stocks after a great year or buy them in a crash.
Chart: Share of stocks in a 60/40: never rebalanced vs a 5-point band · shown above
- Do“Check once a year; rebalance only if stocks are more than 5 points off target.”
- Don't“Rebalance whenever it feels like the market has gone too far.”
That is a forecast, not a rule.
Ready to practise?
Answer the lesson's exercises and earn 250 points the first time you finish it.
Start the exercises