

Theory
Compounding with a monthly amount: time beats the rate
How a fixed monthly amount grows with compounding, why starting ten years earlier beats a higher rate, and what a three-year pause costs.
~7 min read · 7 exercises · 250 points
Before you start
The goal screen
Still February at Zapas, your first month as PM. Today's design review is the "goal + monthly amount" screen: a user types a goal and a monthly sum, and the app shows how the balance could grow.
Ethan wants a big slider for the return, so users can drag it up and see a huge number. You'll look at the levers a user really controls, when they start, how much they put in and whether they keep going, and find out which of them matters most.
Compounding with monthly payments
Compounding is growth on growth. If a balance earns 6% this year, next year it earns 6% on the bigger balance, and so on. Over a few years the effect is small; over decades it dominates.
With a monthly amount, each payment compounds for a different time. A dollar paid at 25 grows for 40 years, a dollar paid at 64 for one. That's why the first decade does so much work.
The future value formula adds up all those snowballs: FV = P × ((1 + m)^n − 1) ÷ m, where m is the monthly rate, (1 + a)^(1/12) − 1 for a yearly rate a. For 100 dol. a month at 6% for 480 months it gives 190,768, of which only 48,000 was paid in.
Use a real rate to get the answer in today's money, and remember the steady rate is a teaching device: markets don't pay 6% every year.
Chart data
| Age | Start at 25 | Start at 25, pause at 40–42 | Start at 35 | Paid in from 25 |
|---|---|---|---|---|
| 25 | 0 | 0 | 0 | 0 |
| 30 | 6,949 | 6,949 | 0 | 6,000 |
| 35 | 16,247 | 16,247 | 0 | 12,000 |
| 40 | 28,691 | 28,691 | 6,949 | 18,000 |
| 45 | 45,344 | 40,935 | 16,247 | 24,000 |
Show 4 more rows
| 50 | 67,629 | 61,728 | 28,691 | 30,000 |
| 55 | 97,451 | 89,555 | 45,344 | 36,000 |
| 60 | 137,360 | 126,793 | 67,629 | 42,000 |
| 65 | 190,768 | 176,627 | 97,451 | 48,000 |
- Do"At an assumed 6% real, 100 dol. a month for 40 years could reach about 190,000 in today's dollars."
- Don't"You'll have 190,768 at 65."
An exact promise from a steady-rate model.
The cost of waiting
Starting later doesn't just remove the payments you skip; it removes the years those payments, and everything after them, would have grown.
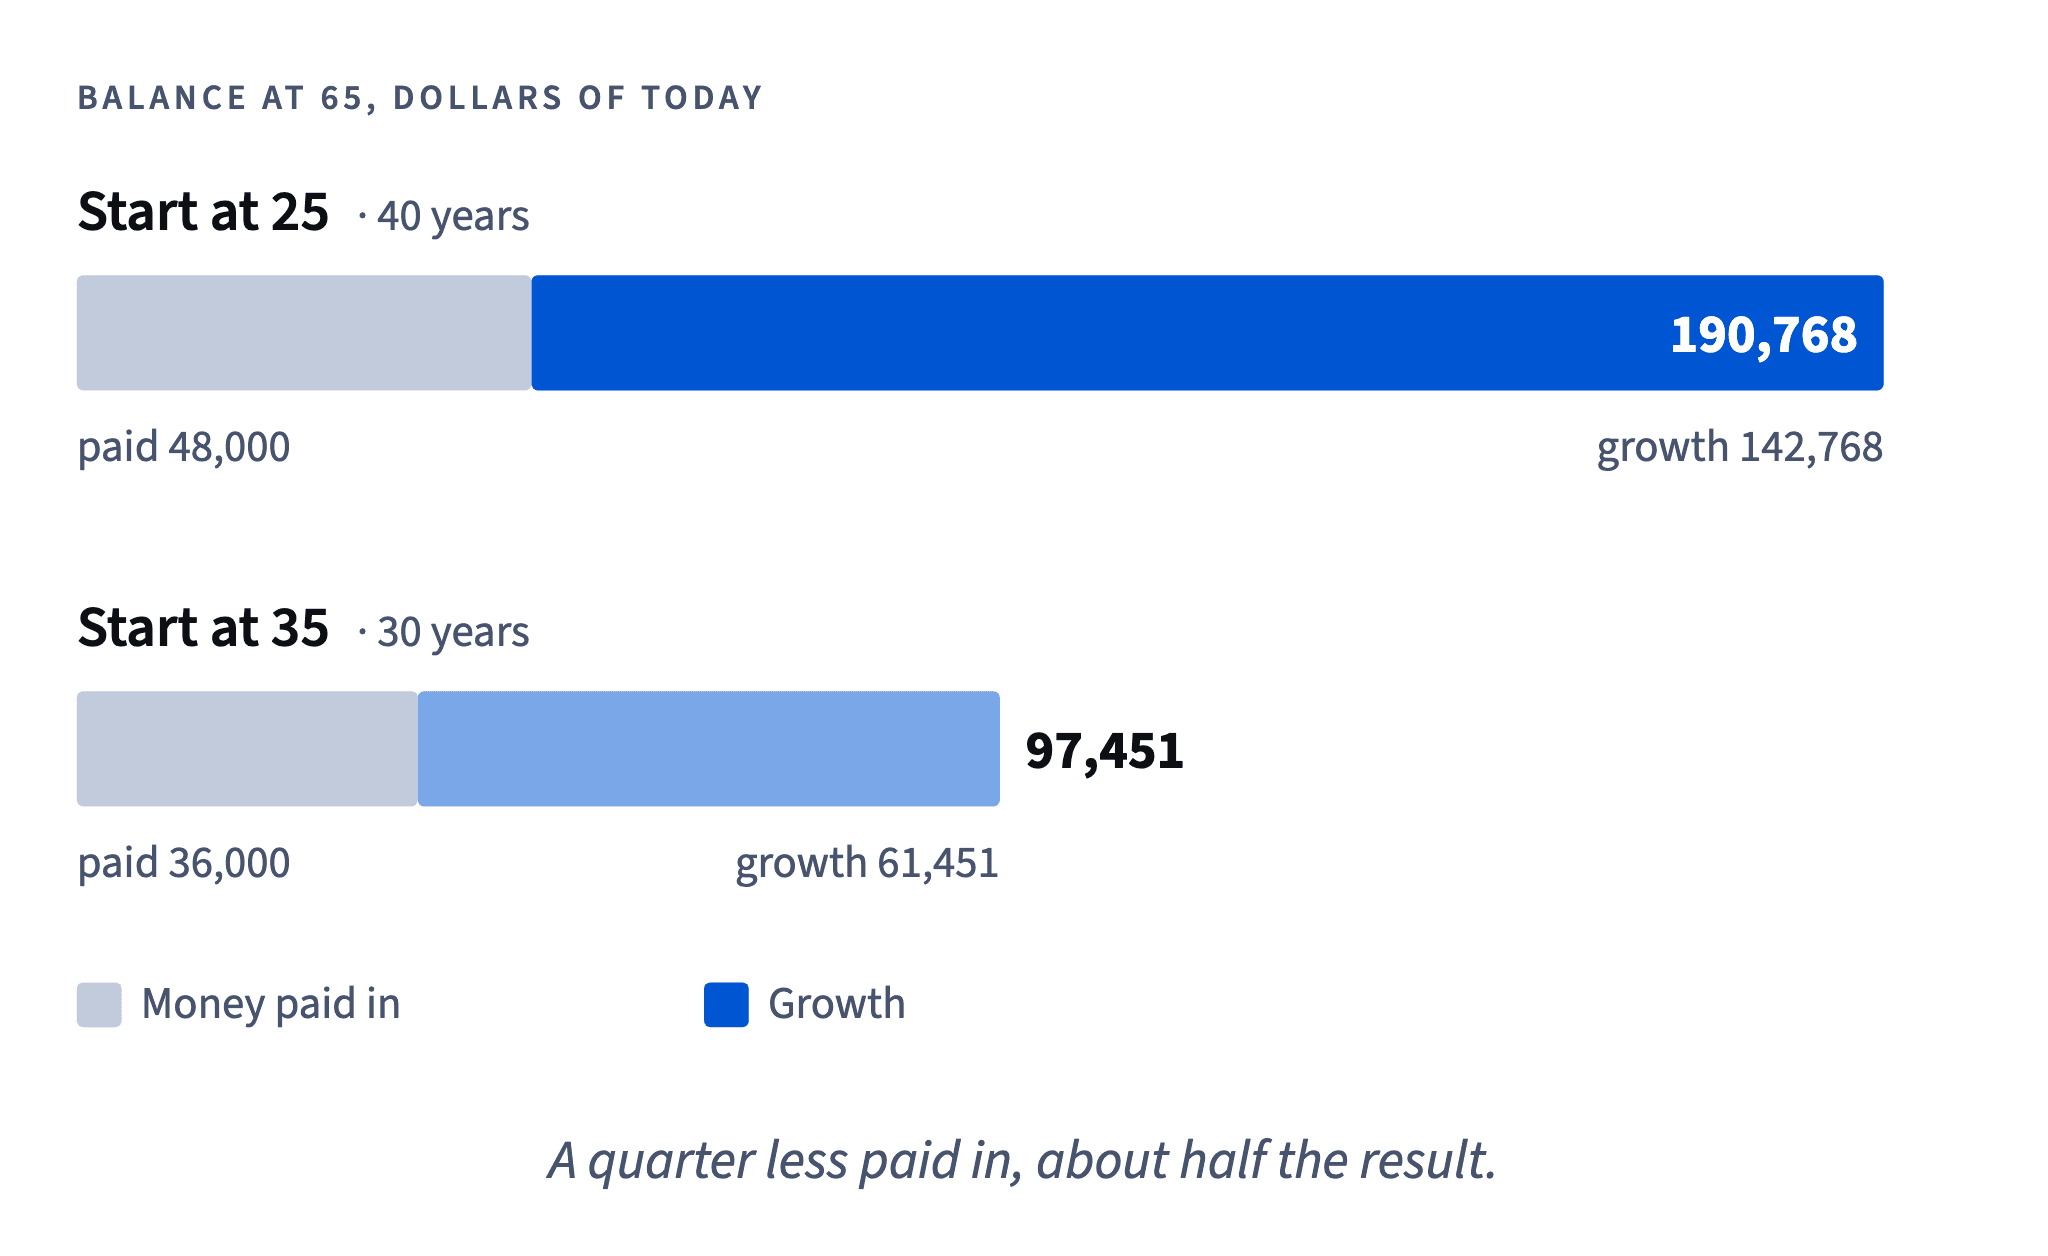
Compare two plans of 100 dol. a month at 6% real, both stopping at 65. From 25: 480 payments, 48,000 paid in, 190,768 at the end. From 35: 360 payments, 36,000 paid in, 97,451 at the end. Paying 25% less leads to about 49% less (97,451 ÷ 190,768 = 0.51).
The gap, about 93,316, is far bigger than the 12,000 not paid. Those skipped early dollars would have compounded for 30–40 years.
For a product this has a practical meaning: removing friction for the first deposit matters more than an extra feature for year ten. And for anyone starting late, the fix is more years or a larger amount, not a bolder rate.
- Do"Starting ten years earlier roughly doubles the result at the same amount."
- Don't"I'll start when I earn more; a few years don't matter."
The early years compound the longest.
Time is the lever you control
A future-value calculation has four inputs: the monthly amount, the rate, the number of years and whether payments keep coming. Only one of them is set by the market: the rate. The other three belong to the user.
Formula: Future value of P paid at the end of every month for n months at a yearly rate a · shown above
Doubling the years is stronger than it looks because the extra years sit at the end of a growing balance, where each year adds the most. In our example, doubling the rate from 4% to 8% for 20 years lifts 36,384 to 56,900; doubling the years at 4% lifts it to 116,106.
A product that lets users drag a return slider teaches them to focus on the number they can't control. A product that shows "start now" and "keep going" focuses them on what they can.
- DoA goal screen with sliders for monthly amount and years, and a fixed, labelled assumption for the rate.
- Don'tA return slider that goes up to 15%.
Invites users to pick a fantasy.
Pausing vs stopping
Life interrupts plans: a job loss, a baby, a move. What happens to the money in those years matters a lot.
A pause stops new payments but keeps the balance invested. In our example of 100 dol. a month at 6% real from age 25, three missed years at 40–42 cost 14,141 by 65 on 3,600 not paid. Real, but recoverable.
Selling to get through the gap is far worse: the whole balance stops compounding, and people who sell often buy back later at higher prices, or never. The cushion exists so that the investments don't have to be touched.
For an app, the lesson is a design choice: make "pause payments" easy and visible, and put a speed bump in front of "sell everything". A short reminder of what the pause costs, and of the date payments resume, keeps the plan alive.
- Do"Lost income? Pause your monthly amount; your balance stays invested."
- Don'tA single "Withdraw all" button on the home screen.
Reading a balance chart
A good balance chart always shows the money paid in as its own line. Without it, users can't tell what they saved from what the market added, and the gap between the two is the whole point of compounding.
On our chart four lines sit together. The paid-in line rises straight: 1,200 dol. a year. The balance lines curve upwards because growth earns growth. The start-at-35 line is flat until 35 and never catches up. The pause line dips below the full line at 40–42 and stays a little below for good: the payments not made never grow.
Read the end values, then ask what made the difference: the years, the amount or the gaps. And always read the assumption: here a steady 6% real, which no market delivers year by year.
Chart: 100 dol. a month at 6% real a year · shown above
- DoShow "paid in" and "growth" separately on every balance chart.
Why results aren't proportional
Our intuition is linear: pay a quarter less, get a quarter less. Compounding breaks that. Each payment's final value depends on how long it grows, and growth is exponential in time.
A payment made at 25 at 6% real grows about 10.3 times by 65 (1.06^40). One made at 35 grows about 5.7 times (1.06^30). One made at 55 grows about 1.8 times. So the payments you skip at the start are the most valuable ones in the whole plan.
That's why starting at 35 instead of 25 cuts payments by 25% but the balance by about 49%. The same logic explains why a three-year pause late in the plan costs less than a three-year pause early on.
When a user asks "does it matter if I start next year?", the honest answer is "yes, more than the amount suggests".
- Do"Each dollar at 25 can grow about ten times by 65 at 6% real; a dollar at 55 under two times."
- Don't"Ten years late just means ten years of payments less."
Helper text that moves behavior
Helper text on a money screen has one job: help the user make the next good decision. Here that decision is "start now and keep going".
Three ingredients work well together. One concrete comparison the user can feel (start at 25 vs 35, about 190,000 vs about 97,000 at an assumed rate). One action for hard months (pause the amount, don't sell). One honest line about risk (an illustration, not a promise; markets fall).
Round the numbers ("about 190,000") so they read as illustrations, and name the assumption ("an assumed 6% after inflation"). Avoid "you will have" and avoid words like "guaranteed" or "safe".
Keep it short. Two or three sentences fit on a phone screen without scrolling.
- Do"At an assumed 6% after inflation, starting 10 years earlier could roughly double your balance."
- Don't"Invest today and you'll be a millionaire!"
Ready to practise?
Answer the lesson's exercises and earn 250 points the first time you finish it.
Start the exercises