

Theory
Case: "star manager picks" and a "hot theme" tab
Decide with fund and index data whether the app should add a star-manager tab and a hot-theme tab.
~5 min read · 7 exercises · 250 points
Before you start
Two tabs for launch
Last day of May at Zapas. The month's question, "can anyone beat the market?", now comes back as a product decision you own. Ethan wants two tabs for launch: "Star manager picks" with Star Growth on top, and "Hot theme" with the tech theme fund. Both have amazing numbers, all of them in the past.
You'll put both tabs through what this month taught you and write the decision down.
A hot theme: the chart is the sales pitch
A theme fund holds companies tied to one story, such as a technology, a trend or a sector. Themes become "hot" for a simple reason: they have just gone up a lot. A tab that sorts themes by recent return will therefore always show the one that already had its run.
The run doesn't have to look extreme to pull people in. Tessaro Tech Theme's four-year chart had a down year in it and still almost doubled; with year 34 it reached 2.56 times its level at the start of year 30. Then three bad years in a row took 55.3% off: 0.70 × 0.76 × 0.84 = 0.447.
Chart data
| End of year | Tessaro Tech Theme |
|---|---|
| 29 | 1,000 |
| 30 | 1,280 |
| 31 | 1,203 |
| 32 | 1,612 |
| 33 | 1,967 |
The problem is that the chart looks backward and the user buys forward. A concentrated theme carries company risk and story risk on top of market risk, and its price already contains the excitement. What a buyer gets depends on the years after the purchase, not the years on the chart.
- Do“0.70 × 0.76 × 0.84 = 0.447: down 55.3%.”
- Don't“30 + 24 + 16 = 70% down.”
Each loss hits what is left, so losses don't sum.
The buyer gets the years after the chart
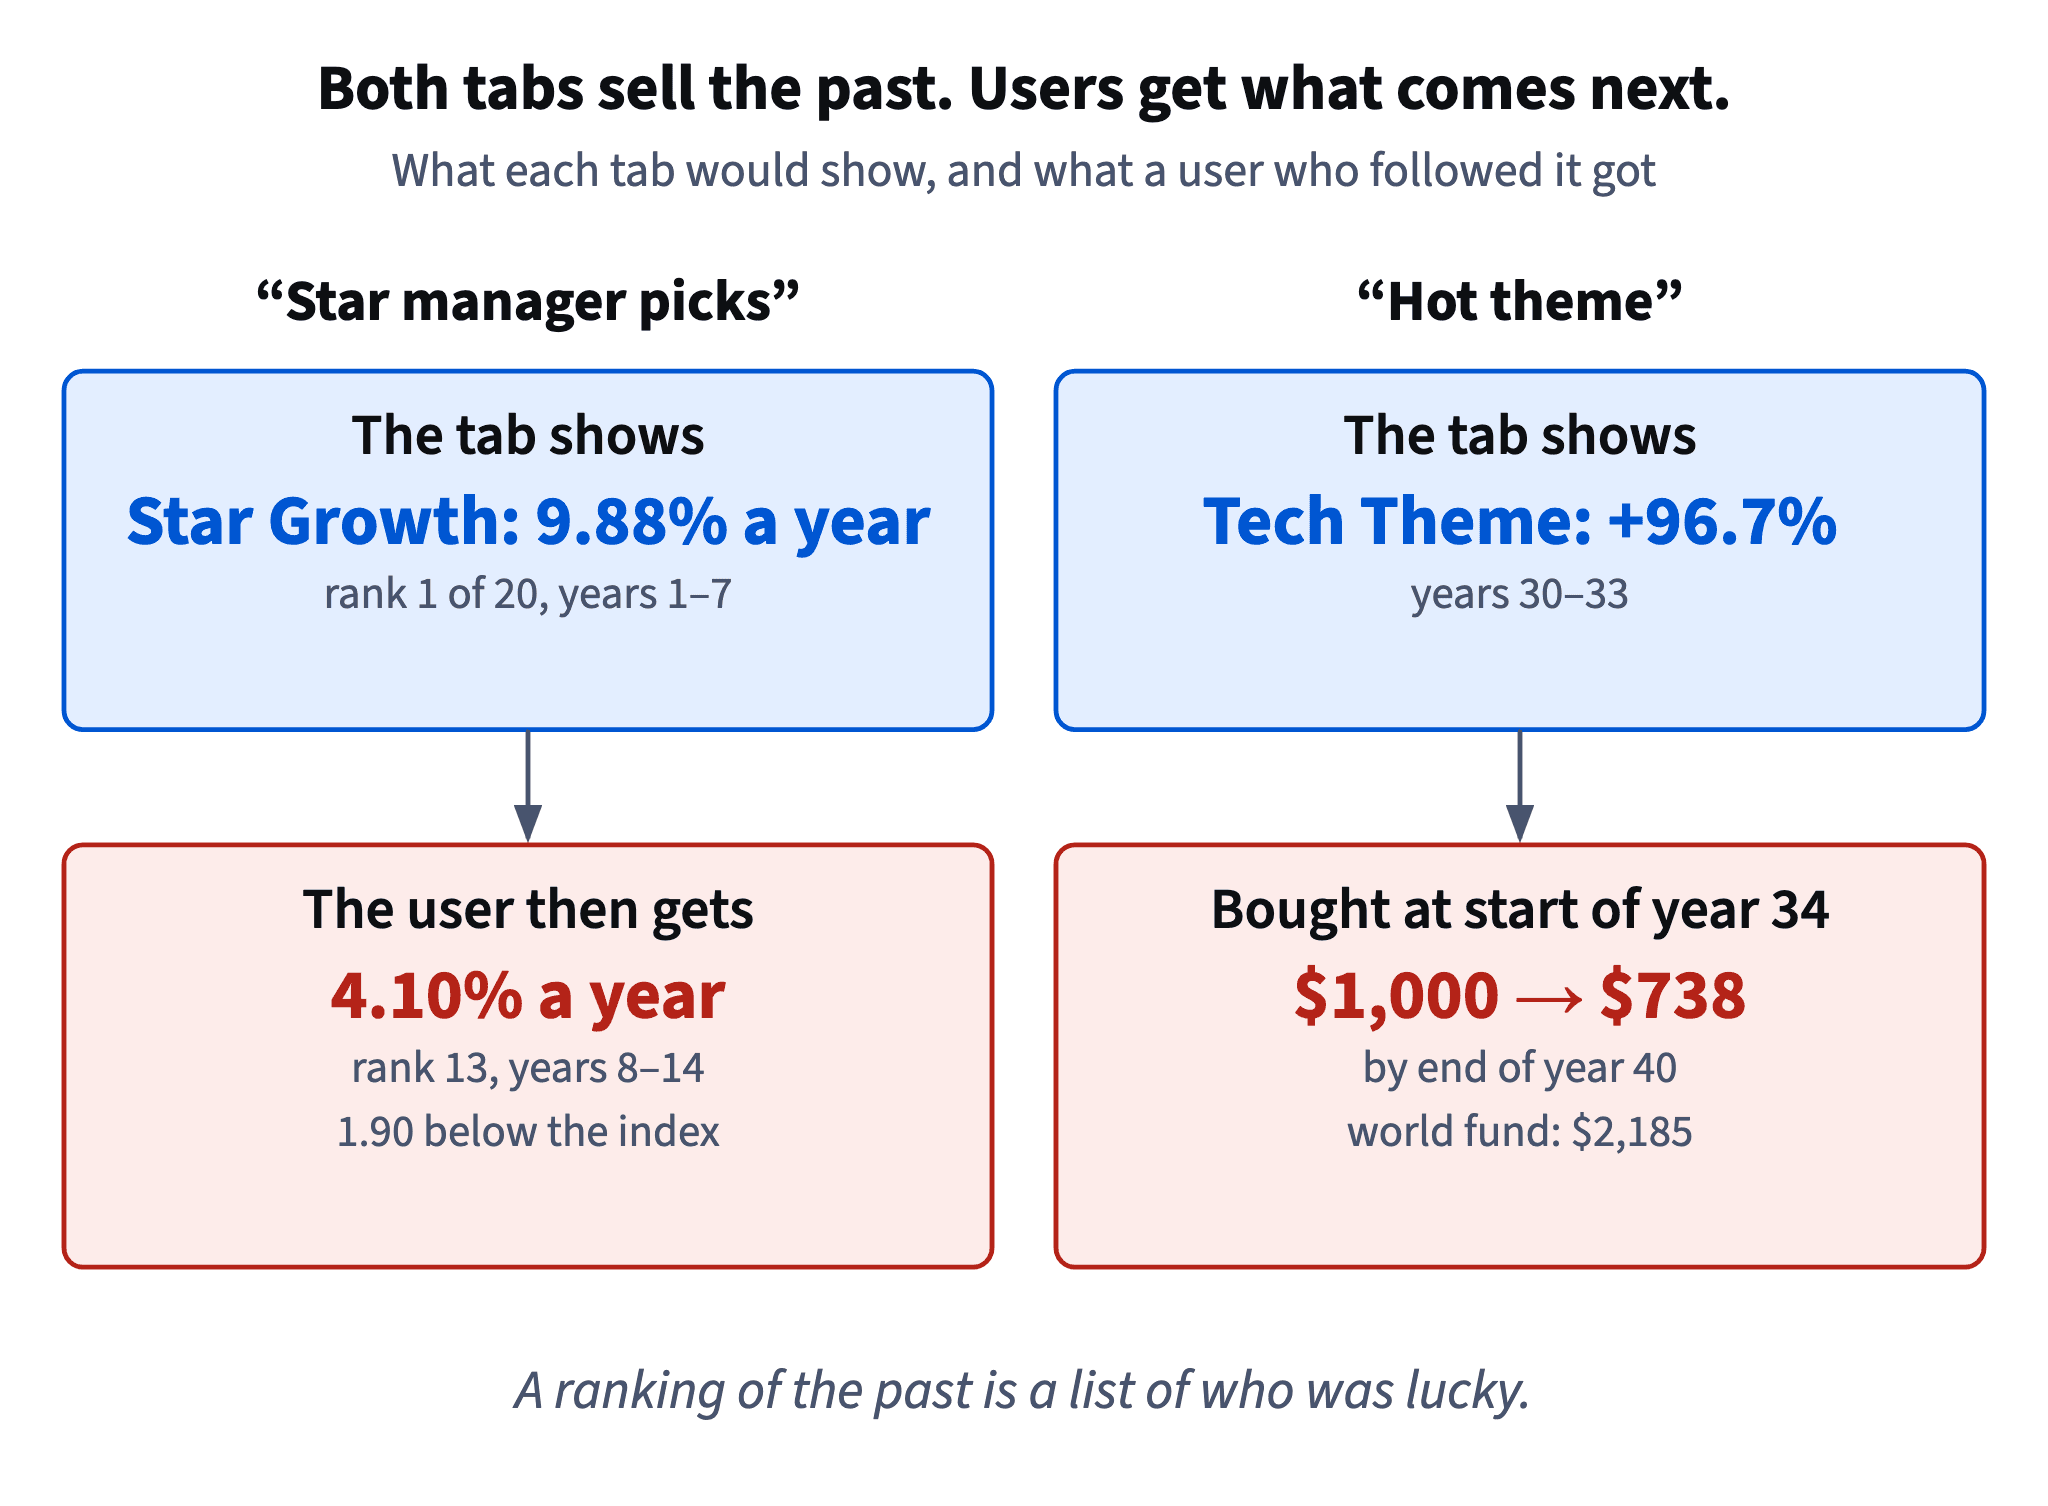
Ask of any "hot" product: what happened to the people who bought because it was hot? Take a user who saw years 30–33 on a "Hot theme" tab and bought at the start of year 34. Those four years were already over; none of their gains reached the account.
Chart: The "Hot theme" tab at the start of year 34: 1,000 dollars in Tessaro Tech Theme over years 30–33 · shown above
What reached the account was years 34–40. The $1,000 grew to $1,300 in the first year, dropped to $581 by the end of year 37 and recovered only to $738 by the end of year 40. The same $1,000 in the world fund, which also had a bad stretch, ended at $2,185.
Chart data
| End of year | Tessaro Tech Theme | Tessaro World |
|---|---|---|
| 33 | 1,000 | 1,000 |
| 34 | 1,300 | 1,140 |
| 35 | 910 | 1,094 |
| 36 | 692 | 897 |
| 37 | 581 | 951 |
Show 3 more rows
| 38 | 651 | 1,275 |
| 39 | 677 | 1,691 |
| 40 | 738 | 2,185 |
One good year after buying doesn't change the arithmetic: a 30% gain followed by a 55.3% fall leaves 1.30 × 0.447 = 0.58 of the money. A tab that ranks themes by recent return points users at a chart they can't own and hands them the years that follow it.
- Do“Show what a buyer after the chart actually got: $738 from $1,000.”
- Don't“+96.7% in four years: join the trend.”
Sells the past to people who will only get the future.
A star tab is a past ranking with a promise attached
"Star manager picks" sounds like expertise, but in practice it is a sort by past return. The question is whether that sort helps the next buyer.
The fund data answer it directly. Of the five best funds of years 1–7, none stayed in the top five in years 8–14, none beat the index fund, and one closed in year 9. Star Growth itself went from 9.88% (rank 1) to 4.10% (rank 13), 1.90 points below the index. The average active fund trailed the index after costs in both periods, as the arithmetic of the average investor says it must.
Dataset · 21 rows
20 fictional active funds and the index fund, real returns a year (synthetic)
p1_return_pct: years 1–7; p2_return_pct: years 8–14 or until the fund closed (status closed, closed_year). IDX is the Tessaro World index fund after its 0.2% costs; fee_pct is each active fund's yearly fee.
First 5 of 21 rows
There is also no way to rescue the tab with a better filter. Telling a 1-point edge from luck with a 6-point tracking error takes about 144 years of data. A seven-year star is, as far as anyone can show, a lucky fund with a high fee.
- Do“Rank 1 in years 1–7, rank 13 in years 8–14.”
- Don't“Our experts pick the managers who beat the market.”
No one can identify them in advance from returns.
Labels that don't rank by the past
A product can offer something risky and still be honest about it. The difference is in the label. "Trending", "top performer" and "hot" all sort by recent return, which steers users into whatever has just gone up most, the moment when expected disappointment is highest.
An honest label says what the thing is (a concentrated bet on one sector, an active fund with a 1.60% fee), shows the bad part of the record next to the good one (the theme rose 2.56× and then fell 55.3%) and says where it sits relative to the plan (outside the model portfolios, a small part at most).
Chart: 1,000 dollars bought at the start of year 34: theme vs world · shown above
This is not about hiding information. It's about not turning a past chart into a recommendation. A good test: would the card still read the same if the last four years had been bad? If not, it is selling the chart.
- Do“Concentrated bet on one sector; its history includes a 55% fall.”
- Don't“Top performer this year.”
A sort by recent return, presented as a recommendation.
Build the case from what holds
A product decision memo is strongest when every claim in it would survive a sceptical reader. For the star tab, four facts hold up:
- persistence: the period-1 winners scattered and averaged 3.96% in period 2 against the index's 6.00%;
- noise: a 1-point edge needs about 144 years of data to stand out, so seven years can't tell skill from luck;
- costs: a 1.60% fee is charged every year and is the one part of the result known in advance;
- survivorship: lists of today's funds look 0.93 points better than the full group was.
Dataset: 20 fictional active funds and the index fund, real returns a year (synthetic) · shown above
Avoid overclaiming, such as "active funds never win". It's false (seven beat the index in period 1), and one counterexample lets the other side dismiss the whole memo. The honest claim is narrower and stronger: nobody can pick the winners in advance, and the average one costs more.
- Do“None of the top five repeated, and the fee is certain.”
- Don't“Active funds always lose.”
One counterexample sinks the memo.
Ready to practise?
Answer the lesson's exercises and earn 250 points the first time you finish it.
Start the exercises