

Theory
Case: three model portfolios and the onboarding questions
Design three model portfolios and the three questions that place a new user in one of them.
~5 min read · 7 exercises · 250 points
Before you start
The portfolio review
Late August at Zapas, less than three months before the public launch. Today the model portfolios go to review: three mixes, the onboarding questions and the rules behind them.
Ethan's draft is simple: Careful is all bonds and called "safe", Growth is all stocks and the default for anyone under 35, Balanced sits in between. You'll test it against the forty-year table from July and turn it into three portfolios and questions you can defend.
A careful portfolio balances two risks
"Careful" doesn't mean the smallest possible fall. It means the least total risk for the goal, and a long goal has two risks: falling in a bad stretch and growing too little to get there.
In the Tessaro table the all-bond 0/100 had the smallest fall, −22.8%, but it peaked in year 34, lost value through the inflation years and was still below that peak at the end of year 40. Its real return was 1.7% a year: $1,000 became $1,932. A 40/60 fell somewhat more, −27.6%, was back above its peak 6 years after it, and turned $1,000 into $4,110.
Dataset · 6 rows
Model mixes over 40 synthetic years, real terms
Stocks = Tessaro World; bonds = half Tessaro Short Bonds, half Tessaro Long Bonds; rebalanced every year-end. geo_real_pct = real return a year; worst_real_year_pct and worst_year; max_drawdown_real_pct from peak year to trough year; years_underwater from the peak until back above it (not_by_40 = still below at the end of year 40); real_value_of_1000 after 40 years. Synthetic data.
First 5 of 6 rows
So a careful portfolio for goals five or more years away usually holds some stocks. Money needed within a year or two shouldn't be in an investment portfolio at all; it belongs in cash, deposits or very short bonds.
Chart data
| Stocks/bonds, % | Real value of 1,000 |
|---|---|
| 0/100, all bonds | 1,932 |
| 20/80 | 2,865 |
| 40/60 | 4,110 |
| 60/40 | 5,700 |
| 80/20 | 7,638 |
Show 1 more row
| 100/0, all stocks | 9,875 |
Chart data
| Stocks/bonds, % | Worst year | Largest fall |
|---|---|---|
| 0/100, all bonds | -12.7 | -22.8 |
| 20/80 | -15.1 | -25.2 |
| 40/60 | -17.6 | -27.6 |
| 60/40 | -20 | -30 |
| 80/20 | -24.3 | -38 |
Show 1 more row
| 100/0, all stocks | -31.8 | -48.2 |
- Do“Careful: fewer stocks, falls of about a quarter at worst, for goals 5+ years away.”
- Don't“Careful = all bonds = safe.”
The last step up in stocks costs the most
Moving from one mix to the next doesn't change risk evenly. In the Tessaro table each step of 20 points in stocks adds about 0.7–0.9 points of real return a year, but the falls grow faster at the top: −30.0% for 60/40, −38.0% for 80/20 and −48.2% for 100/0, with 6, 8 and 11 years under water.
Dataset: Model mixes over 40 synthetic years, real terms · shown above
The last step, from 80/20 to 100/0, added $2,237 per $1,000 over forty years in real terms. To collect it, a user had to watch half of the money disappear and wait 11 years to be back. Someone who sold at the bottom of that fall would have done far worse than an 80/20 held calmly.
That is why a growth portfolio is often set a little below 100% stocks, and all-stocks is offered as a choice the user makes knowingly, not a default.
Chart: Worst real year and largest real fall, by mix · shown above
- Do“Growth: 80/20 by default; 100/0 only if you choose it after seeing −48.2%.”
- Don't“Under 35? You get 100% stocks.”
Three questions, two limits
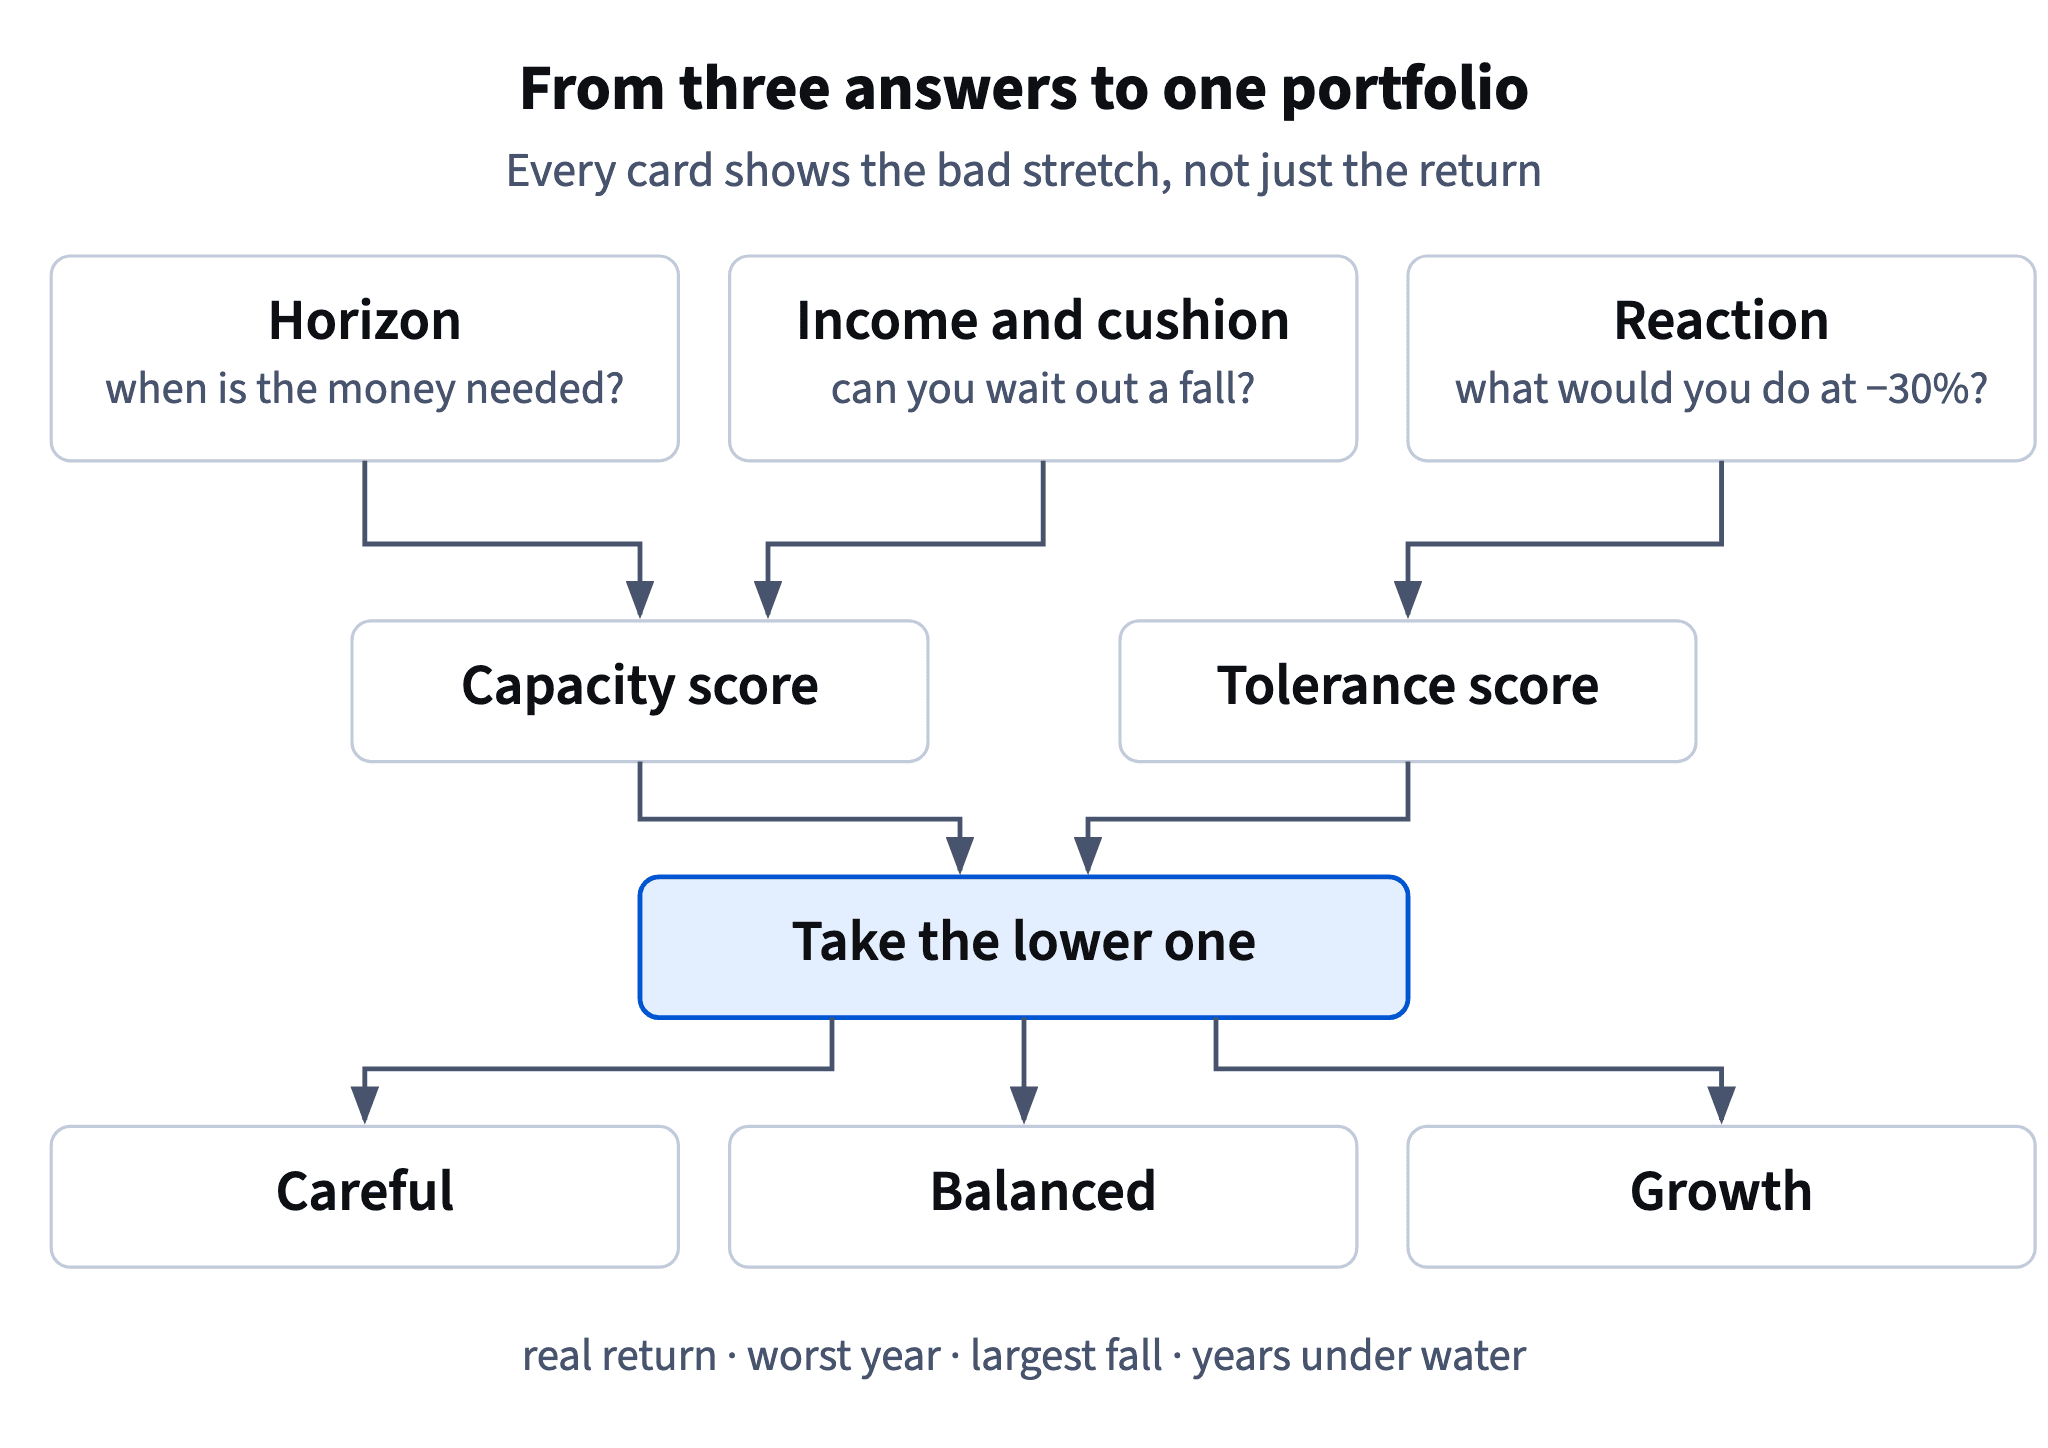
Onboarding has to be short, so every question must earn its place. Three can cover both limits:
- Horizon: when will the money be needed? Under about two years, the money shouldn't go into an investment portfolio at all. Longer horizons allow more stocks.
- Income and cushion: is the income steady, and are there savings for several months? Irregular income or no cushion lowers capacity by a step, because a bad month could force a sale.
- Reaction: "If your $10,000 showed $7,000, what would you do: sell, wait, or add more?" Concrete money works better than "how risky are you?"
Score capacity from the first two and tolerance from the third, then use the lower one. Show the user why: "Your horizon allows Growth, but you said you'd sell at −30%, so we suggest Balanced. You can change it."
- Do“If your $10,000 showed $7,000, what would you do?”
- Don't“Rate your appetite for risk from 1 to 10.”
No anchor in money, and people overrate their calm in rising markets.
Each card has its own worst story
Different mixes get hurt by different events, and an honest card shows the one that hit it hardest.
In the Tessaro table every mix with 60% stocks or less had its worst real year in year 36, when inflation reached 9.1% and stocks and bonds fell together: −17.6% for 40/60 and −20.0% for 60/40. Mixes with more stocks were hurt most by the crash in year 22: −24.3% for 80/20 and −31.8% for 100/0.
Dataset: Model mixes over 40 synthetic years, real terms · shown above
This matters for the copy. A Careful card that only says "bonds protect you in a crash" is true about year 22 and silent about year 36, which was its real worst case. A Growth card should name the crash. Users trust a product more when the bad year they live through was already on the screen. So each card names its own event, not a generic "markets can be volatile".
Chart: Worst real year and largest real fall, by mix · shown above
- Do“Worst real year in our data: −20.0%, a year when stocks and bonds fell together.”
- Don't“Balanced: bonds cushion every fall.”
What a portfolio card owes the user
A model-portfolio card is the moment a user agrees to a risk, so it must show that risk as clearly as the reward. Four numbers, the same on every card, make the cards comparable:
- real return a year in the data, marked as history, never as a forecast;
- worst real year;
- largest fall from a peak;
- years under water until the old peak was regained.
Add a line on how the portfolio is run (bond part, rebalancing rule, where new money goes) and why it was suggested to this user. Leave out words that promise: "best", "safe", "guaranteed", or a single expected percent a year. For Balanced (60/40) the Tessaro data gives: 4.4% a year real, worst year −20.0%, largest fall −30.0%, 6 years under water. The same format lets users compare cards at a glance.
- Do“Balanced, 60/40. Synthetic history: 4.4% a year real; worst year −20.0%; largest fall −30.0%; 6 years under water.”
- Don't“Balanced: the best of both worlds, about 5% a year.”
Ready to practise?
Answer the lesson's exercises and earn 250 points the first time you finish it.
Start the exercises