

Theory
Bonds: yield, rate risk and the year both fell
What a bond is, why its price moves with interest rates, short vs long bonds, and a year when stocks and bonds fell together.
~7 min read · 7 exercises · 250 points
Before you start
Is the safe part safe?
July 2027 at Zapas. June settled the fund line-up and its real costs; now, four months before the launch, you start building the model portfolios, beginning with the part users think of as safe.
Ethan wants to call the bond-heavy Careful portfolio "safe" on the screen, because bonds can't lose. You'll see what a bond is, where its risk hides along the way, and what happened in the year when stocks and bonds fell together.
Duration: how hard rates hit a bond
A bond is a loan with fixed payments: a coupon every year and the face value back at the end. Its yield is the return you lock in if you buy it at today's price and hold it to the end.
Bonds already issued must compete with new ones. When market yields rise, an old bond with a lower coupon is worth less, so its price falls until its yield matches. When yields fall, its price rises.
Duration measures how sensitive the price is: roughly the average number of years until the bond's payments come back to you. A handy estimate: price change ≈ −duration × change in yield. With duration 2, a 2-point rise costs about 4%; with duration 15, about 30%.
So "bonds can't lose" is true only for someone who holds one bond to the end and never needs to sell. A bond fund keeps rolling into new bonds, so its price moves every day.
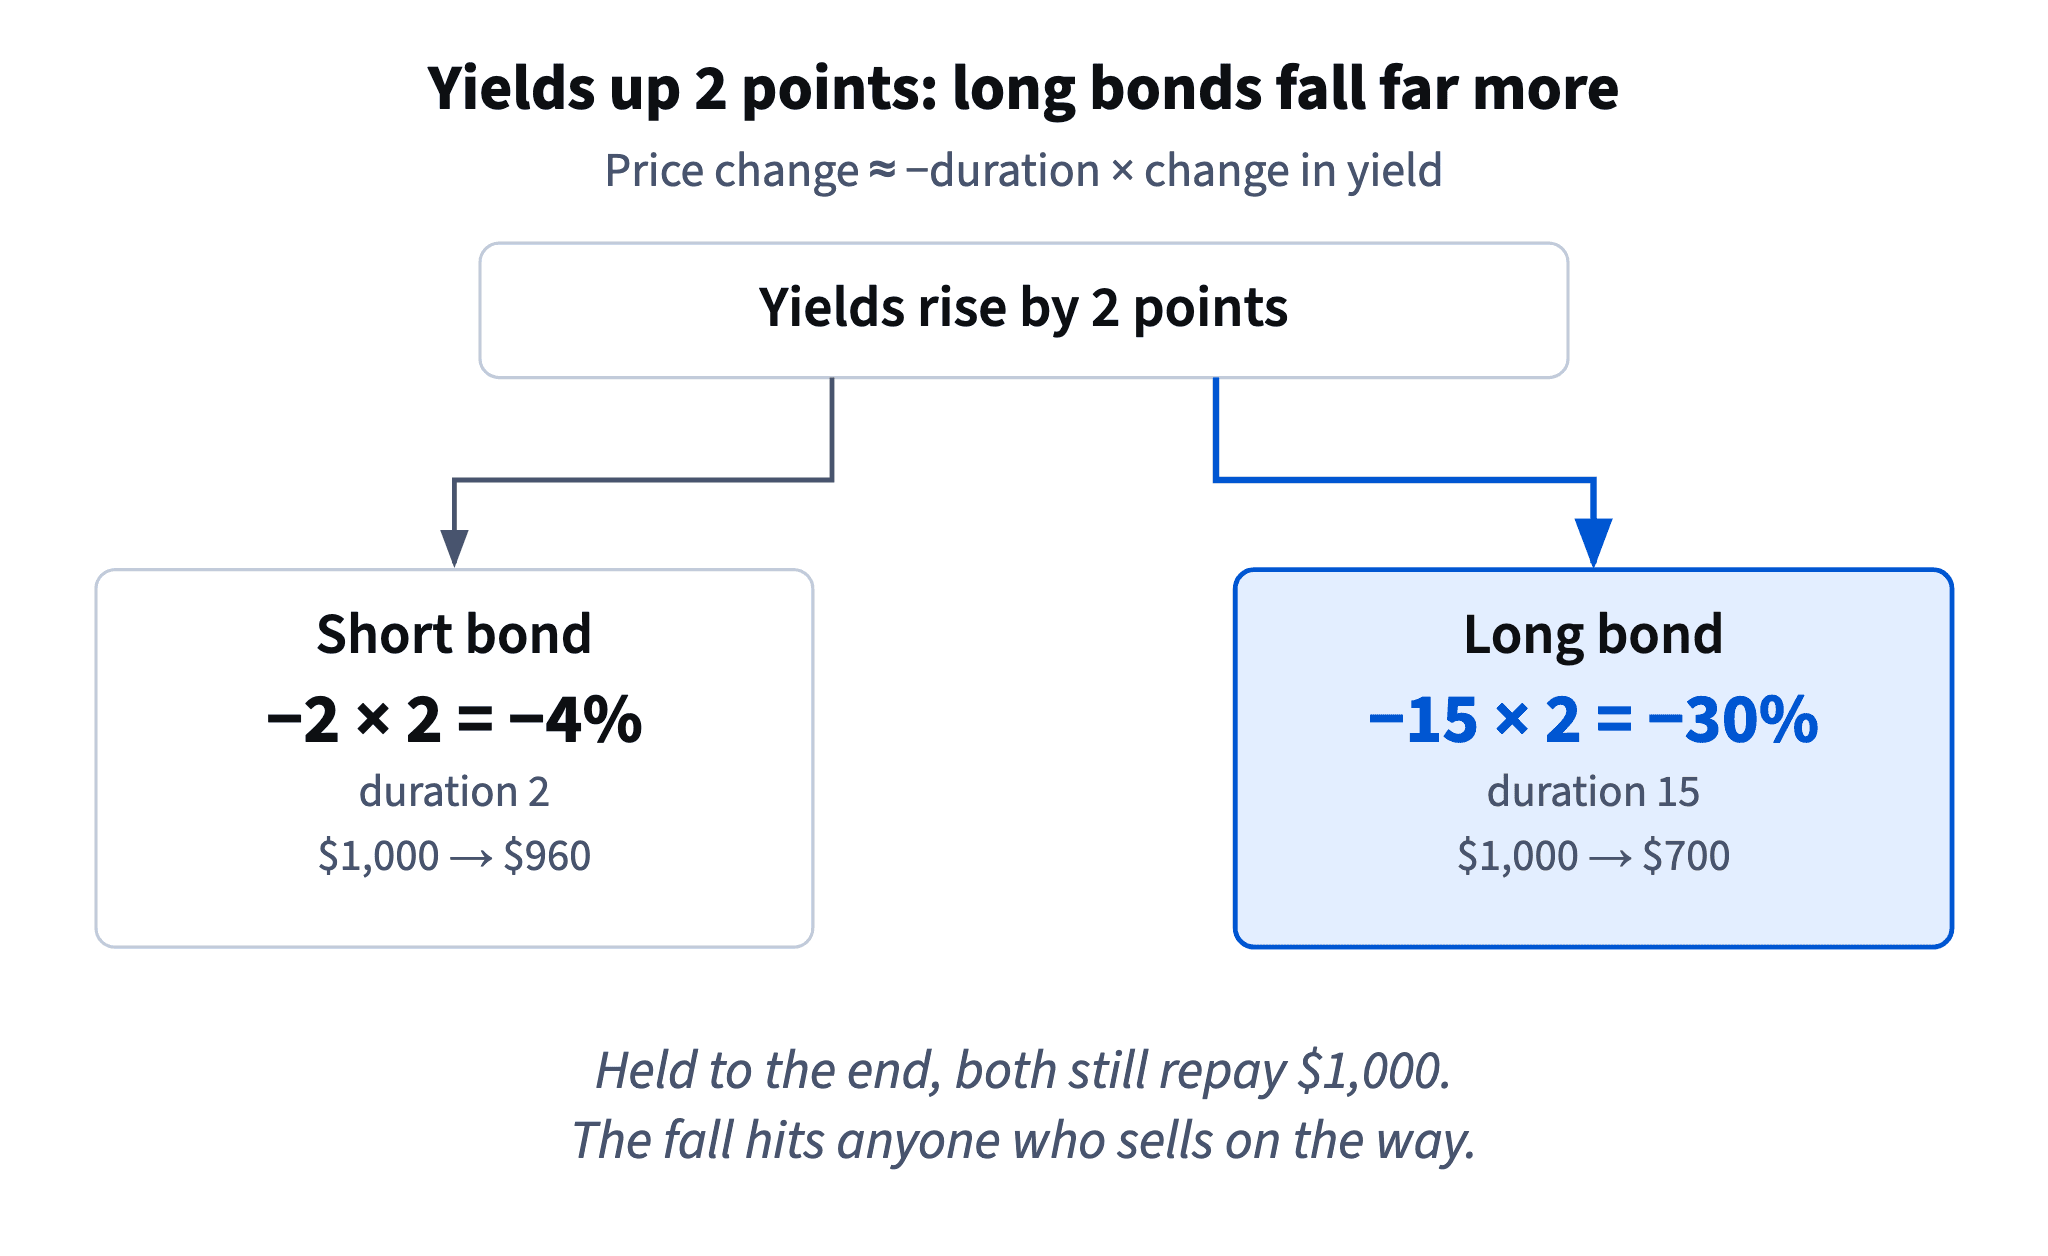
- Do“Duration 15, yields +2 points: expect roughly −30% on the price.”
- Don't“It's a bond fund, so the price can't go down.”
Bond prices move with rates; long ones move a lot.
A bond's yearly return: coupon plus price change
In any one year a bond (or a bond fund) earns two things: the coupon it pays and the change in its price. Add them and you get roughly the year's return.
In a calm year the price barely moves and the return is close to the yield. When yields jump, the price change dominates: a long bond paying 4% that loses 30% on price returns about 4 − 30 = −26%. When yields fall, it works the other way: the same bond gains about 15% on price for a 1-point drop, on top of its coupon.
There is a silver lining. After yields rise, the fund buys new bonds that pay more, so future returns are higher. Someone who holds for longer than the duration usually earns back the fall. Someone who must sell soon does not.
That is why the bond part of a portfolio should be chosen by when the money is needed, not by the word "bond".
- Do“4% coupon, −30% price: about −26% for the year.”
- Don't“It yields 4%, so I'll get 4% this year.”
The yield is locked in only if you hold to the end.
Short vs long bonds: same idea, different swings
Short and long bonds are both loans, but they behave very differently.
Short bonds (repaid within a few years, duration around 2) barely notice rate changes: a 2-point rise costs about 4%. In our synthetic Tessaro history short bonds never had a losing year (worst +2.9%) and swung little, with a standard deviation of 1.0%. The price of that calm is a low return: about 1.4% a year after inflation.
Long bonds (duration around 15) swing like a stock: ±15% for a 1-point move in yields. In the same history they lost money in 9 of 40 years, their worst year was −16.0% and their standard deviation 6.9%. They earned a bit more, 1.8% a year after inflation.
The move is symmetric: when yields fall, long bonds jump. That is what makes them useful in some crashes, and painful when rates rise.
Chart data
| Change in yield, points | Short bond | Long bond |
|---|---|---|
| Yield +1 point | -2 | -15 |
| Yield +2 points | -4 | -30 |
| Yield −1 point | 2 | 15 |
- Do“Short bonds for money needed in two years; long bonds only for long horizons.”
- Don't“Long bonds pay more, so they're the better safe part.”
Their price can fall 16% in a year.
Match the bond to the date
The simplest way to choose a bond fund is to compare its duration with when the money is needed.
If the money is needed in about two years, a short bond fund keeps the worst case small: even a sharp rise in yields costs a few percent, and as its bonds mature the fund reinvests at the new, higher yields. A long bond fund could lose a third of its value just before the date, with no time to recover.
If the money is needed in twenty years, a long bond's swings matter less, and its tendency to rise when yields fall can soften a stock crash, as it did in years 21–22 of the Tessaro history.
For short goals there are also government bonds held directly and insured deposits; the personal-finance course covers them in Deposits and government bonds. Whatever you choose, write the date next to the money first.
Picture: The longer the bond, the harder rate moves hit its price. · shown above
- Do“Money for 2 years: duration around 2 or less.”
- Don't“It's bonds, so any bond fund is fine for next year's goal.”
When stocks and bonds fall together
Bonds are often described as the part that rises when stocks fall. Sometimes they do. In the Tessaro crash of years 21–22, world stocks fell 45.4% in total, while long bonds gained 26.5% and short bonds 10.2%: falling rates lifted bond prices exactly when they were needed.
But the link is not a law. In year 36 inflation jumped to 9.1% and interest rates rose. Rising rates push bond prices down and also hurt shares. World stocks lost 18.0% and long bonds 16.0% in the same year; after inflation, −24.8% and −23.0%. A 60/40 mix built with long bonds fell 17.2%; with an even blend of short and long bonds, 12.7%.
The lesson for a portfolio: bonds lower the swings of a stock portfolio on average, not in every year. Short bonds protect best against rising rates; long bonds protect best in a crash with falling rates. Neither protects against everything.
Chart data
| Year | World stocks | Long bonds | Short bonds |
|---|---|---|---|
| Year 21, crash | -22 | 14 | 3.9 |
| Year 22, crash | -30 | 11 | 6.1 |
| Year 36, inflation 9.1% | -18 | -16 | 6.5 |
- Do“Bonds usually soften a stock fall; in a high-inflation year they can fall too.”
- Don't“Bonds always go up when stocks go down.”
Risk for bonds: worst year, not the label
A portfolio screen should describe the bond part the same way as the stock part: by its worst year, its largest fall and how long it took to recover, not by a word like "safe".
In the Tessaro history long bonds had a worst year of −16.0% and short bonds +2.9%. After inflation, year 36 cost long bonds 23.0% and short bonds 2.4%. A user who reads "safe" and then sees −16% feels misled and is more likely to sell at the bottom.
Chart: Tessaro market in three bad years (synthetic) · shown above
The fix is honest labelling: name what the part is for (steadier value, money for the next few years, a buffer for a stock crash), give the worst real year in the data, and say that some years both stocks and bonds fall. Real returns matter most here, because inflation is exactly what hurts bonds. A clear number up front is easier to live with than a surprise later.
- Do“Steadier, not risk-free: in our data's worst bond year, a 60/40 mix fell 12.7%.”
- Don't“Careful portfolio: 100% safe.”
Ready to practise?
Answer the lesson's exercises and earn 250 points the first time you finish it.
Start the exercises