

Theory
The behavior gap: fund return vs user return
Why the average user earns less than the fund they hold, and who sold at the bottom.
~8 min read · 8 exercises · 250 points
Before you start
One fund, two numbers
September at Zapas: the public launch is two months away, and the closed beta has just finished its first full year. Ethan wants a number for the launch page: the world fund made 8.7% this year, after a 22% fall in the spring, so "Our users earned 8.7%".
Grace's data says the beta users earned less on the very same fund. This month is about behavior. Today you'll see why a fund's return and its users' return differ, and how to measure the gap.
Two returns from the same fund
A fund and the people in it can have different returns in the same year, and both numbers are honest.
The time-weighted return measures the fund itself. Chain the monthly returns together and ignore when anyone added or took out money. Zapas World Stock: +3, +2, −4, −9, −8, −3, then six rising months, +8.7% for the year.
The money-weighted return measures one person's money. Every deposit counts for as long as it was invested; money that was in cash during a rise earns nothing. Average it over the 200 users who've been in Zapas's beta all year and you get +6.0%.
The difference between the two, 2.7 points, is the behavior gap: what timing decisions cost the people who own the fund. The fund didn't change; when people put money in and took it out did.
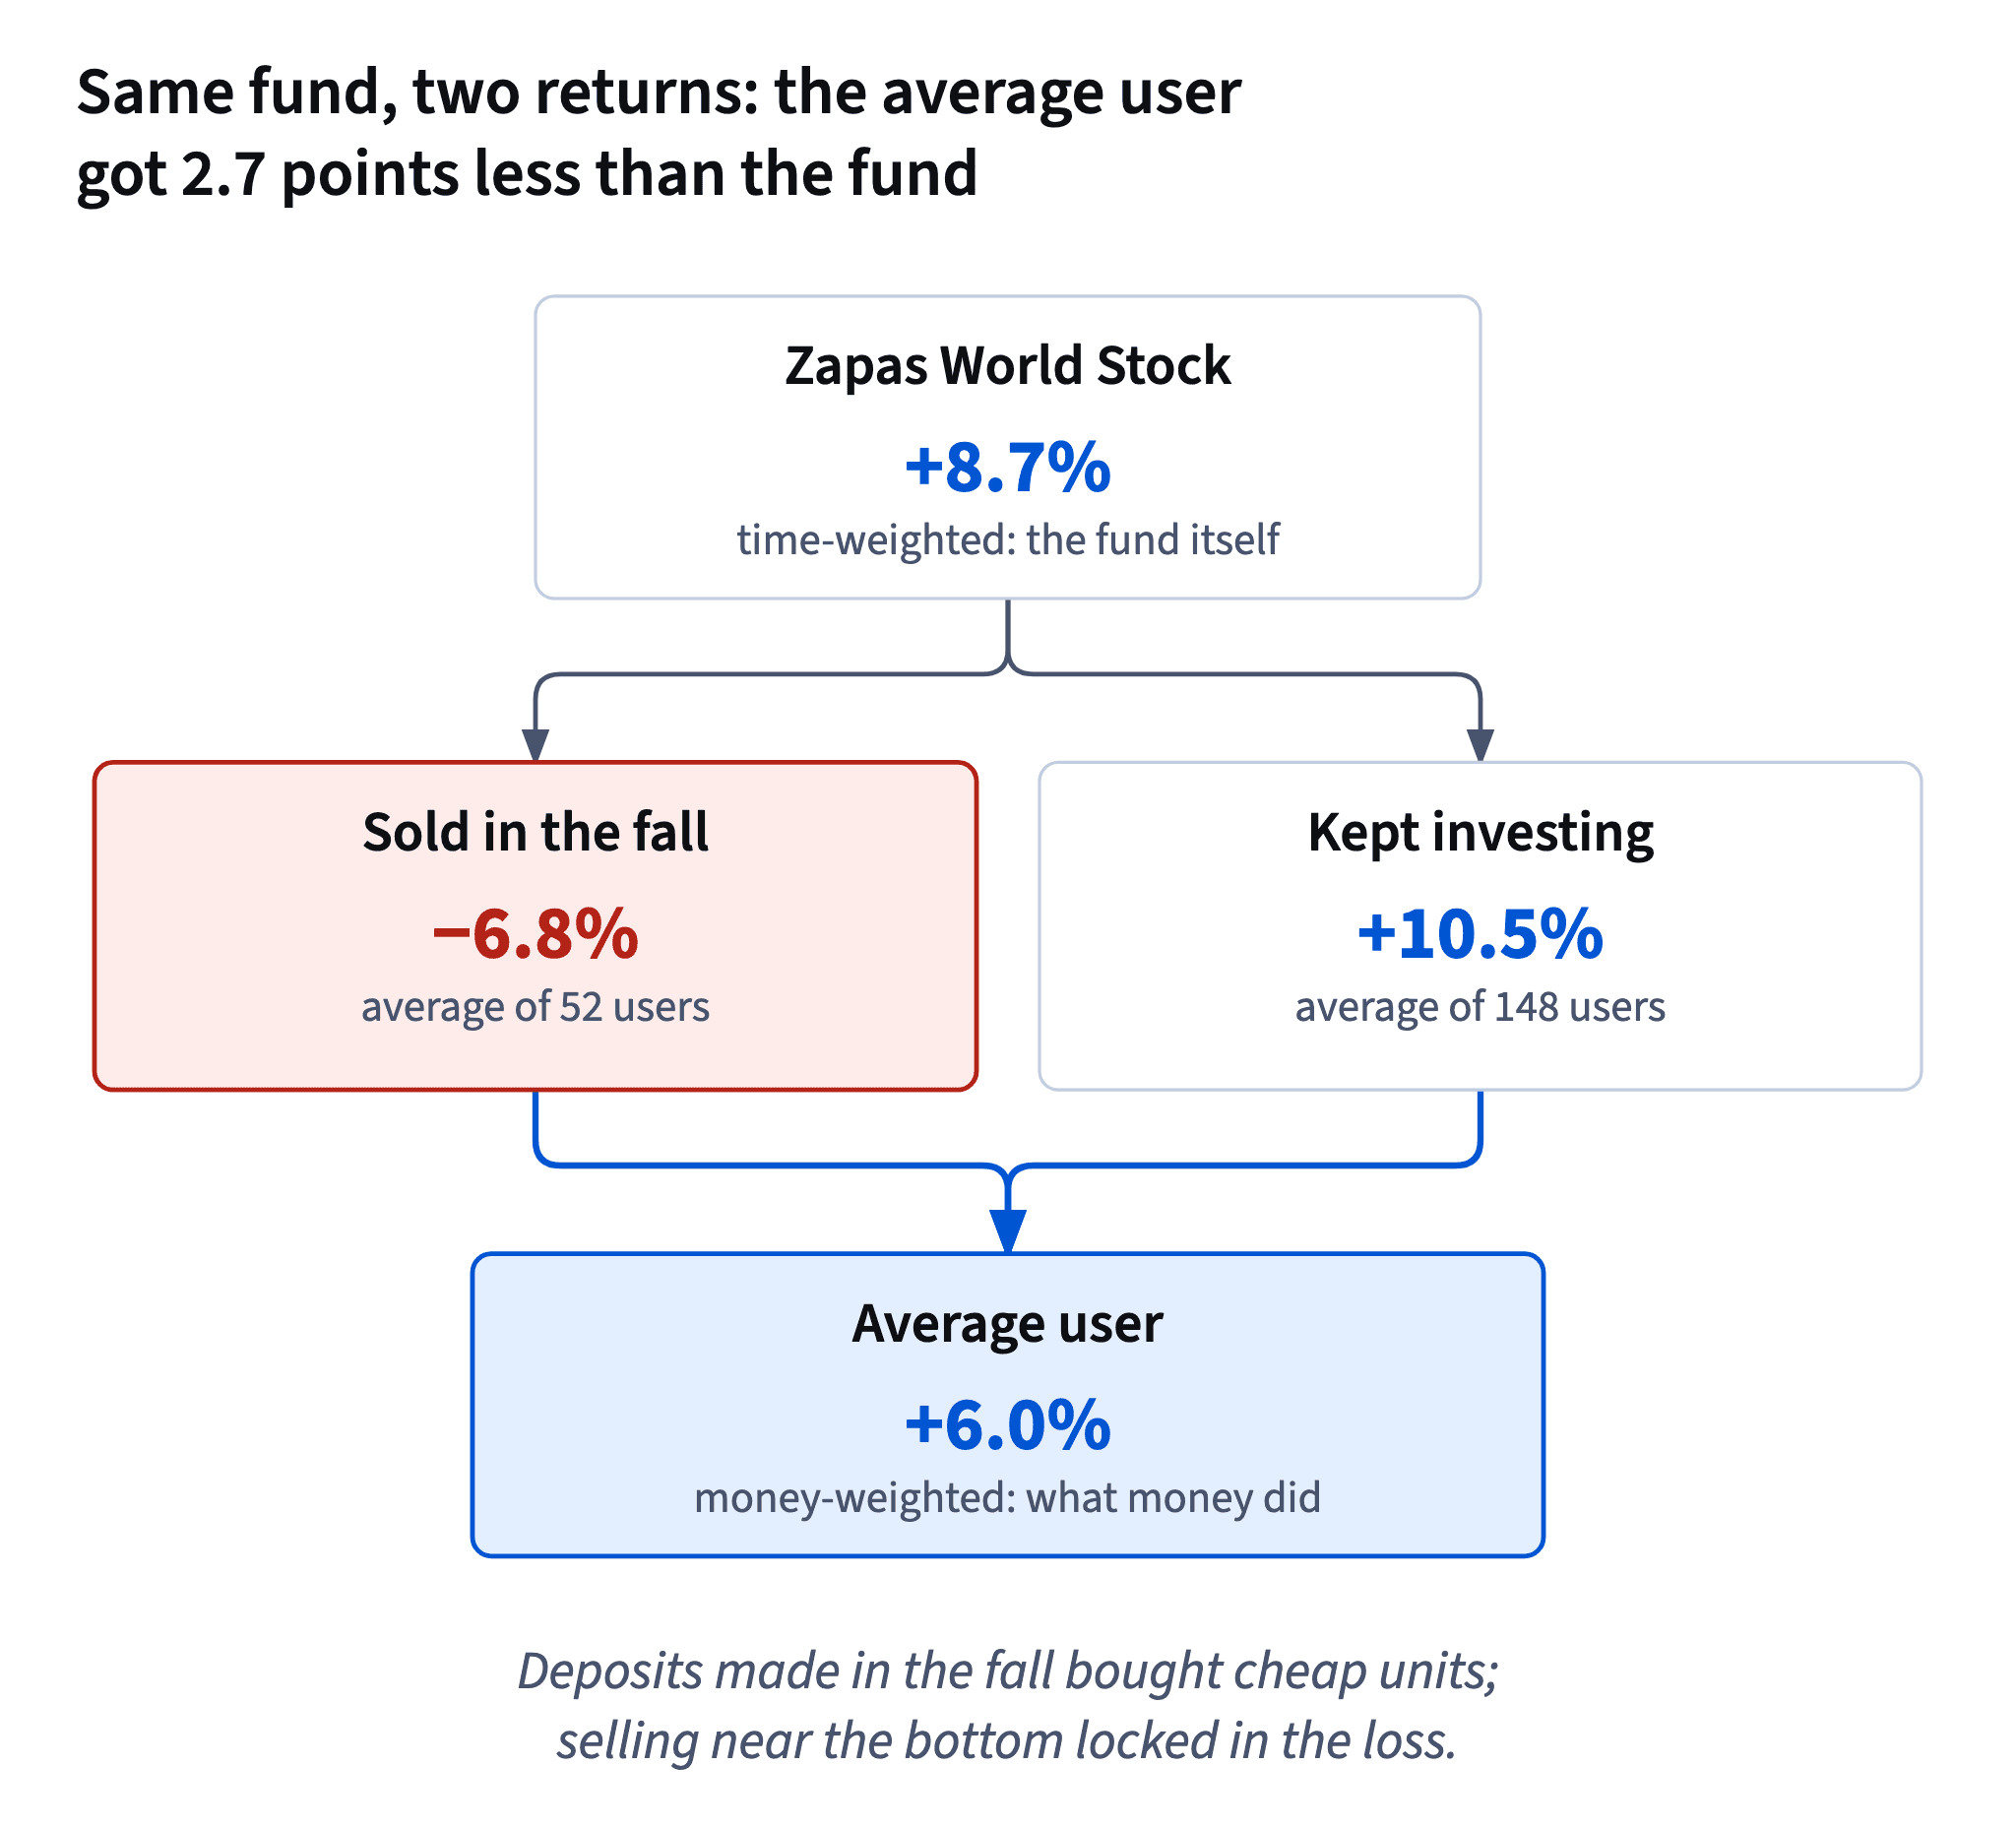
- Do"The fund returned 8.7%; the average beta user got 6.0%."
- Don't"Our users earned 8.7%."
That is the fund's number, not the users'.
Measuring the behavior gap
The behavior gap is the fund's time-weighted return minus the average money-weighted return of its investors, over the same period.
For Zapas's beta year: 8.7 − 6.0 = 2.7 percentage points. Write it in points, because it is the distance between two returns.
Two details keep the number honest:
- Same fund, same period. Compare users with the fund they actually held, over the months they held it. Comparing with another fund mixes in a different question.
- Averages hide the range. The 6.0% is an average of very different stories: users who sold in the drop averaged −6.8%, users who never sold +10.5%.
A gap of a few points a year sounds small. Next to a fund that costs 0.61% a year all-in, it is the largest cost an investor pays, and no factsheet shows it.
Chart data
| who | Return for the year, % |
|---|---|
| Fund | 8.7 |
| Average user | 6 |
| Sold in the drop | -6.8 |
| Never sold | 10.5 |
| Never sold, no theme | 12.7 |
- Do8.7% − 6.0% = a gap of 2.7 points
- Don't"Users got 31% less than the fund" (2.7 ÷ 8.7)
A ratio of returns is easy to misread; keep the gap in points.
The gap in dollars
Points are abstract. To show a team what behavior costs, compare two versions of the same money.
- What happened. Zapas's 200 full-year beta users put in a net 1,568,900 dol. over the year (starting balances plus monthly deposits, minus withdrawals) and ended with 1,647,711.84 dol.
- The same money, simply held. Keep every deposit and withdrawal on the same dates, but leave everything in the world fund: no selling in the drop, no switching to the theme fund. The cohort would end with 1,733,059.59 dol.
Dataset · 200 rows
Zapas beta cohort, one year (synthetic)
The 200 users in the beta all year: how often they checked the app, deposits, who sold in the drop and when, theme fund buys, withdrawals and the end value in dol.
First 5 of 200 rows
The difference, 85,347.75 dol., is the cost of behavior for one year. Nobody charged it; users paid it to themselves by selling low, sitting in cash during the rebound and buying a theme after its run-up.
This "simply held" baseline is the fairest one: same deposits, same fund, only the decisions removed.
- Do1,733,059.59 − 1,647,711.84 = 85,347.75 dol.
- Don't"Users gained 78,811.84, so behavior cost nothing."
A gain can still be smaller than the gain they would have had.
Selling in a fall, then coming back
Selling in a fall feels like a pause button: "I'll step out and come back when it's calmer." The problem is that "calmer" usually means "after prices have already risen".
In Zapas's beta year the world fund fell 22.0% from month 2 to month 6, then climbed back and finished at +8.7%. Of the 52 users who sold in months 5 or 6:
- 20 came back in month 10 or 11 and averaged +1.4%: they sold low and bought back higher;
- 32 stayed out and averaged −11.9%: the fall was locked in for good.
Users who never sold averaged +10.5%.
Selling turns a drop on the screen into a real loss. Coming back later rarely repairs it, because the biggest rises tend to come soon after the worst months, while the seller is still waiting for a sign.
Chart data
| Month | Zapas World Stock |
|---|---|
| 0 | 100 |
| 1 | 103 |
| 2 | 105.1 |
| 3 | 100.9 |
| 4 | 91.8 |
Show 8 more rows
| 5 | 84.4 |
| 6 | 81.9 |
| 7 | 86 |
| 8 | 91.2 |
| 9 | 94.8 |
| 10 | 97.7 |
| 11 | 103.5 |
| 12 | 108.7 |
- Do"I keep my monthly amount going through the fall."
- Don't"I'll sell now and buy back when things look better."
Computing one user's return
A simple way to get a money-weighted return for one year: divide the gain by the average amount of money that was at work.
- Gain = end value − start value − net deposits.
- Money at work = start value + each deposit × the share of the year it was invested. A deposit at the start of month 1 counts fully (12/12), one at the start of month 12 counts 1/12. Twelve equal deposits add up to 6.5 deposits' worth.
User U001: gain 4,246.39 − 2,000 − 1,800 = 446.39; money at work 2,000 + 150 × 6.5 = 2,975; return 15.0%.
That's higher than the fund's 8.7%. A money-weighted return can beat the time-weighted one when money arrives before a rise, here as deposits bought cheap units in the fall. It can also fall far below it, when money leaves before a rise. Either way, the gap measures timing, not the fund.
- Do(4,246.39 − 2,000 − 1,800) ÷ (2,000 + 150 × 6.5) = 15.0%
- Don't(4,246.39 − 2,000) ÷ 2,000 = 112%
Deposits are not a return.
Whose return is on the screen?
A product that holds people's money shows two kinds of returns, and each belongs in a different place.
- The fund's return (time-weighted) belongs on fund pages and marketing, labelled as the fund's, with the period, the fall that came with it, and a reminder that the past doesn't predict the future.
- The user's own return (money-weighted) belongs in the user's account, next to the fund's return for the same months. Seeing both teaches people that their decisions matter.
The common mistake is to borrow the fund's number for the users ("our users earned 8.7%"). It's usually higher than what users got, because the average investor buys after rises and sells after falls. In Zapas's beta it overstated the users' result by 2.7 points.
- Do"Your return this year: +6.2%. The fund: +8.7%."
Both numbers, same period, in the account.
- Don't"Zapas users earn 8.7% a year."
Designing for the gap
The behavior gap is made of two moves: selling after a fall and buying after a rise. A product can make either move easier or harder.
Features that tend to narrow the gap:
- Automatic deposits that keep running in a fall. They turn the scary months into cheap purchases; in the beta, users who simply kept depositing beat the fund.
- The user's own return next to the fund's, so the cost of timing becomes visible.
- The user's own plan shown at the moment of a big decision (next lessons).
Features that tend to widen it:
- frequent, prominent short-term numbers (daily changes, red and green flashes);
- "trending", "top performer" or "hot theme" banners that point at whatever just rose.
None of this takes control away: users can always sell. The aim is a default that serves the plan, not the mood of the day.
- Do"Your 200 dol. deposit goes in on the 5th, as planned."
- Don't"Robo Theme is up 33% — don't miss out!"
A short note that settles a number
When a colleague wants to publish a flattering number, a short note works better than a long argument. Four sentences are enough:
- Whose number it is: 8.7% is the fund's time-weighted return; the average beta user got 6.0% money-weighted.
- What the gap cost: 2.7 points, or 85,347.75 dol. for the cohort compared with simply holding.
- Why: selling in the drop (the 52 sellers averaged −6.8%), waiting in cash, buying the theme after its run-up.
- What to say instead: the fund's return, labelled as the fund's, with the fall that came with it and no promise; each user's own return in the app.
Keep the tone factual. The point isn't that Ethan was wrong; it's that the honest version protects users and the company.
- Do"Fund 8.7%, users 6.0%: behavior cost 85,347.75 dol."
- Don't"Users earned less because the fund is bad."
Ready to practise?
Answer the lesson's exercises and earn 250 points the first time you finish it.
Start the exercises