

P-value meaning: what a p-value tells you in an A/B test
P-value explained in plain words: the p-value meaning in an A/B test, what p < 0.05 says about statistical significance, and what it doesn't.
By Sergey BruhPublished 8 min read
P-value explained in plain words: the p-value meaning in an A/B test, what p < 0.05 says about statistical significance, and what it doesn't.
By Sergey BruhPublished 8 min read
A free course for PMs and marketers: short lessons, real product data and exercises with instant feedback.
Start the free course10 min read
Peeking in A/B testing turned a 5% false-positive rate into 27.6% in 100,000 simulated tests. When to stop an A/B test, and how sequential testing helps.
9 min read
What a 95% confidence interval tells you in an A/B test, how to read one that crosses zero, and why it beats a bare p-value for ship decisions.
What does a p-value mean? Here is the p-value meaning in one sentence: it is the probability of seeing a difference at least as large as the one you observed if, in reality, there were no difference at all. A small p-value (conventionally below 0.05) means your result would be surprising in a world where the change did nothing, so you have some evidence that it did something; that is what "statistically significant" means. It does not tell you the probability that your variant is better, how big the effect is, or whether the result matters for the business. Most bad decisions around A/B tests come from reading more into a p-value than it can carry.
CatChow, an online pet-food shop, tests a "free shipping over 30 dollars" banner on the product page. After two weeks:
The variant converts 0.6 percentage points better, a 15% relative lift. Is that real, or could random noise produce a gap like this?
A two-proportion z-test gives and .
Translated: if the banner truly had zero effect, you would see a gap of 0.6 points or more (in either direction) in about 3.6% of experiments this size, just from the luck of which visitors landed in which group. That is fairly unlikely, so the team has reasonable evidence that the banner helps.
Every p-value comes from the same three steps:
Then you compare it with a threshold chosen before the test, the significance level (usually 0.05). If , you call the result statistically significant.
", so there is a 3.6% chance the banner does nothing" is the most common misreading, and it is wrong. The p-value is calculated assuming is true; it cannot also tell you how likely is.
Here is why that matters. Suppose only 1 in 10 ideas your team tests actually works, your tests have 80% power and you use . Out of 1,000 tests:
So 125 tests are "winners", and 45 of them are false: 36% of your significant results are noise, even though every one of them had . The p-value alone can't tell you which ones.
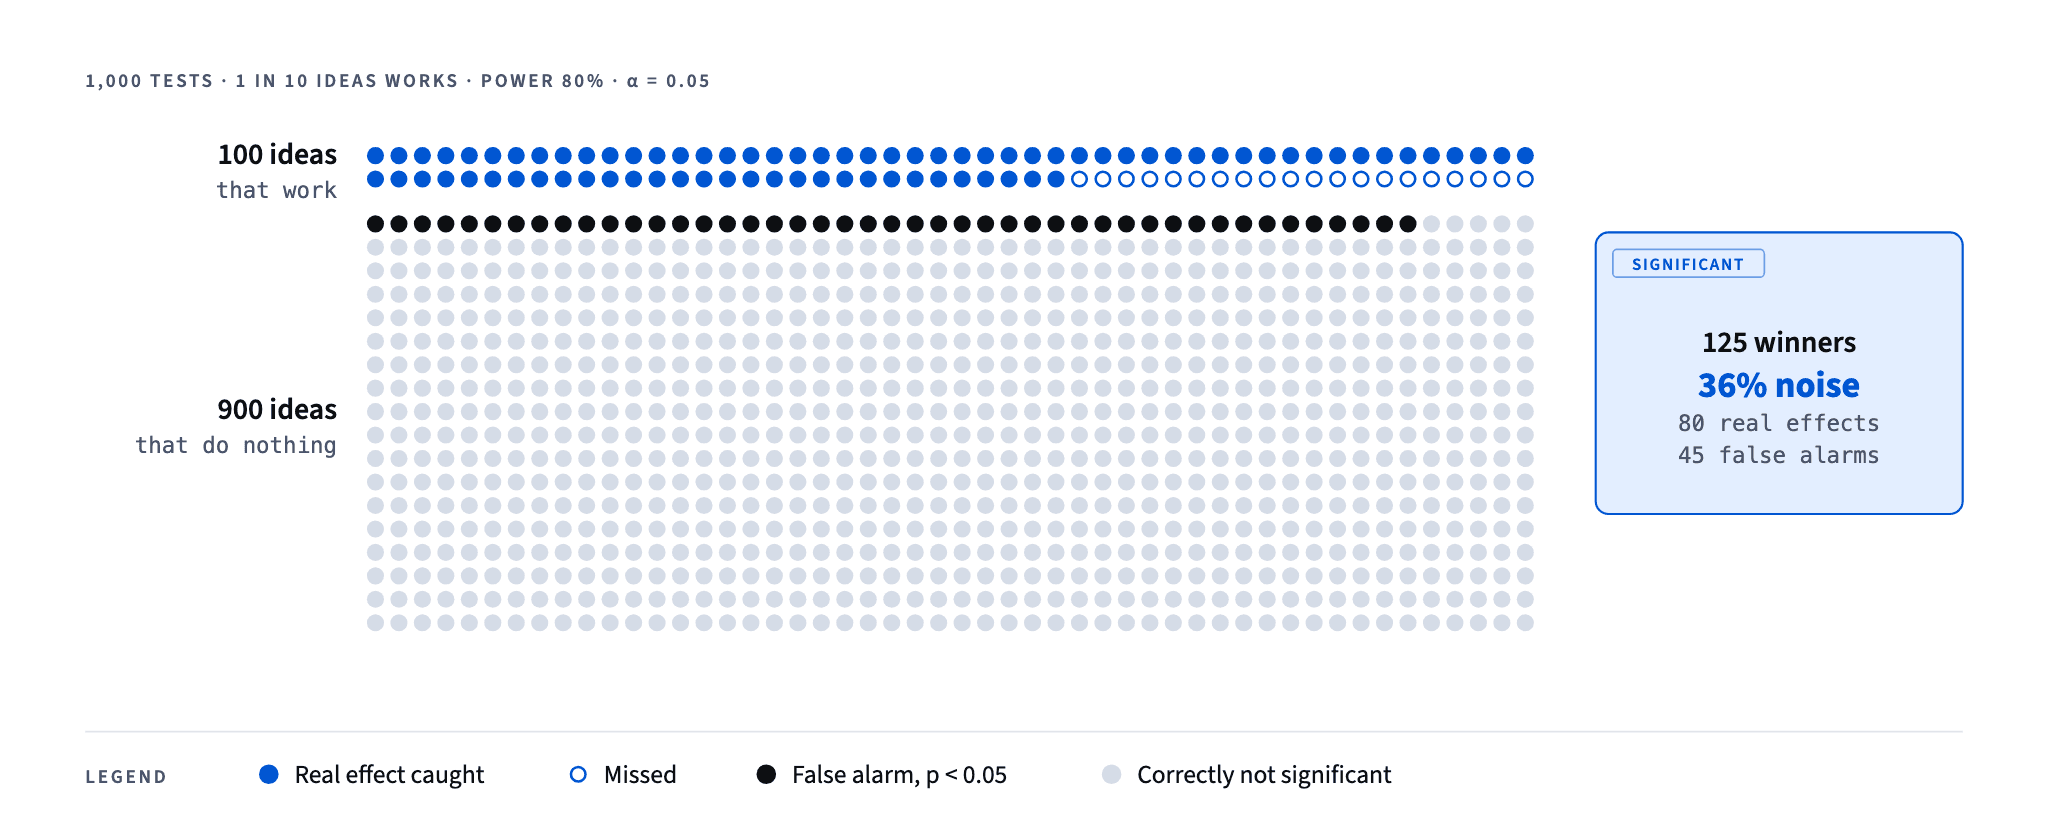
"97% chance the banner wins" is the same mistake in reverse. Statements like that need a Bayesian analysis with an explicit prior. Some A/B testing tools report them; a classic p-value does not.
A tiny, useless effect can have a very small p-value if the sample is large enough. With a million visitors per group, a change from 4.00% to 4.08% conversion gives . Highly significant, and possibly not worth the engineering time to maintain.
The reverse is also true. Take the banner test again, but with only 1,000 visitors per group and the same 4.0% vs 4.6% rates: now . The effect is exactly the same size; the test is just too small to separate it from noise.
does not mean "the banner doesn't work". It means "this test couldn't tell". Absence of evidence is not evidence of absence, especially in an underpowered test. Before you kill an idea, check whether the test had enough users to detect the effect you care about.
Two different questions:
You need both. The fix is to always look at the effect size and its confidence interval next to the p-value. For the banner test, the 95% confidence interval for the difference is roughly +0.04 to +1.16 percentage points. That range says two things at once: the effect is probably positive (the interval doesn't include zero, which matches ), and it could be anything from negligible to large. That is far more useful for a decision than "".
Peeking. If you check the results every day and stop the moment drops below 0.05, the real false-positive rate climbs well above 5% (see why peeking at A/B tests breaks them). P-values assume you analyse once, at the sample size you planned.
Many metrics, one winner. Test 10 independent metrics with no real effect at , and the chance that at least one comes out "significant" is . With 20 metrics it is about 64%. Pick one primary metric before launch, or correct for multiple comparisons.
Slicing after the fact. "Not significant overall, but significant for iOS users in Kyiv on weekends" is almost always a false positive. Segments you didn't plan in advance are ideas for the next test, not conclusions.
Treating 0.049 and 0.051 as opposites. The 0.05 line is a convention, not a law of nature. A result at 0.051 is almost exactly as strong as one at 0.049.
Stakeholders don't need the definition of a p-value. They need to know what happened, how sure you are, and what you recommend. A template that works:
The banner increased conversion from 4.0% to 4.6% (+0.6 pp, +15%). The 95% confidence interval for the lift is +0.04 to +1.16 pp, so the effect is very likely positive but could be small. The result is statistically significant (). With about 43,000 product-page visitors a month, the point estimate means roughly 250 extra orders a month; at the low end of the range the gain would be marginal. Recommendation: ship it and keep monitoring conversion and average order value for four weeks.
Notice what it does: effect first, uncertainty as a range, p-value as supporting detail, and a decision tied to business impact. Avoid "the test proved", "97% confidence the banner wins" and "no effect" for a non-significant result; say "we couldn't detect an effect larger than X" instead.
It means that if the change had no real effect, results as extreme as yours would appear less than 5% of the time. By convention you then call the result statistically significant. It does not mean there is a 95% chance your hypothesis is right.
It is weak evidence, about as weak as 0.04 is. Rather than arguing about the threshold, look at the confidence interval and the business stakes. If the plausible range includes effects that would matter, consider a longer or larger test instead of declaring victory or defeat.
Not exactly. Tools may display "p = 0.000" or "p < 0.001" when the value is very small. Report it as "p < 0.001", and remember that with huge samples even trivial effects reach tiny p-values.
Those tools use Bayesian methods, which answer a different question: given the data and a prior assumption, how likely is the variant to be better. It can be easier to explain, but it is not the same number as a p-value, and it also depends on choices you should understand before trusting it.
The free lesson p-value and significance builds the p-value from scratch on a CatChow experiment, with quizzes that target exactly the misreadings above and a practice task checked by AI. It is part of the free course Statistics for Product Managers and Marketers.
To check your own numbers, the free statistical significance calculator takes the counts of two groups and returns the p-value with a one- or two-sided test, a plain-language reading and a picture of where your result falls on the curve.