

Theory
Support, resistance and breakouts
Mark the prices where the market turned before, and see why a breakout can be real or a trap, and what a level can and cannot tell you.
~9 min read · 9 exercises · 250 points
Before you start
Where the price keeps turning
Back on your Pebble practice account, today you draw lines on a chart. You'll have 60 days of Bluefin Energy from autumn 2025 and one task to start: look at where the price kept stopping.
You'll mark the levels the price turned at, see what a break through one of them looks like, and why many breaks fail and slip back. The aim is to describe what the chart did, not to forecast it.
Support and resistance
Within a trading range (from Trend and range), the price keeps bumping into the same prices. Those prices get names.
- Support is a price where falls kept stopping and turning back up: the floor of the box.
- Resistance is a price where rises kept stopping and turning back down: the ceiling.
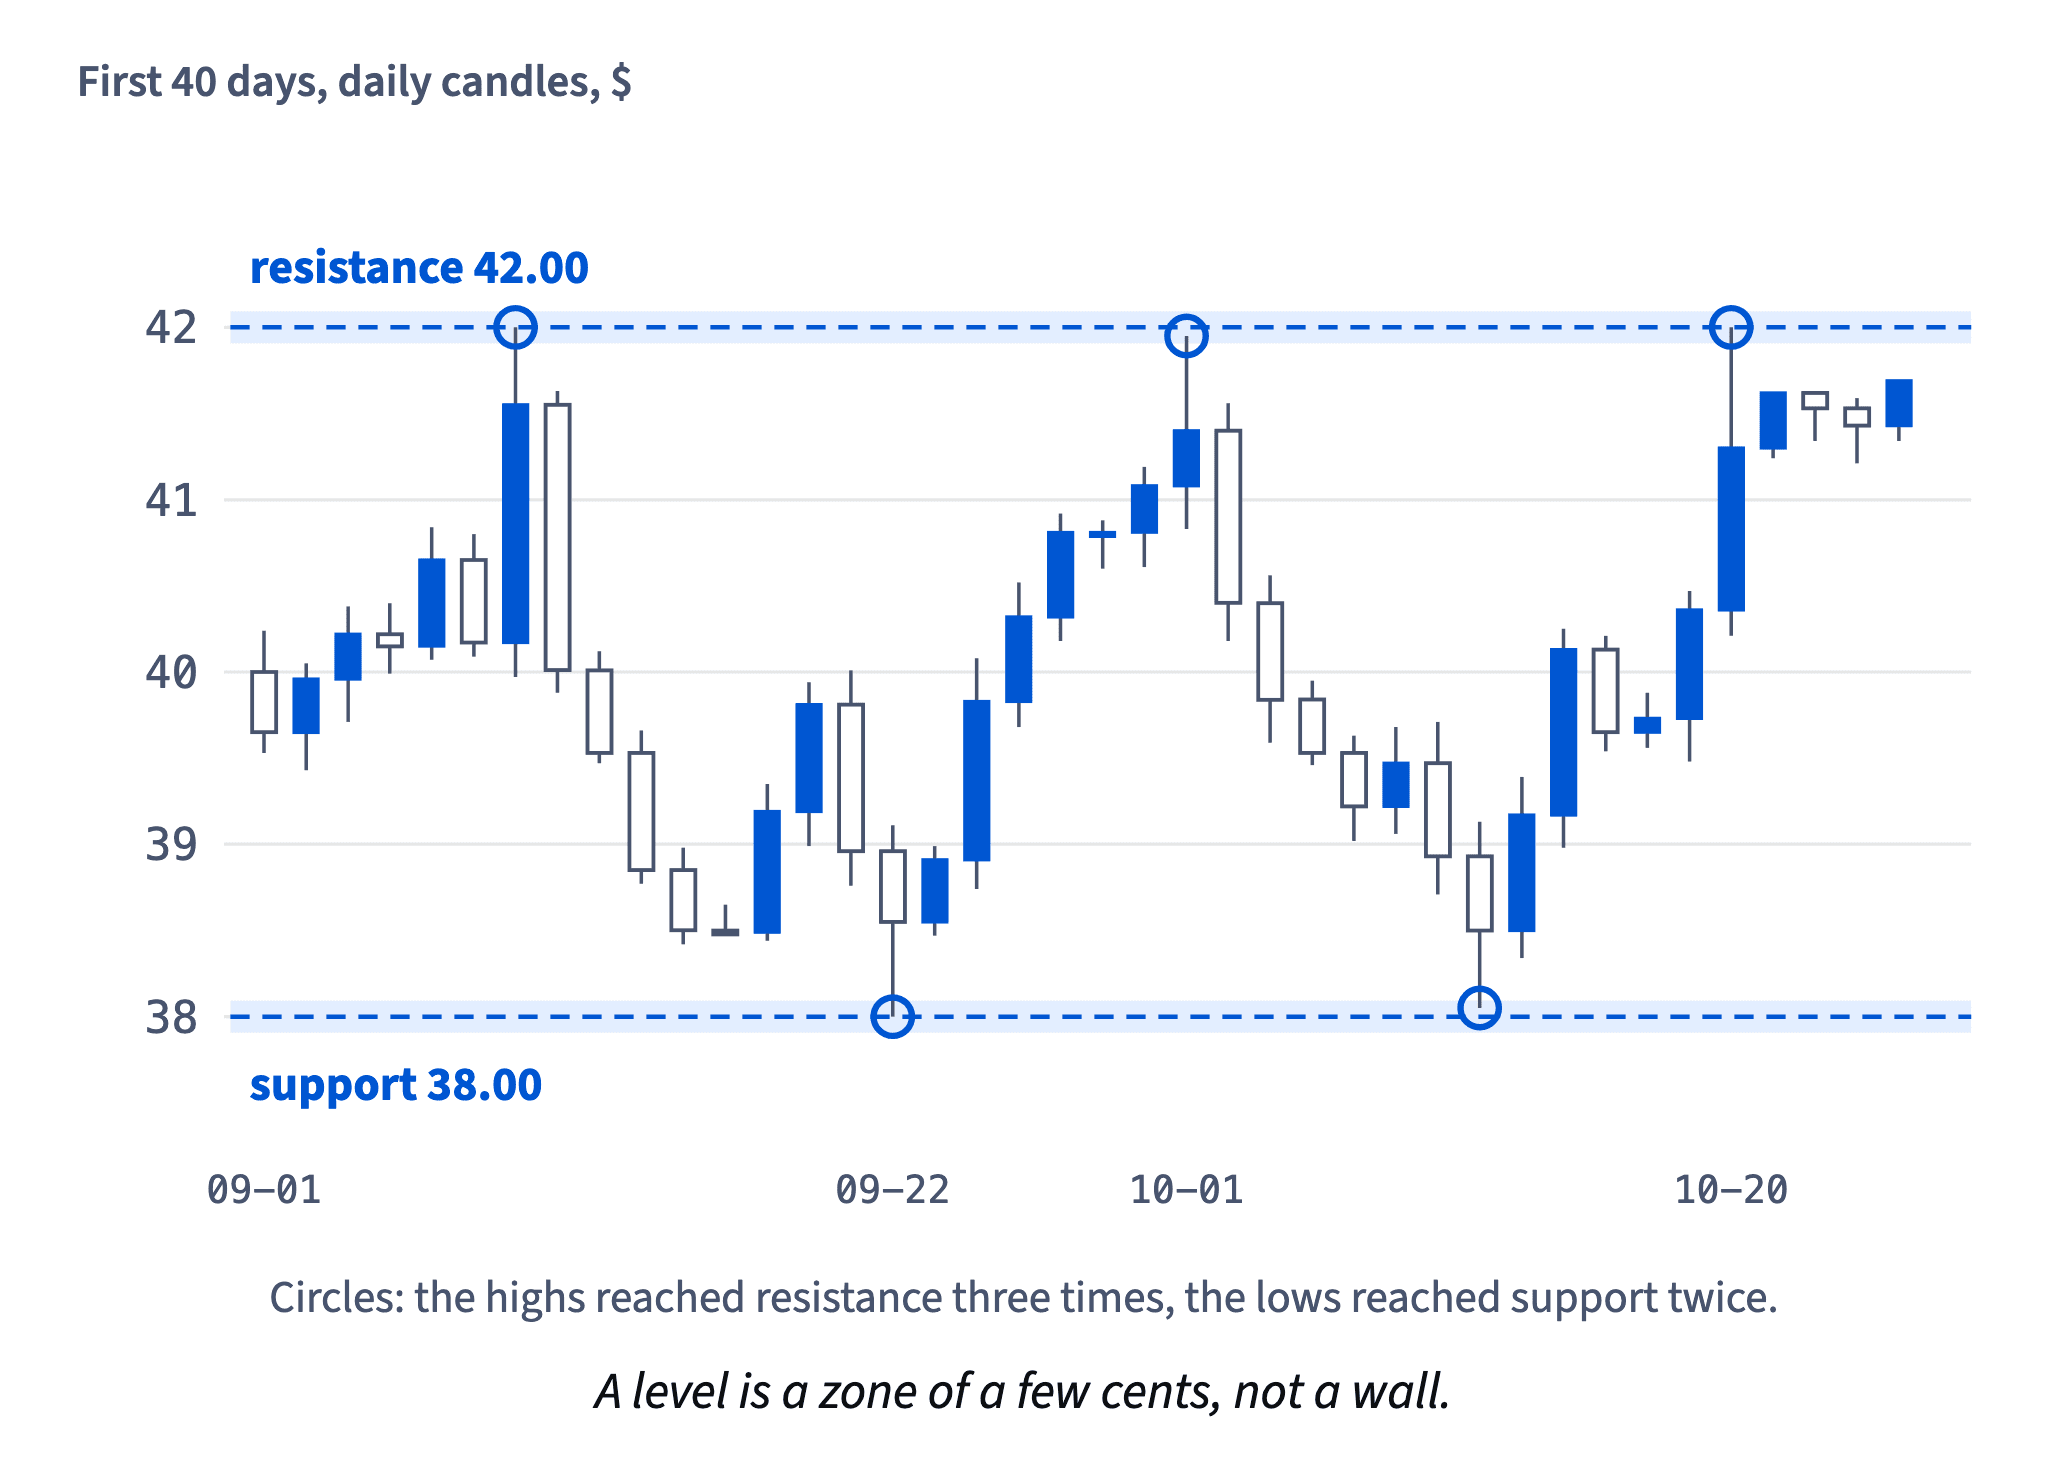
To mark them, read the data, not your hopes. In Bluefin Energy's first 40 days of autumn 2025, the highs reached 42.00 on 2025-09-09 and 2025-10-20, and 41.95 on 2025-10-01, and never went higher: resistance at 42.00. The lows reached 38.00 on 2025-09-22 and came close again later: support at 38.00.
Dataset · 60 rows
Bluefin Energy, 60 daily candles
Practice market data on Pebble. Prices in dollars, volume in shares.
First 5 of 60 rows
More touches make a level easier to see, but not more certain. A level records where the price turned before; nothing guarantees it will turn there again.
- Do"Highs stopped at 42.00, 41.95 and 42.00: resistance near 42."
- Don't"Support at 38 means it can't go below 38."
A level is a record of past turns, not a floor that holds by law.
A level is a zone, marked before you trade
Why would a price care about 42.00? Nobody knows for sure. One common explanation is that people remember where the price turned and place orders near those prices. Whatever the reason, treat a level as a zone of a few cents, not a wall drawn to the cent. On Bluefin Energy, turns at 41.95 and 42.00 are touches of the same resistance.
Chart data
| date | High | Low | Close |
|---|---|---|---|
| 2025-09-01 | 40.24 | 39.53 | 39.65 |
| 2025-09-02 | 40.05 | 39.43 | 39.96 |
| 2025-09-03 | 40.38 | 39.71 | 40.22 |
| 2025-09-04 | 40.4 | 39.99 | 40.15 |
| 2025-09-05 | 40.84 | 40.07 | 40.65 |
Show 55 more rows
| 2025-09-08 | 40.8 | 40.09 | 40.17 |
| 2025-09-09 | 42 | 39.97 | 41.55 |
| 2025-09-10 | 41.63 | 39.88 | 40.01 |
| 2025-09-11 | 40.12 | 39.47 | 39.53 |
| 2025-09-12 | 39.66 | 38.77 | 38.85 |
| 2025-09-15 | 38.98 | 38.42 | 38.5 |
| 2025-09-16 | 38.65 | 38.49 | 38.49 |
| 2025-09-17 | 39.35 | 38.44 | 39.19 |
| 2025-09-18 | 39.94 | 38.99 | 39.81 |
| 2025-09-19 | 40.01 | 38.76 | 38.96 |
| 2025-09-22 | 39.11 | 38 | 38.55 |
| 2025-09-23 | 38.99 | 38.47 | 38.91 |
| 2025-09-24 | 40.08 | 38.74 | 39.83 |
| 2025-09-25 | 40.52 | 39.68 | 40.32 |
| 2025-09-26 | 40.92 | 40.18 | 40.81 |
| 2025-09-29 | 40.88 | 40.6 | 40.81 |
| 2025-09-30 | 41.19 | 40.61 | 41.08 |
| 2025-10-01 | 41.95 | 40.83 | 41.4 |
| 2025-10-02 | 41.56 | 40.18 | 40.4 |
| 2025-10-03 | 40.56 | 39.59 | 39.84 |
| 2025-10-06 | 39.95 | 39.46 | 39.53 |
| 2025-10-07 | 39.63 | 39.02 | 39.22 |
| 2025-10-08 | 39.68 | 39.06 | 39.47 |
| 2025-10-09 | 39.71 | 38.71 | 38.93 |
| 2025-10-10 | 39.13 | 38.05 | 38.5 |
| 2025-10-13 | 39.39 | 38.34 | 39.17 |
| 2025-10-14 | 40.25 | 38.98 | 40.13 |
| 2025-10-15 | 40.21 | 39.54 | 39.65 |
| 2025-10-16 | 39.88 | 39.56 | 39.73 |
| 2025-10-17 | 40.47 | 39.48 | 40.36 |
| 2025-10-20 | 42 | 40.21 | 41.3 |
| 2025-10-21 | 41.62 | 41.24 | 41.62 |
| 2025-10-22 | 41.62 | 41.34 | 41.53 |
| 2025-10-23 | 41.59 | 41.21 | 41.43 |
| 2025-10-24 | 41.69 | 41.34 | 41.69 |
| 2025-10-27 | 42.6 | 41.4 | 41.5 |
| 2025-10-28 | 41.63 | 39.29 | 39.48 |
| 2025-10-29 | 39.76 | 39.41 | 39.7 |
| 2025-10-30 | 39.92 | 39.49 | 39.71 |
| 2025-10-31 | 39.91 | 39.52 | 39.65 |
| 2025-11-03 | 40.31 | 39.45 | 40.1 |
| 2025-11-04 | 40.25 | 39.32 | 39.42 |
| 2025-11-05 | 40.79 | 39.22 | 40.6 |
| 2025-11-06 | 40.75 | 40.19 | 40.4 |
| 2025-11-07 | 40.8 | 40.33 | 40.69 |
| 2025-11-10 | 43.1 | 40.59 | 42.9 |
| 2025-11-11 | 43.12 | 42.4 | 42.62 |
| 2025-11-12 | 43.1 | 42.49 | 42.89 |
| 2025-11-13 | 43.01 | 42.37 | 42.58 |
| 2025-11-14 | 43.31 | 42.37 | 43.08 |
| 2025-11-17 | 43.33 | 42.93 | 43.16 |
| 2025-11-18 | 43.22 | 42.75 | 42.85 |
| 2025-11-19 | 43.02 | 42.68 | 42.76 |
| 2025-11-20 | 43.53 | 42.63 | 43.37 |
| 2025-11-21 | 43.49 | 42.74 | 42.91 |
Two habits keep levels honest:
- Mark them from the data before you look at your own position. Marc notes that whenever he draws levels after buying, he somehow finds a support just under his entry. That is wishful thinking with a ruler.
- Use the same rule each time, for example "highs or lows within 0.20 of each other, at least twice".
A level drawn this way is a description. It tells you where the price turned before, not that it will turn there again.
- Do"I mark levels on the clean chart first, then I check where my order would sit."
- Don't"I bought at 39.10, and look, there's support right at 39.00."
A level found after the trade is often a hope with a line through it.
Breakouts and false breakouts
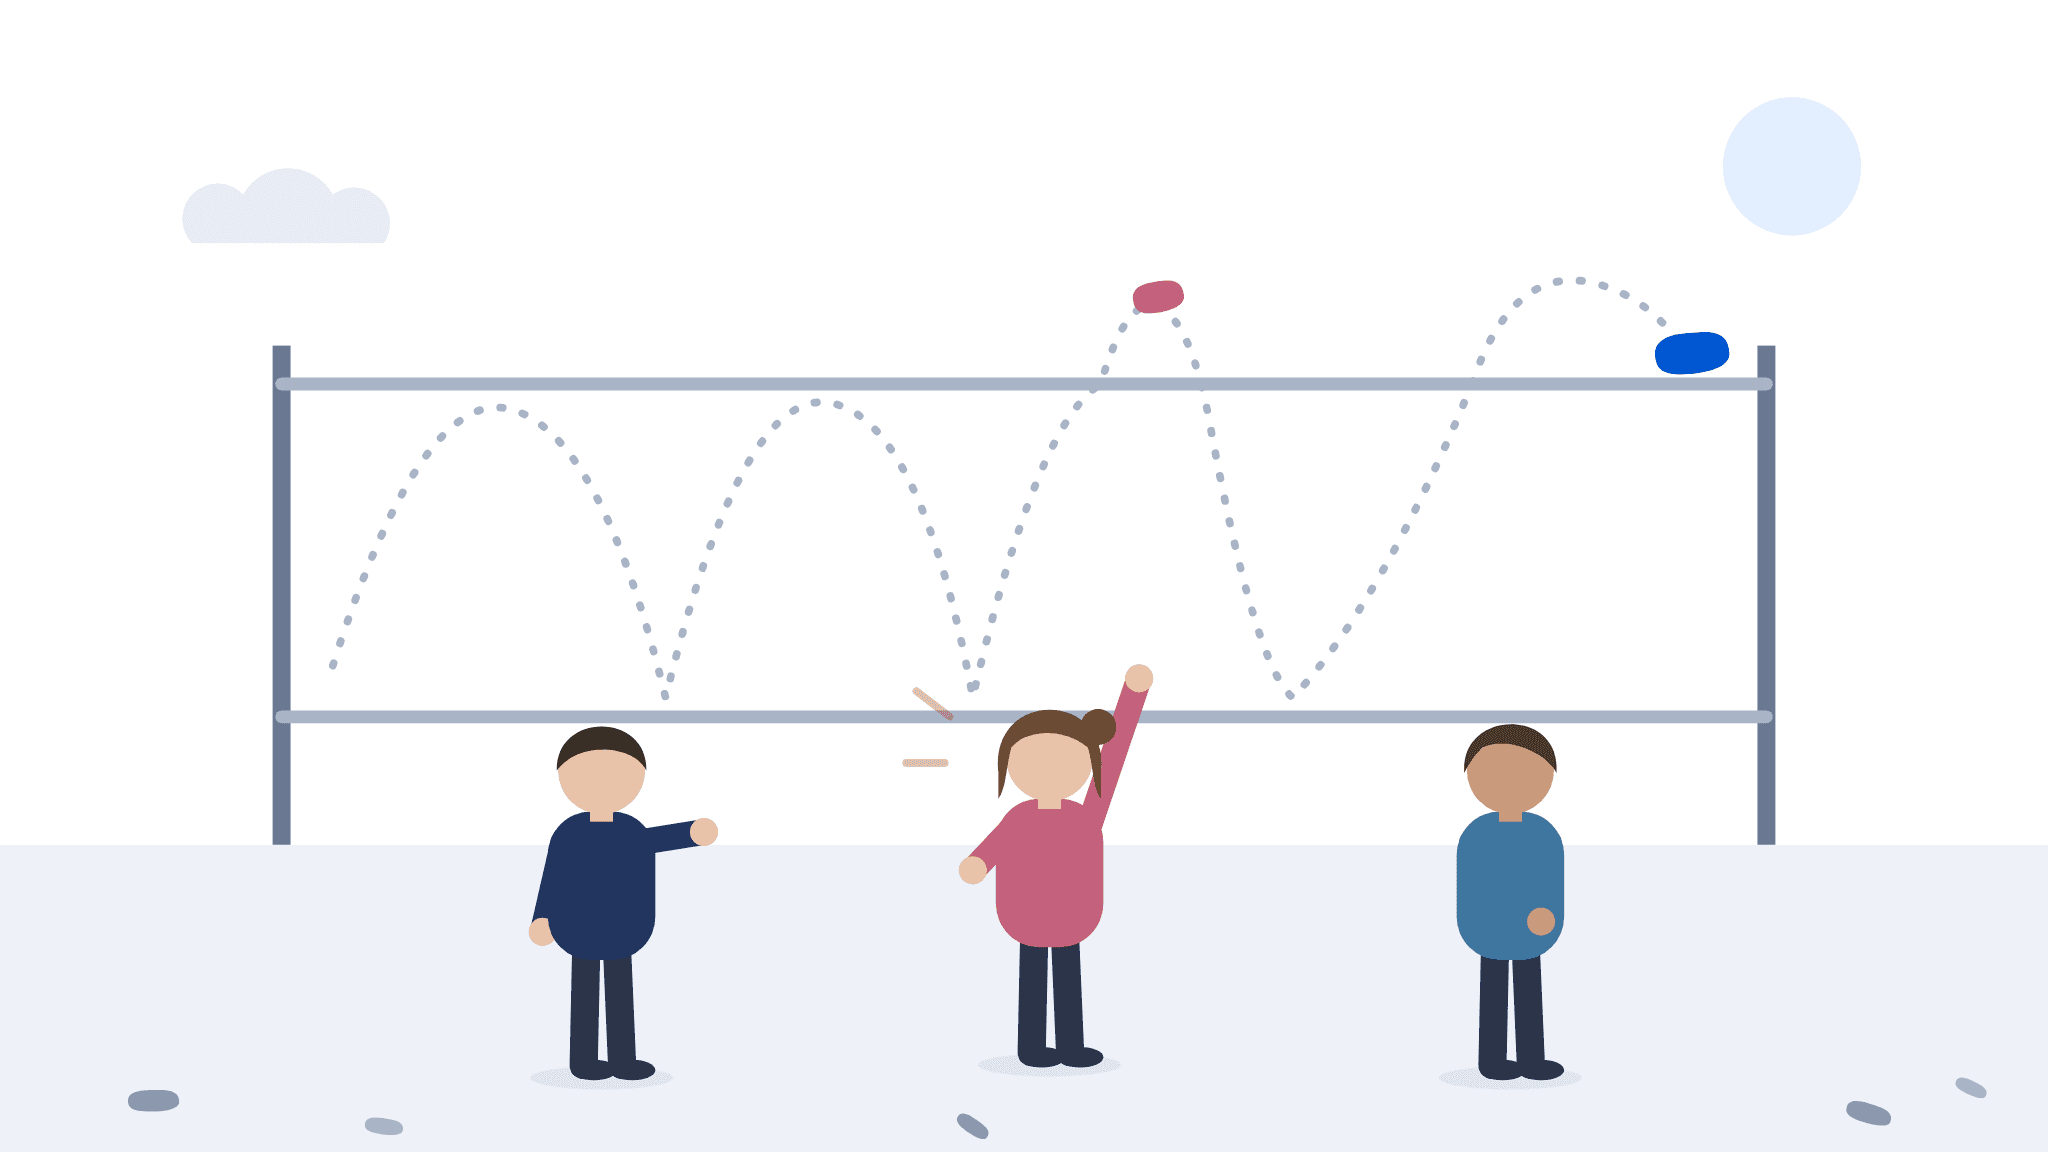
A breakout is when the price leaves a trading range and keeps going beyond the level. A false breakout is when it pokes beyond the level and comes back inside, often the same day.
On 2025-10-27 Bluefin Energy's high reached 42.60, well above resistance at 42.00, but the day closed at 41.50, back inside the box. The next day it fell as low as 39.48. That was a false breakout.
Chart: Bluefin Energy, daily high, low and close · shown above
The hard part: while it is happening, a false breakout and a real one look exactly the same. On that morning, the price above 42.00 looked like the start of a new climb. The difference only shows at the close, or days later.
So "the price went above the level" is not yet a breakout. At the very least, look at where the period closed, and accept that even a close beyond the level can fail.
- Do"High 42.60 but close 41.50: it poked out and came back."
- Don't"It's above 42 this morning, the breakout is confirmed."
The close hasn't happened yet.
What a false breakout costs
A common way to trade breakouts is a buy stop just above resistance: an order that buys only if the price rises to it (the stop order from Order types: market, limit, stop). It gets you in early, but it can't tell a real breakout from a poke.
Nora had a buy stop at 42.10 for 50 Bluefin Energy shares. On 2025-10-27 the high hit 42.60, so the order filled at 42.10. The day closed at 41.50, and she sold there in a panic, paying 3.00 in costs for the round trip:
(41.50 − 42.10) × 50 = −30.00; −30.00 − 3.00 = −33.00 dollars.
On a 10,000 practice account that's small. The habit is not: a buy stop above every level gets filled by every poke, and each false breakout charges the toll again, costs included. Count it per trade and then multiply by how often you'd do it.
- Do"−30 on the price and −3 in costs: −33 for one poke. How many pokes a year?"
- Don't"Only 33 dollars, it doesn't matter."
The habit repeats the toll on every false breakout.
Waiting for the close is a trade-off
One way to filter pokes: count a breakout only when a day closes beyond the level. A move above 42.00 during the day doesn't count.
On Bluefin Energy no day closed above 42.00 until 2025-11-10, which closed at 42.90. In the nine days after it, the lowest low was 42.37: this time the old ceiling held as a floor. The close rule skipped the false breakout of 2025-10-27 entirely.
It isn't free. Waiting means entering later and higher: 42.90 instead of 42.10, or (42.90 − 42.10) × 50 = 40.00 dollars more on 50 shares, before costs. And a close beyond a level can fail too.
So neither way is "right". One wins on this file, the other could win on the next. To compare them honestly you'd need 30 or more breakouts, with costs, tested the same way.
- Do"The close rule skipped the poke but paid 0.80 a share more to get in."
- Don't"Waiting for the close always works."
A close beyond the level can fail too; one example proves nothing.
Volume doesn't settle it
Volume is how many shares changed hands in a period. A popular idea says a "real" breakout comes on big volume and a false one on small volume. This file shows why you shouldn't lean on it.
On Bluefin Energy, the usual day traded about 99,000 shares. The false breakout of 2025-10-27 traded 280,324, almost three times as much and the most in the whole file. The breakout that held, on 2025-11-10, traded 155,646.
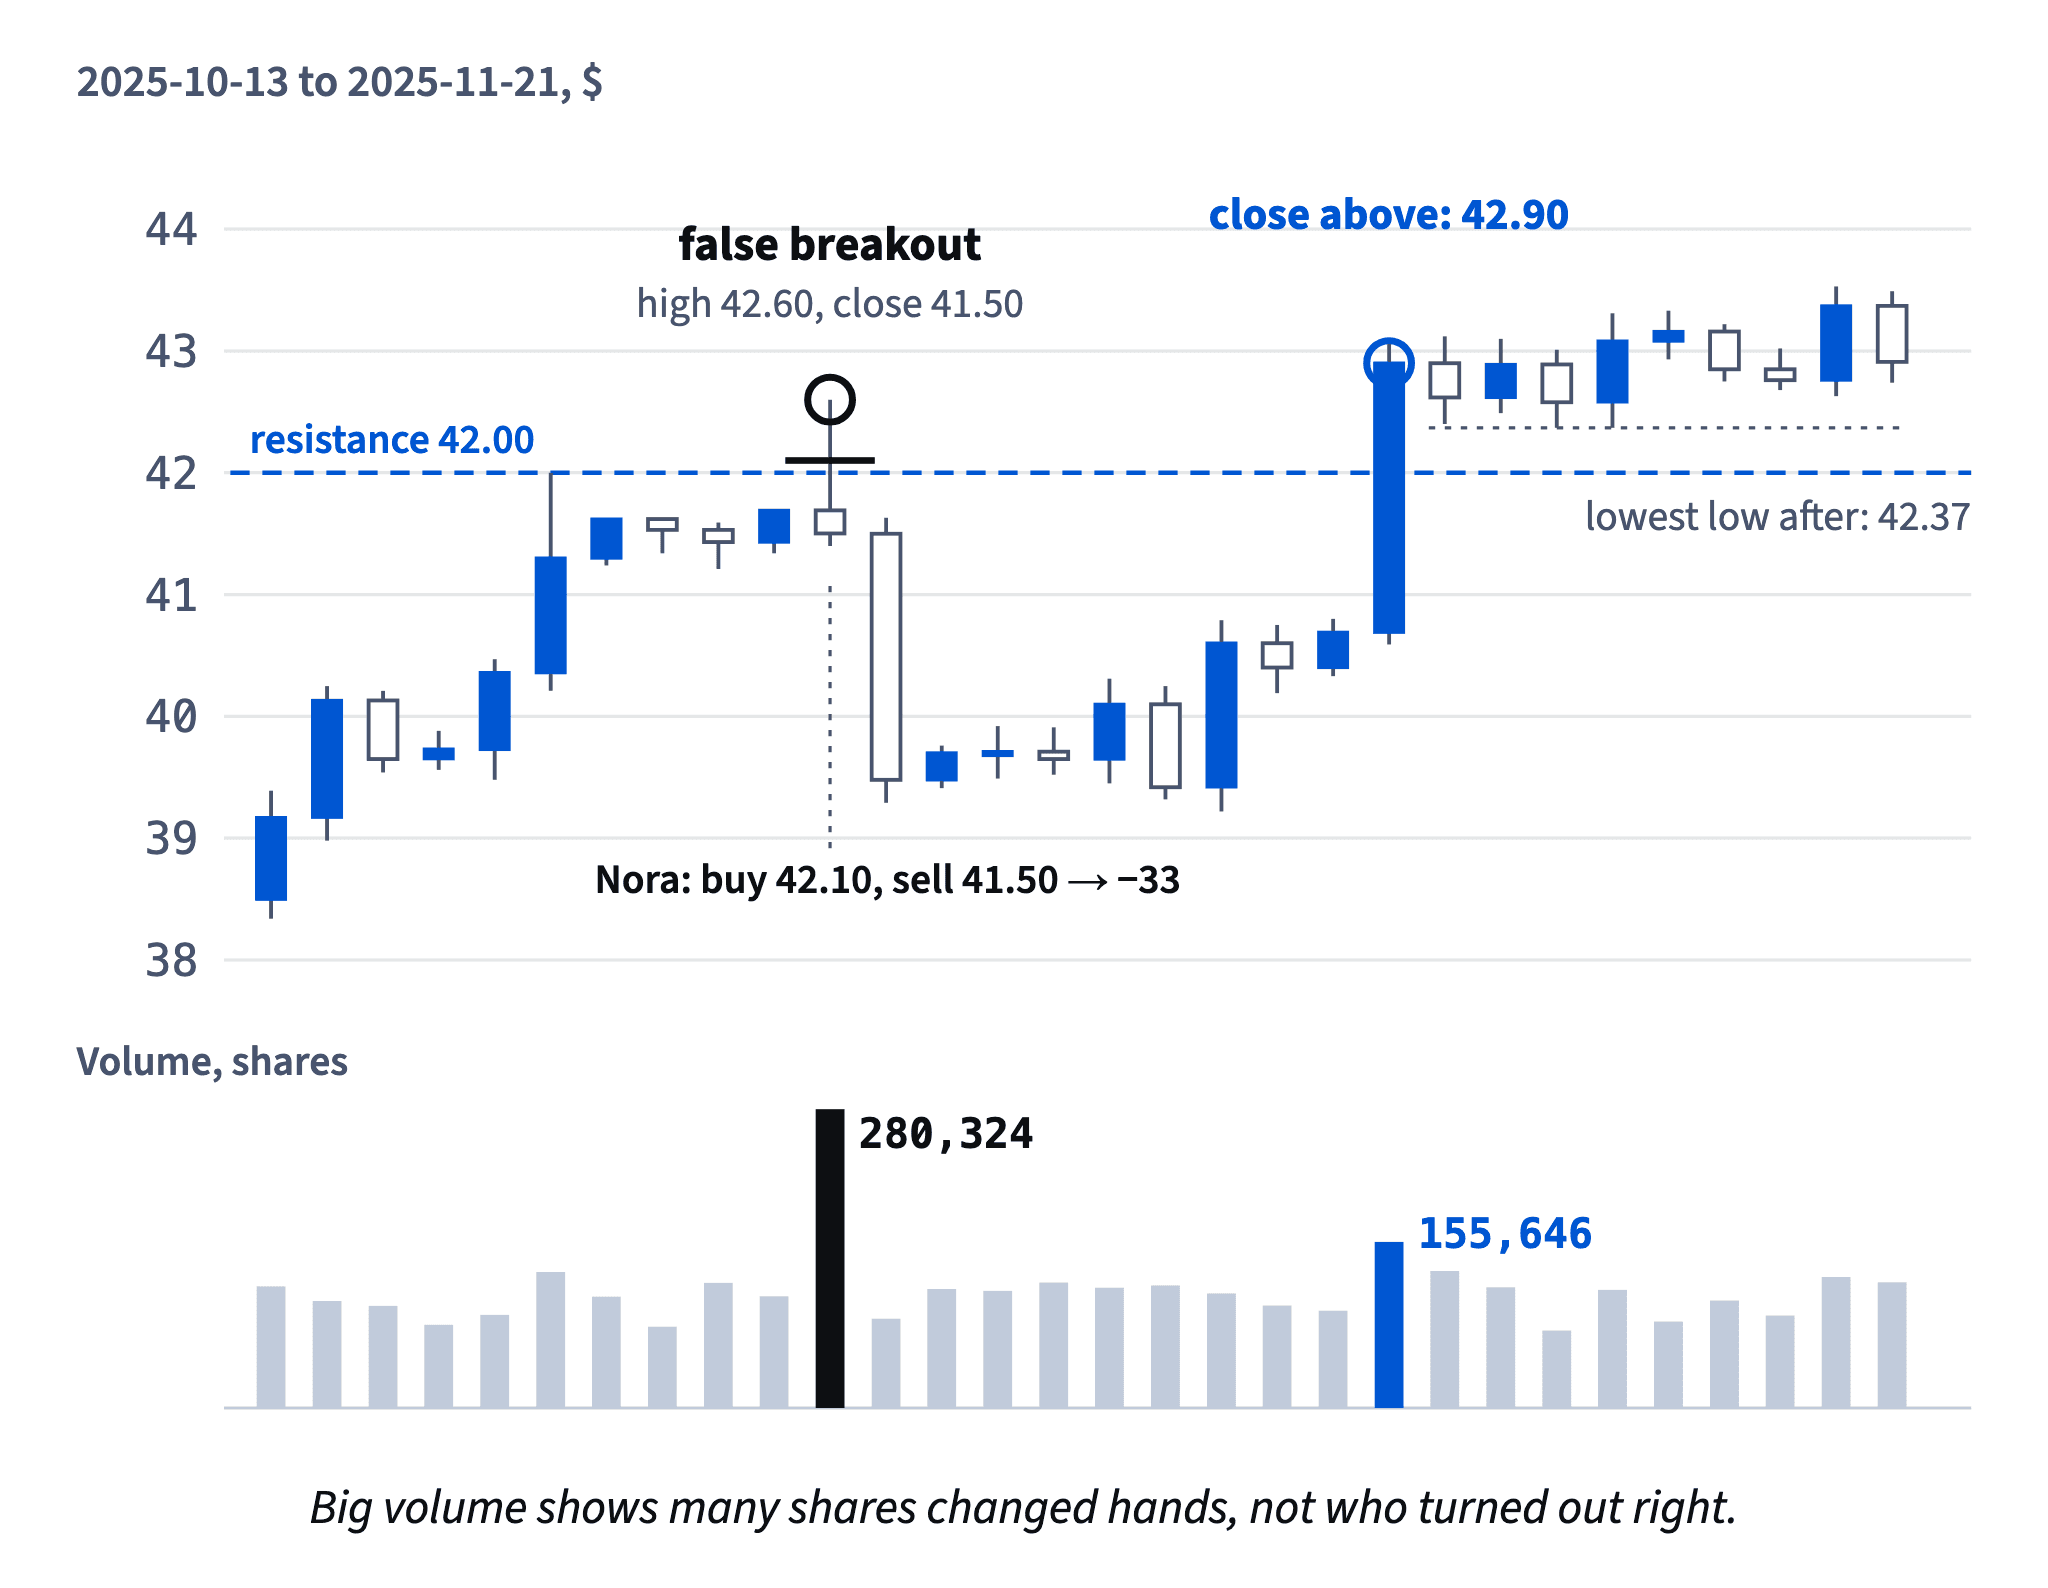
Big volume tells you many shares changed hands and many people cared about that day. It doesn't tell you who turned out right: every share bought by an eager breakout buyer was sold by someone who thought the price would fall back. Evidence that volume reliably separates real breakouts from false ones is weak.
Note volume in your journal if you like; just never let it overrule where the day closed.
- Do"Volume was huge on 2025-10-27, and the day still closed back inside."
- Don't"Three times the usual volume, so the breakout is real."
That exact day was the false breakout.
A level gives your plan a place to be wrong
If levels don't forecast, what are they for? Planning. A level tells you where your reason for a trade would stop being true.
Say a plan buys Bluefin Energy at 38.40 because support at 38.00 held. The reason is "the floor holds". A close clearly below the 38.00 zone means the floor didn't hold, so the idea is wrong. That's where a stop can go, as in The stop: where it goes and why: a little beyond the zone, not on the round number where every wobble touches it.
The same works on the other side. A plan built on a breakout above 42.00 is wrong if the price closes back inside the box, like it did on 2025-10-27.
Once you know where you'd be wrong, the distance from entry to stop sets the position size, as in Position size from risk and stop. The level doesn't make the trade good; it makes its loss known in advance.
- Do"Bought on support at 38.00; a close below about 37.80 means I'm wrong."
- Don't"Support will hold, so I don't need a stop."
What a level can and can't tell you
Put the lesson's pieces side by side and a level's job becomes narrow and clear.
A level can tell you where the price turned before (38.00 and 42.00 on Bluefin Energy), and give a plan a reference for where it would be proven wrong, which is where a stop can go.
A level can't tell you that the price will turn there again, on which day a breakout will come, or whether a breakout will last. On 2025-10-27 the price went through 42.00 and fell back; on 2025-11-10 it went through and stayed. The same line was there both times.
Chart: Bluefin Energy, daily high, low and close · shown above
That's why the evidence for levels as predictors is weak, and why a plan built on one still needs a stop, a sensible size and costs counted in.
How it fits together: support and resistance mark where a range turned; breakouts leave it, false ones come back; a close rule and volume help little on one example. Next, the module case puts candles, trend and levels together on one chart and turns them into a written plan.
- Do"Resistance at 42.00 was where it turned; my plan says what happens if it doesn't."
- Don't"It's at resistance, so it will turn down now."
On 2025-11-10 it went straight through.
Ready to practise?
Answer the lesson's exercises and earn 250 points the first time you finish it.
Start the exercises