

Theory
Backtest basics and traps
Test a rule on past prices and see the traps: one lucky period, hindsight, too many tweaks and missing failures.
~9 min read · 9 exercises · 250 points
Before you start
Nine trades, eight winners
Back on your Pebble practice account, Nora has done something sensible: she tested a rule on Bluefin Energy's past prices before trading it. Nine trades, eight winners, a solid profit after costs.
Your plan from the last lesson is meant to be tested, so today you'll see how such tests can fool you. You'll look at every trade the rule made over nine months and find the traps that make a rule look better on old prices than it will be.
A backtest: the rule on past prices, the whole series, costs in
A backtest runs a written rule on past prices as if you had traded it then: every entry, every exit, every cost. It is cheap, it needs only a price table, and it is the first honest look at a rule that has passed the checkability test from A one-page trading plan.
Two habits make it honest. Run the rule on all the prices you have, not on the stretch you like. And include costs on every trade, because a rule that wins a little per trade can lose once costs are in.
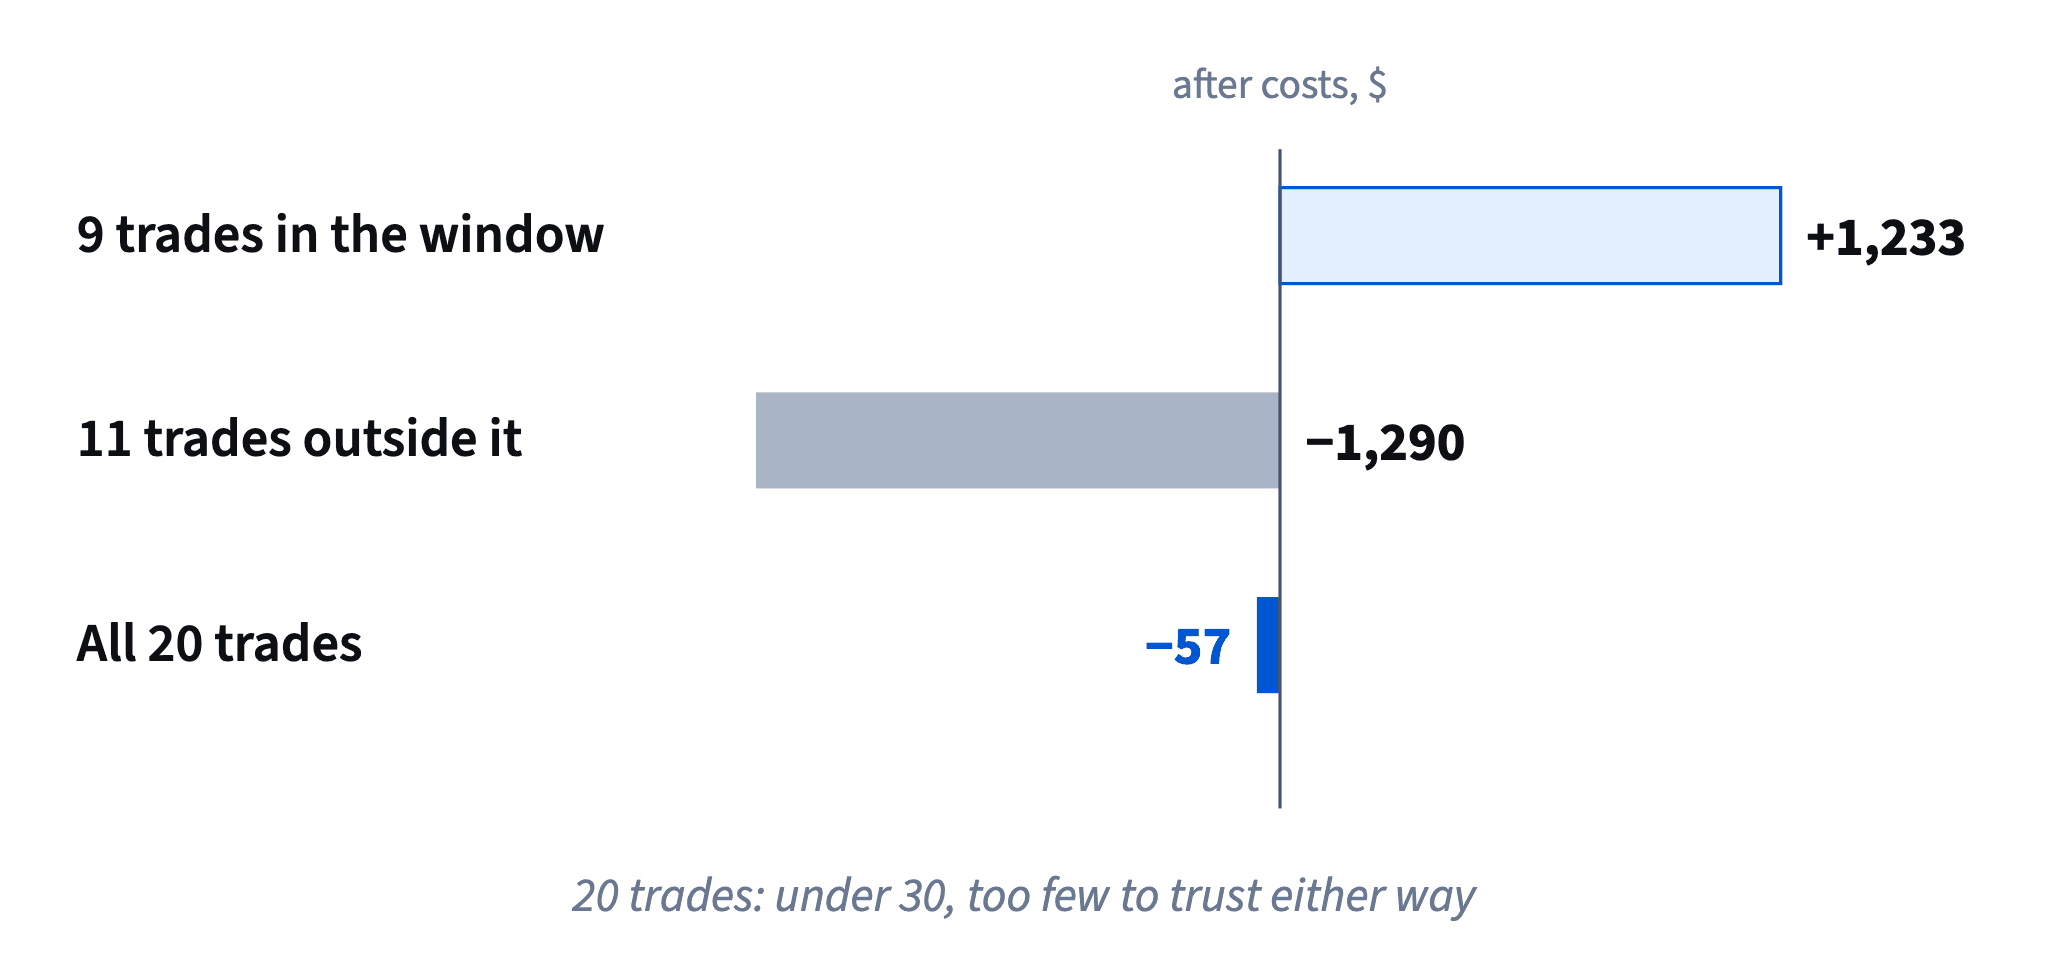
Nora's rule on Bluefin Energy shows both. Her 9 trades from February to April made +1,233 after costs. All 20 trades from January to September made −57: before costs only +23, and 20 round trips at 4.00 each cost 80.
Dataset · 20 rows
Every trade of Nora's rule
100 shares per trade, 4.00 of costs per round trip; result is after costs. in_test_window = yes marks the trades Nora tested.
First 5 of 20 rows
Every backtest result is then followed by one question: what could be wrong with this test? A good number is where the checking starts, not where it ends.
- Do"All 20 trades, January to September, 4.00 of costs each: −57."
- Don't"9 trades, 8 winners, +1,233. Proven!"
A slice of the series, read as the whole.
Outside the window: the same rule, a different market
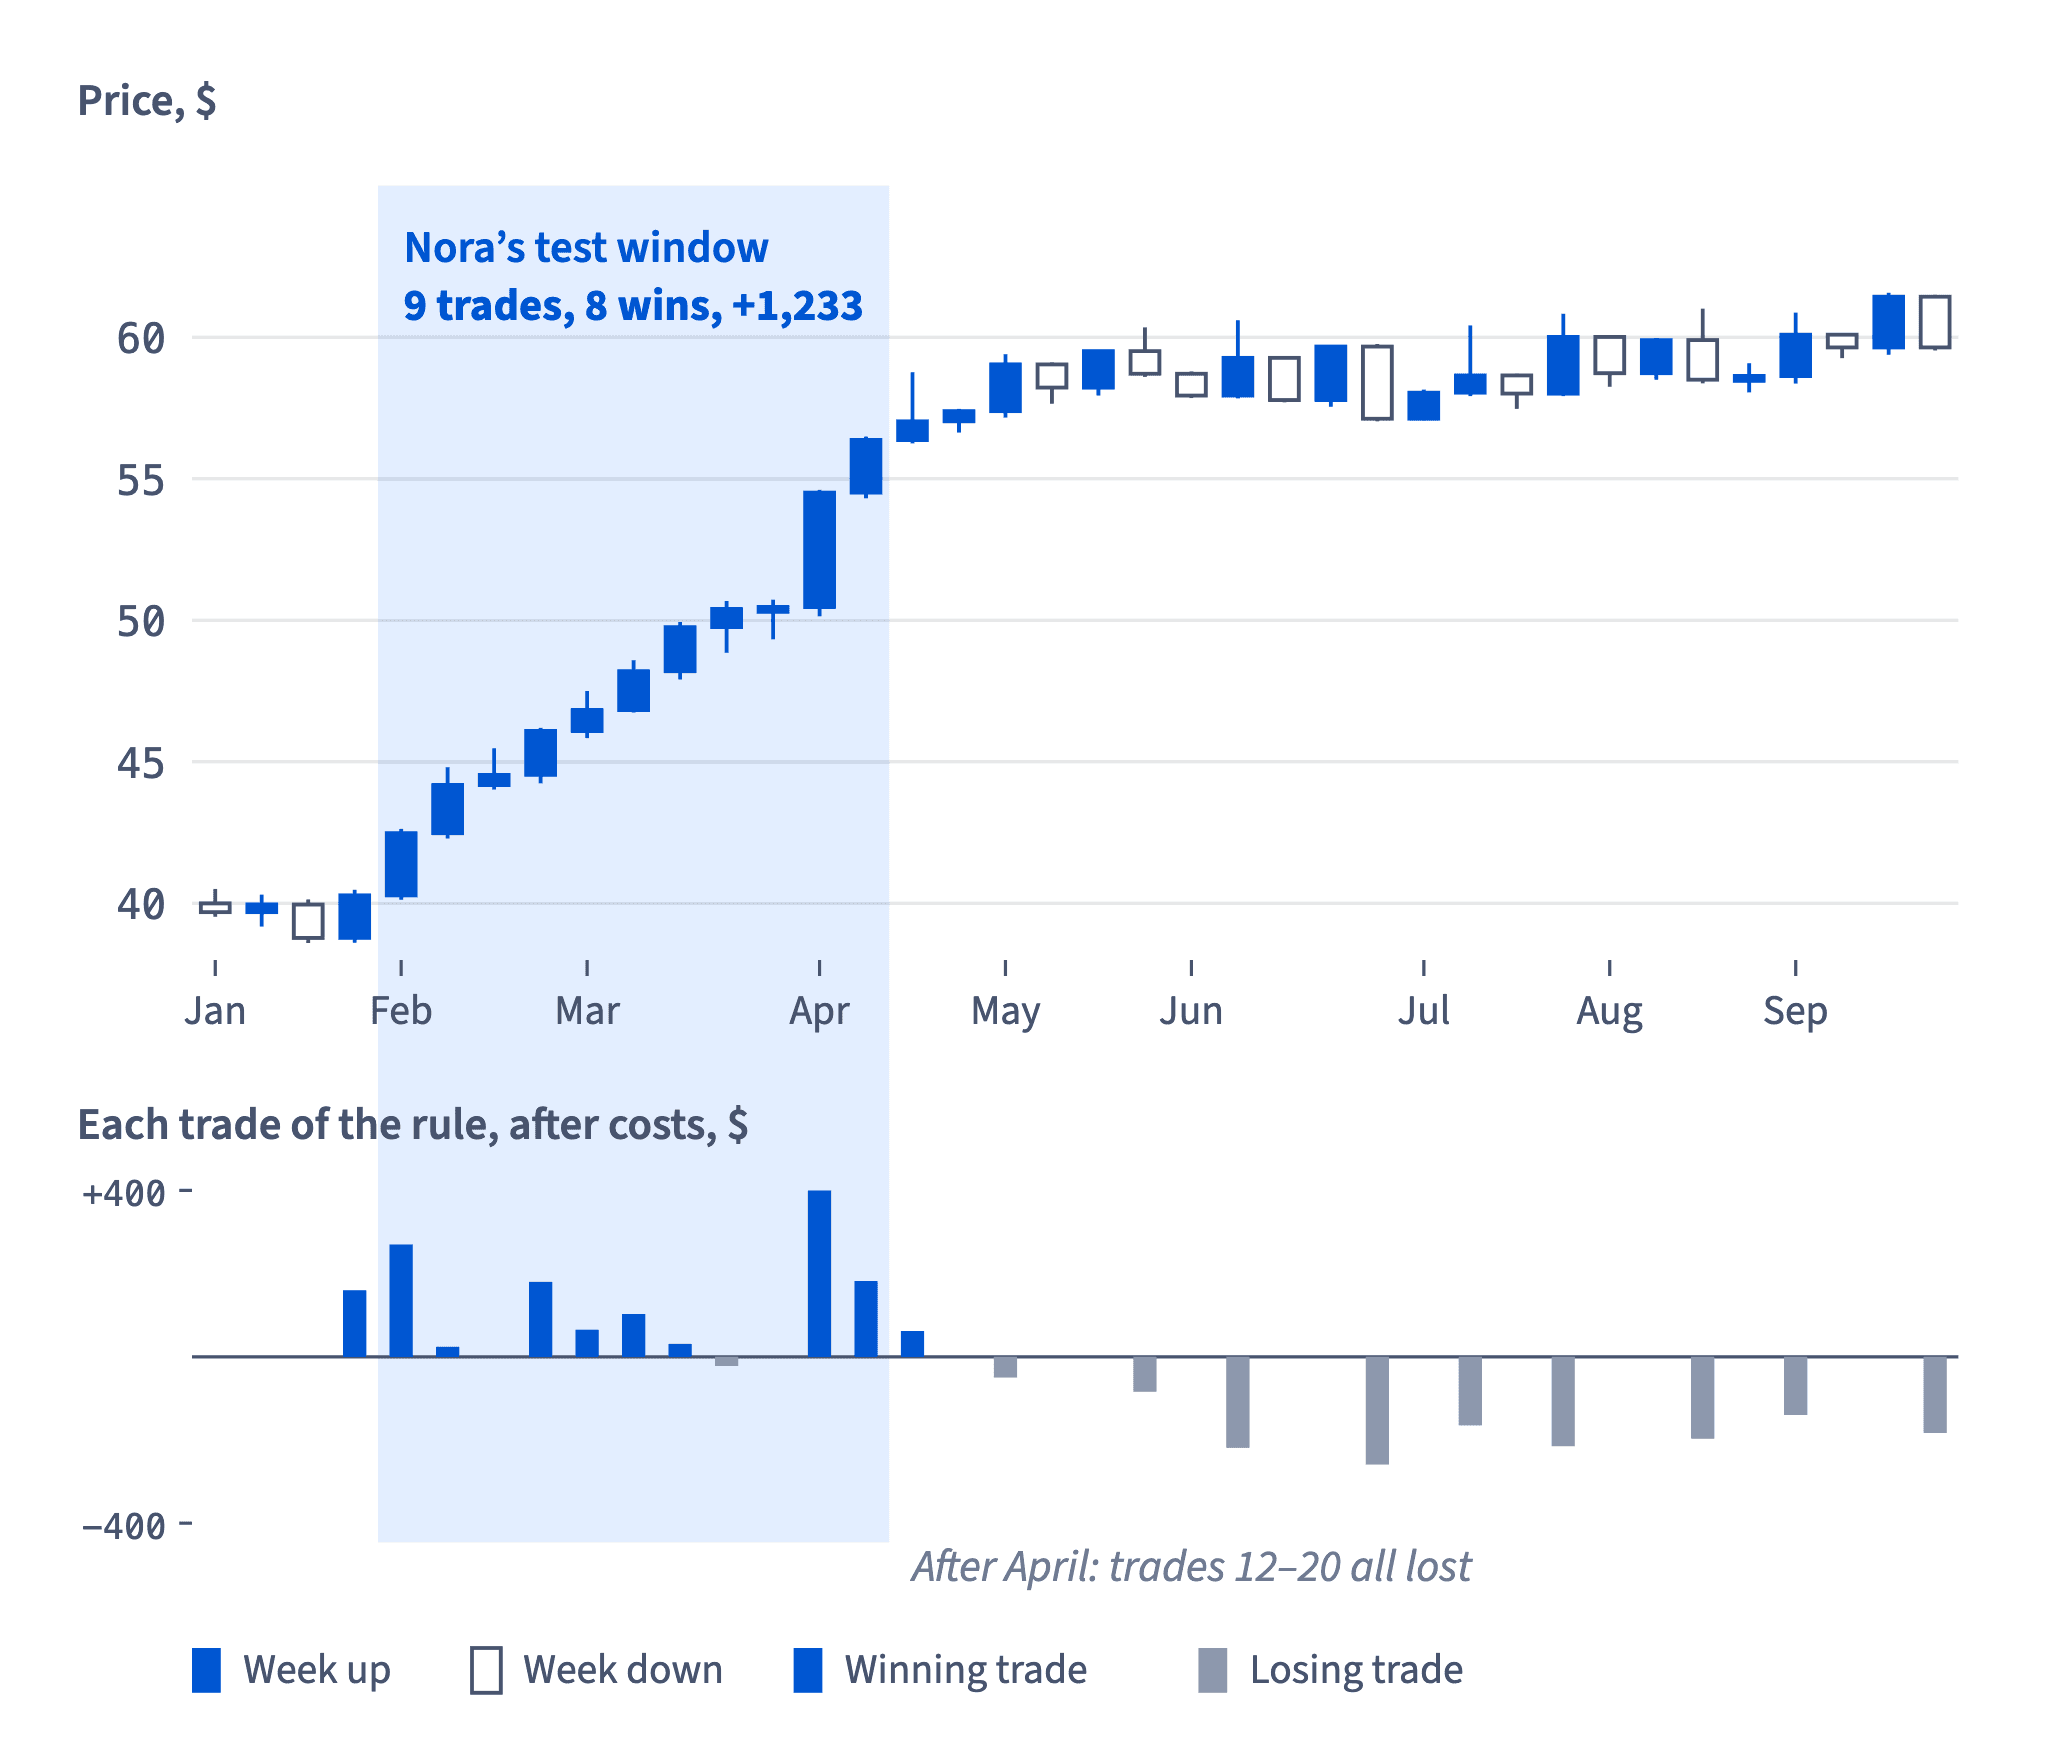
The trades outside Nora's test window tell the rest of the story. Trade 1 (+160) and trade 11 (+62) sit just before and just after the climb. Trades 12 to 20, from May to September, all lose, from −50 to −259. Together the 11 trades outside the window make −1,290.
Nothing about the rule changed in May. The market did. After April Bluefin stops trending and moves sideways: it pokes to a new 10-day high, then gives it back, like the false breakouts in Support, resistance and breakouts in module 5. A rule that buys every new high buys each poke at its top.
Notice the count too. The whole series has 20 trades. Under 30 is too few to trust a result either way, good or bad, so even −57 is not a verdict. It only says that the window's +1,233 came from the trend, not from the rule.
- Do"In the sideways months the rule bought 9 pokes to a new high and lost on all 9."
- Don't"May to September was just bad luck; the real rule is the February one."
Keeps the part that agrees, drops the part that doesn't.
Trap 1: one lucky period
The first trap is testing a rule on one stretch that happens to suit it. From 3 February to 18 April Bluefin climbed from about 40 to 56. In a steady rise almost any "buy" rule wins: buy on a new high, buy on a dip, buy on Mondays. The test then measures the trend, not the rule.
A trend-following rule and a range are a bad pair, and every market has both. So a fair test covers several kinds of market: a rise, a fall and a sideways stretch, as in Trend and range in module 5. If the rule makes money only in one of them, write that down as its limit; it is useful knowledge, not a failure.
A quick check on any test you see: what was the price doing during the test window? If the answer is "going up the whole time", the result says little about a buy rule.
- Do"Tested on January to September: the climb, the top and the sideways months."
- Don't"Tested on February to April, when Bluefin went from 40 to 56."
A buy rule in a steady rise measures the rise.
Hindsight: choosing the test after seeing the answer
Hindsight means choosing how to test after you have already seen the answer. Nora picked February to April "because that's where the chart looked nice". The chart looked nice because the price was rising, so the test was decided by the result it was meant to check.
The cure is a little discipline before you look:
- choose the period in advance, for example "all of 2025", and use all of it, sideways months included;
- split it: build and adjust the rule on the first part only;
- keep the last part untouched and run the finished rule on it once, as the final check.
The untouched part works only if it stays untouched. Peek at it, adjust, and run again, and it becomes one more part you fitted.
Costs, fills and trade counts are separate checks; none of them repairs a period chosen with hindsight.

- Do"Period fixed in advance: January to September. Rule built on January to June, checked once on July to September."
- Don't"I tested it on the months where the chart looked nice."
The answer chose the test.
Trap 2: overfitting, a rule bent to fit the past
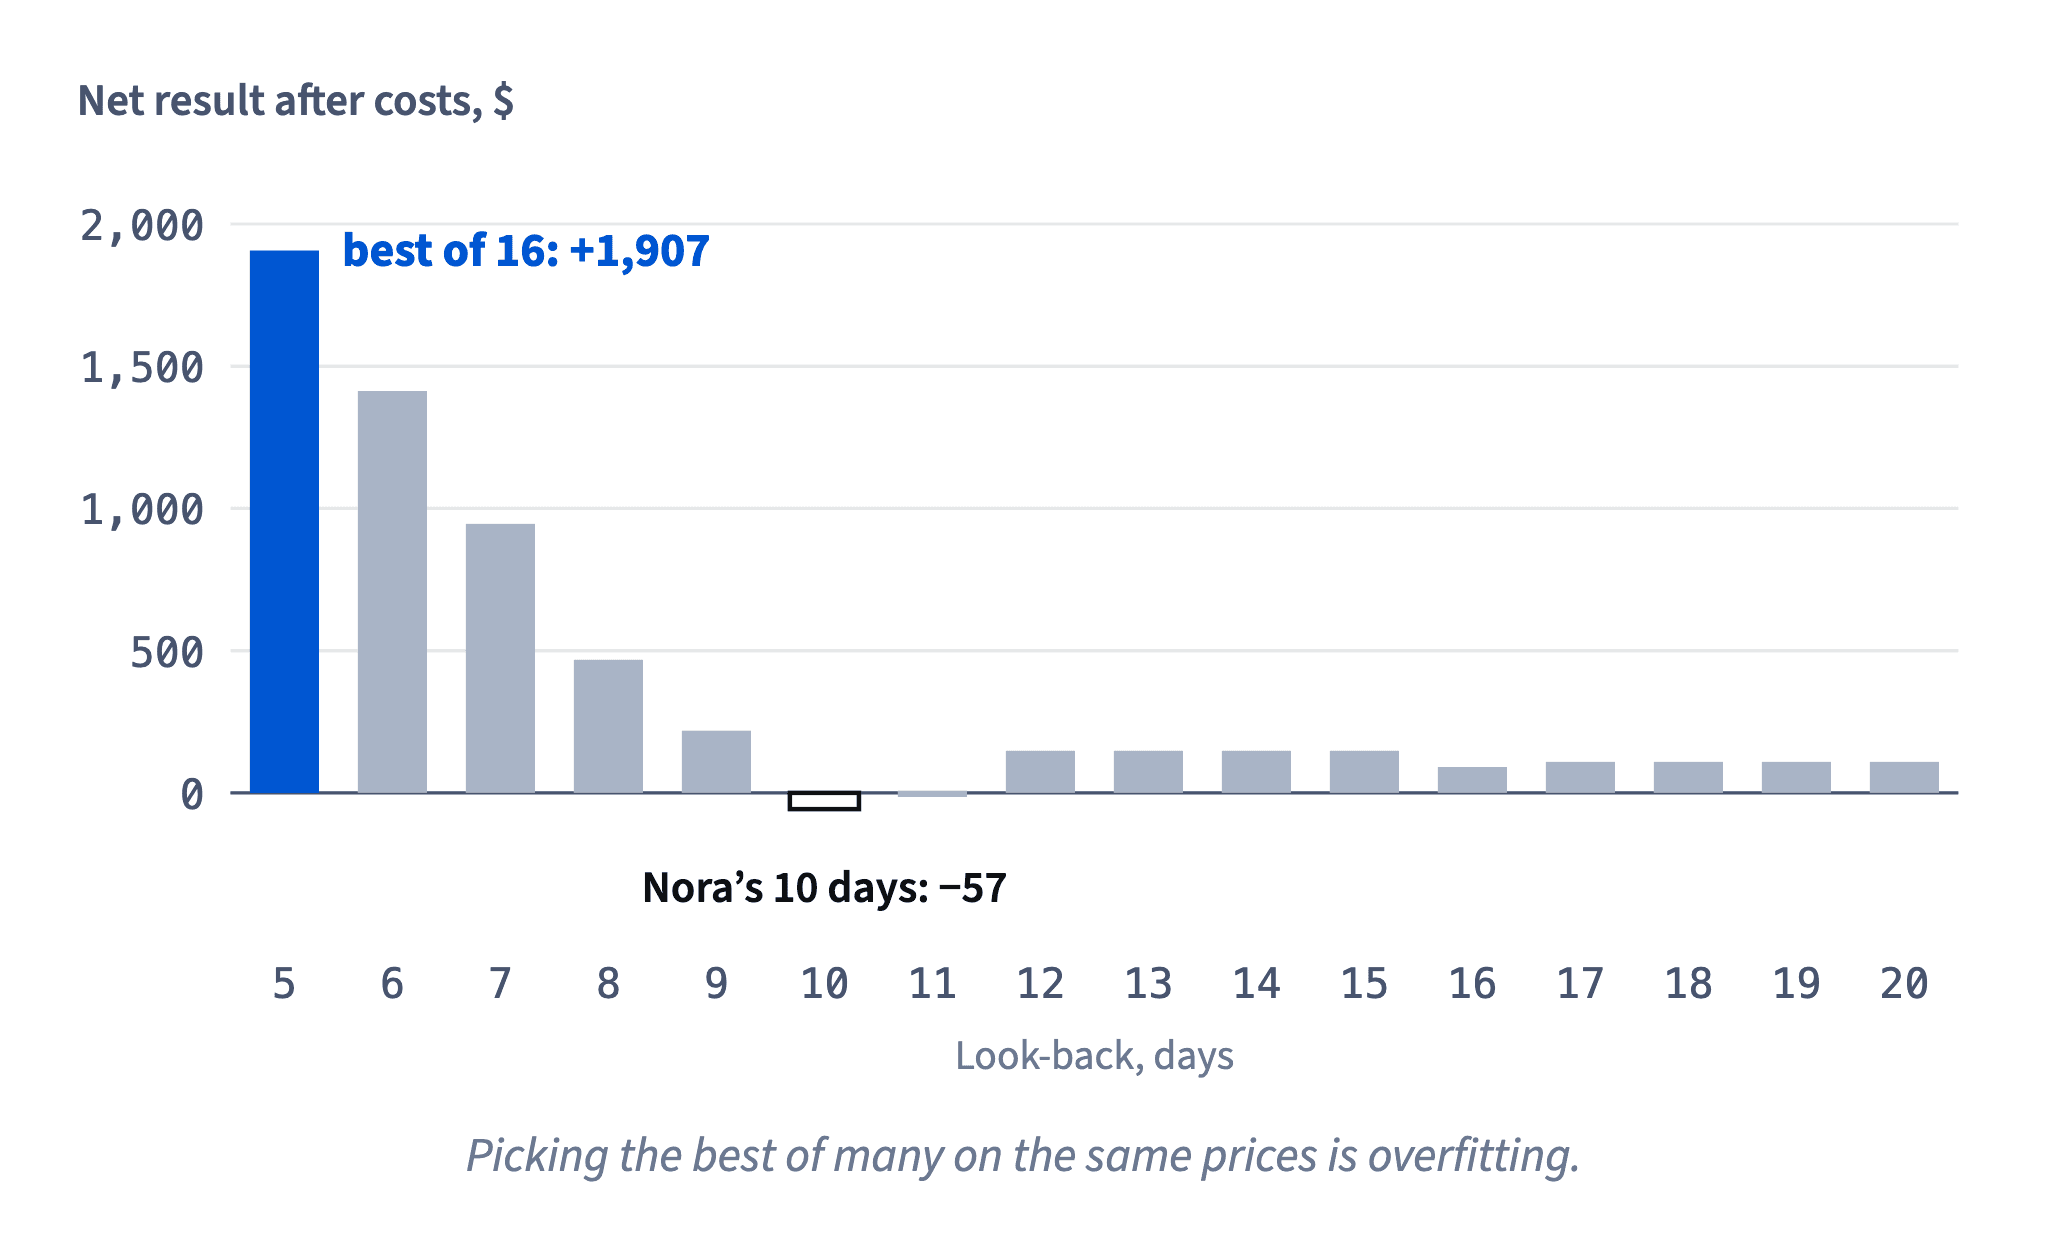
Overfitting means adjusting a rule until it fits one particular past, noise included. The usual route: try many versions on the same prices and keep the best. Nora tried every look-back from 5 to 20 days; the 5-day version made +1,907, while her original 10-day version made −57.
Nora's rule · shown above
Dataset · 16 rows
The same rule with 16 look-backs
Same prices, same costs; net_result is after costs.
First 5 of 16 rows
The best of many is partly luck. With enough versions, one will always look great on any price series, because it happens to match that series' random wiggles. Those wiggles won't repeat.
Signs to watch for:
- many versions tried, only the winner shown;
- very exact settings ("5 days, a 2.3% stop, only on Tuesdays");
- most of the profit from one short stretch.
Simple rules with few settings overfit less. And the honest step after any search is the one from the hindsight card: run the chosen version once on prices nobody has looked at. If it falls apart there, it was fitted, not found.
- Do"One look-back chosen on January to June, then run once on July to September."
- Don't"I tried 16 look-backs on this year and kept the one that made +1,907."
The winner of a search on the same data is partly luck.
Read the whole table, not the winner
When someone shows you the best of many versions, ask for the rest of the list. Nora's table has 16 look-backs on the same Bluefin prices and the same costs. The best, 5 days, made +1,907. The average of all 16 is 6,023 ÷ 16 ≈ 376, and the middle of the list sits around +148.
Dataset: The same rule with 16 look-backs · shown above
So the winner is about five times a typical version. That gap is the part of +1,907 you should expect to lose on new prices: it comes from fitting this year's wiggles, not from the idea.
The shape of the table matters too. The results fall smoothly from 5 days to 10, then stay flat. That says the shorter look-backs mainly caught more of the one February–April climb, the trap from the first card of this lesson in a new form.
A fair summary of a search reports the typical result and how widely the versions differ, not the top line.
- Do"16 look-backs: best +1,907, average about +376, ten of them under +150."
- Don't"My rule makes +1,907 a year."
Quotes the winner of a search as the rule's result.
Trap 3: survivorship bias, the missing failures
The last trap hides in other people's tests. A forum post lists "ten rules that beat the market for five years". Which rules could make the list? Only the ones still running. The rules that blew up were quietly dropped, so the list shows survivors and calls them typical.
That is survivorship bias: you see only what survived. Lists of "the best funds of the decade" work the same way, because funds that closed simply vanish from the table, so the average looks better than anyone's real result. Often the person sharing the list doesn't even know the failures are missing.
The question that fixes it: how many started, not just how many are left? Ten winners out of ten is impressive; ten out of five hundred is what luck alone would produce.
Together with one lucky period, hindsight, overfitting and too few trades, it makes five ways a test can look better than the rule really is.
- Do"How many rules were on this list five years ago, and what happened to the rest?"
- Don't"Ten rules, all winners for five years: following one of them is safe."
The failures were removed before you saw the list.
Perfect fills and the checklist after every backtest
In a backtest every order fills exactly at the price in the table. Real orders don't: market and stop orders slip by a little, and a morning gap can open straight past a stop, as the slippage and gaps from modules 1 and 3 showed. So a real result usually comes out a bit worse than the backtest, so experienced traders such as Marc trim every result before trusting it.
That completes the questions that follow every backtest result:
- costs in? whole period, chosen in advance?
- how many versions tried? one run on unseen prices?
- at least 30 trades? any failures missing?
- fills you could really get?
A rule that passes all of them is not proven, only not yet disproven. The past doesn't promise the future.
How it fits together: a backtest is cheap evidence, and each trap makes it look better than the rule is. A rule that survives the checklist earns the next step: trading it small on a practice account and recording every trade in a journal.
- Do"Backtest +600 after costs on 40 trades; I plan on less, because stops can gap and fills slip."
- Don't"The test shows the stop was hit at exactly 48.00 every time, so my loss is capped at that."
A gap can open below the stop.
Ready to practise?
Answer the lesson's exercises and earn 250 points the first time you finish it.
Start the exercises