

Theory
Mean, median and mode: the typical value
Mean, median, mode and trimmed mean on real-looking CatChow orders: what each one answers, why one bulk order can fool the average, and how not to average averages.
~11 min read · 11 exercises · 250 points
Before you start
Where you work
You've just joined the product team at CatChow, a small online shop of about thirty people that sells cat food, treats and litter and delivers them to the door. Its dashboards are full of averages, rates and charts, and different people read them in different ways.
In this course you'll learn to read those numbers honestly: describe data, compare groups, run A/B tests you can trust and say how sure you are. This first lesson answers the most common question in any meeting, what counts as a typical value, with the mean, the median, the mode and the trimmed mean.
Mean or median: which one is typical?
A measure of central tendency is one number that stands for a whole set of values. The two you'll use most often answer different questions.
- The mean adds everything up and shares it equally. It reacts to every value, including the extreme ones.
- The median sorts the values and takes the middle one. Half the values are below it, half above, and a few extreme values barely move it.
Most product data has a long right tail: page loads, session lengths, order values, revenue per user. A small share of very large values pulls the mean up, while the median stays with the bulk of the data. So when the question is what does a typical user experience?, the median is usually the honest answer.
The extremes don't disappear, though. If 3% of page loads time out, that deserves its own metric, such as the share of loads slower than 5 seconds, rather than being hidden inside an average.
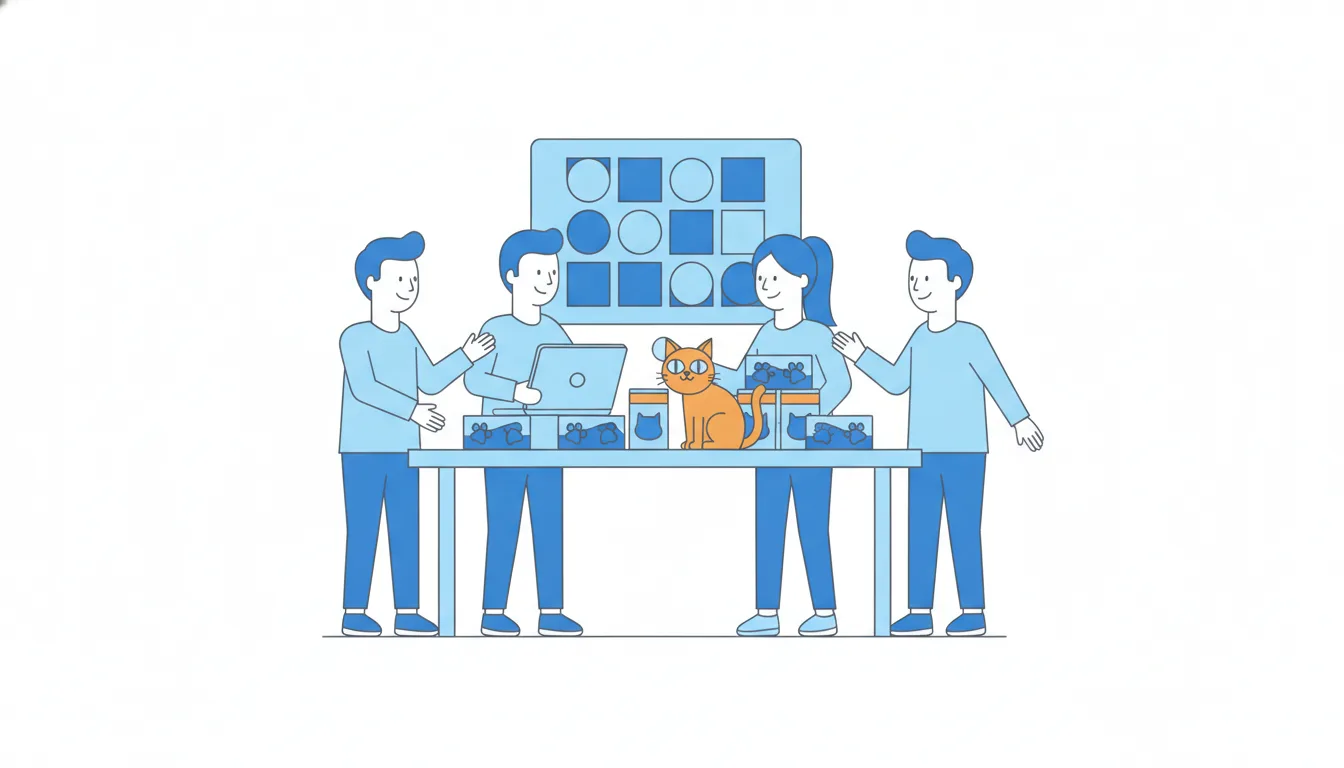
- Do“A typical product page loads in 1.4 s (median); 3% of loads time out.”
Median for the typical case, a separate metric for the tail.
- Don't“Our pages load in 2.3 s on average, so speed is fine.”
The mean blends the timeouts in and hides them at the same time.
When the mean sits above the median
The median is the middle of the sorted values: half of the data lies below it, half above. That makes the gap between mean and median easy to read.
If the mean is above the median, a few large values are pulling the mean up. The data has a long right tail, and more than half of the values sit below the mean. CatChow's week is a clear case: a mean of $45, a median of $32, and 16 of the 20 orders below $45, because one $284 bulk order lifted the mean.
Chart data
| Order value, USD | Orders |
|---|---|
| 10–19 | 1 |
| 20–29 | 7 |
| 30–39 | 7 |
| 40–49 | 4 |
| 50–279 | 0 |
Show 1 more row
| 280–289 | 1 |
Dataset · 20 rows
CatChow orders, 14–20 September
20 orders placed in one week. Synthetic data made for this course.
First 5 of 20 rows
If the mean is below the median, the opposite happens: a few very small values drag it down. If the two are close, the data is roughly balanced and either number will do.
This gives you a cheap check for any dashboard: put the median next to the mean. A large gap means "look at the extremes before you trust the average". It also means the mean is a poor description of a typical customer, because most customers are below it.
- DoMean $45, median $32: “most orders are below the average; a few big ones pull it up.”
Reads the gap as a sign of a right tail.
- Don'tMean $45, median $32: “most customers spend more than $45.”
Half the orders are below $32, so this can't be true.
Match the measure to the question
There is no single best average. Each measure answers its own question, so start from the question:
- Mean: how much in total? Only the mean links to totals (mean × count = total), so use it for revenue forecasts and budgets. 400 orders at a $45 mean is $18,000.
- Median: what does a typical case look like? Use it for skewed data such as days to first order, where a few users take almost a year.
- Mode: which category is the most common? It's the only measure that works for categories like flavours or plans, because you can count "salmon" but you can't average it.
- Weighted mean: how do I combine rates from groups of different size? Big groups must count more.
- Trimmed mean: I want a mean that ignores a few freak values at both ends.
If a histogram shows two peaks, for example households and cat shelters, no single typical value describes either group. That is a hint to split the data into segments.
- Do“Most popular flavour: salmon (mode, 41% of orders).”
A category gets the mode.
- Don't“Next month's revenue = 400 orders × median order ($32).”
The median doesn't link to totals; this forecast misses the big orders.
How to find the median
The median needs one piece of real work: sorting. Arrange the values from smallest to largest, then find the middle.
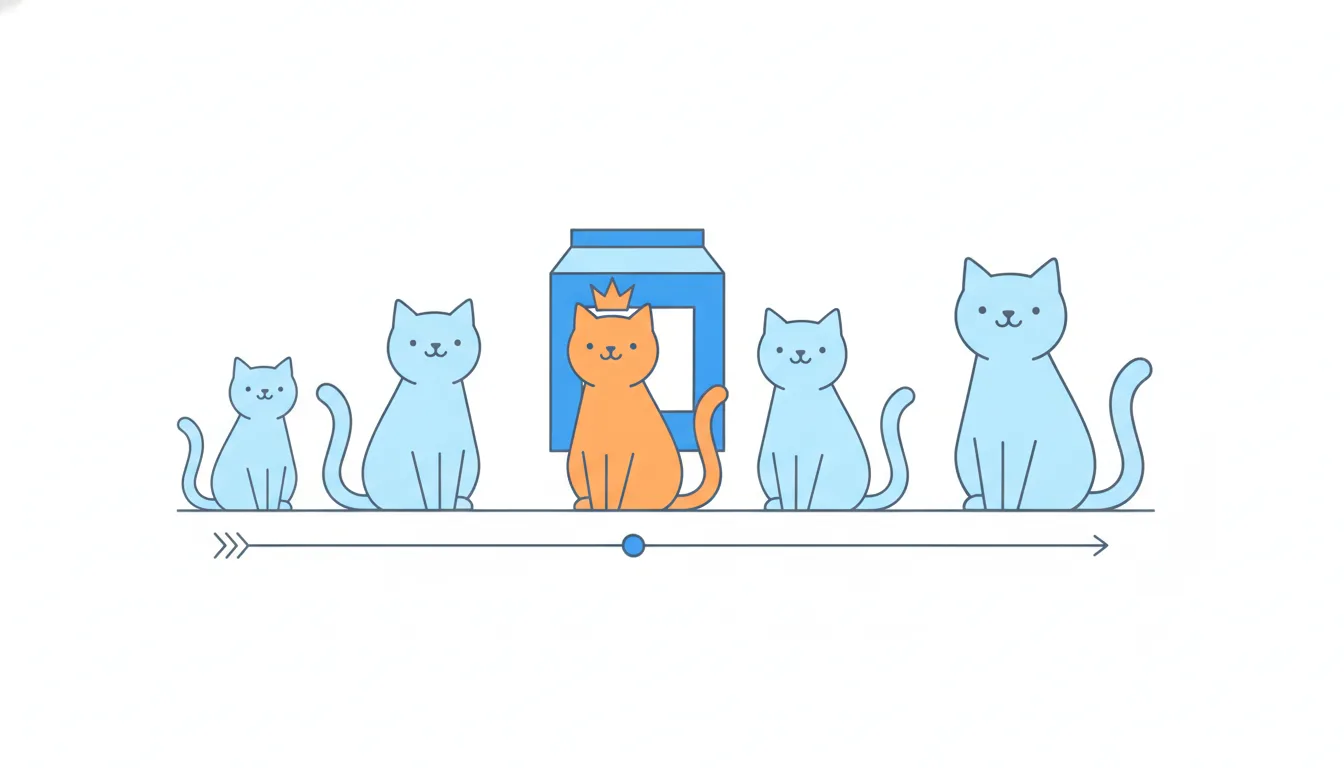
- With an odd number of values there is one middle value. For 7 values it is the 4th, for 19 values the 10th.
- With an even number there are two middle values, and the median is their mean. For 20 values these are the 10th and the 11th.
CatChow's 20 orders, sorted, have $31 in 10th place and $33 in 11th, so the median is (31 + 33) / 2 = $32. A median can be a value that no order actually had; that's normal.
In Sheets or Excel, =MEDIAN(range) sorts for you. By hand, the two classic slips are taking the middle of the unsorted list and averaging the smallest and largest values. The second one is not a median at all: it is the midpoint of the range, and one extreme order moves it a lot.
- DoSort the 20 orders → 10th = 31, 11th = 33 → median = (31 + 33) / 2 = 32.
Sort first, then average the two middle values.
- Don't(18 + 284) / 2 = 151
That's the midpoint of the range, not the median.
How one extreme value moves the mean
Because the mean shares the total equally, every value pulls on it in proportion to its size. To see how much one value matters, remove it and recompute.
CatChow's week: $900 across 20 orders, a mean of $45. Remove the $284 bulk order a cat shelter placed and two things change at once: the total drops to 900 − 284 = $616, and the count drops to 19. The new mean is 616 / 19 ≈ $32.42. One order out of twenty was worth more than $12 of the mean.
The median reacts very differently: it moves from $32 to $31, because only the position of the middle shifts. That's what statisticians mean by the median being robust and the mean being sensitive.
One order, two very different reactions
Here is the clearest way to see the difference. Remove the shelter's order and recompute:
One order out of twenty moved the mean by more than $12 but moved the median by $1. We say the median is robust: a few extreme values barely affect it. The mean is sensitive: it reacts to every single value, including the weird ones.
Neither behaviour is "better". If the question is how much revenue did we make?, the shelter's $284 is real money and belongs in the answer, so you want the mean. If the question is what does a normal customer put in the basket?, the shelter is not a normal customer, so you want the median.
Neither is wrong. If you're asking how much revenue came in, the $284 is real money and belongs in the mean. If you're asking what a normal basket looks like, the shelter is not a normal customer, and the mean without it, or the median, tells the truer story.
- Do(900 − 284) / 19 = 616 / 19 ≈ 32.42
Both the total and the count change.
- Don't(900 − 284) / 20 = 30.80
Removes the order from the total but still divides by 20.
What the mean can and can't do
The mean (arithmetic mean) is the sum of the values divided by their count. Four properties follow from that one definition.
- It uses every value. Nothing is ignored, which is its strength when every value counts, for example in revenue.
- It is tied to the total. Mean × count = total, always. That's why forecasts and budgets are built on means.
- One extreme value can move it a lot. Because every value is shared out equally, a single $284 order lifts CatChow's mean from about $32 to $45.
- It is often not a real value. The mean is a calculated share: the average family can have 1.7 cats, and no order last week was exactly $45.
And one thing it can't do: work with categories. Flavours, plans and countries can't be added up, so they have no mean. Count them and report the most common one, the mode. If someone shows you an "average flavour", the categories were probably coded as numbers and averaged by mistake.
- Do“400 orders × $45 mean ≈ $18,000 of revenue.”
Uses the link between mean and total.
- Don't“The average flavour code is 2.4, so customers lean towards chicken.”
Category codes are labels, not quantities.
Averaging averages: use a weighted mean
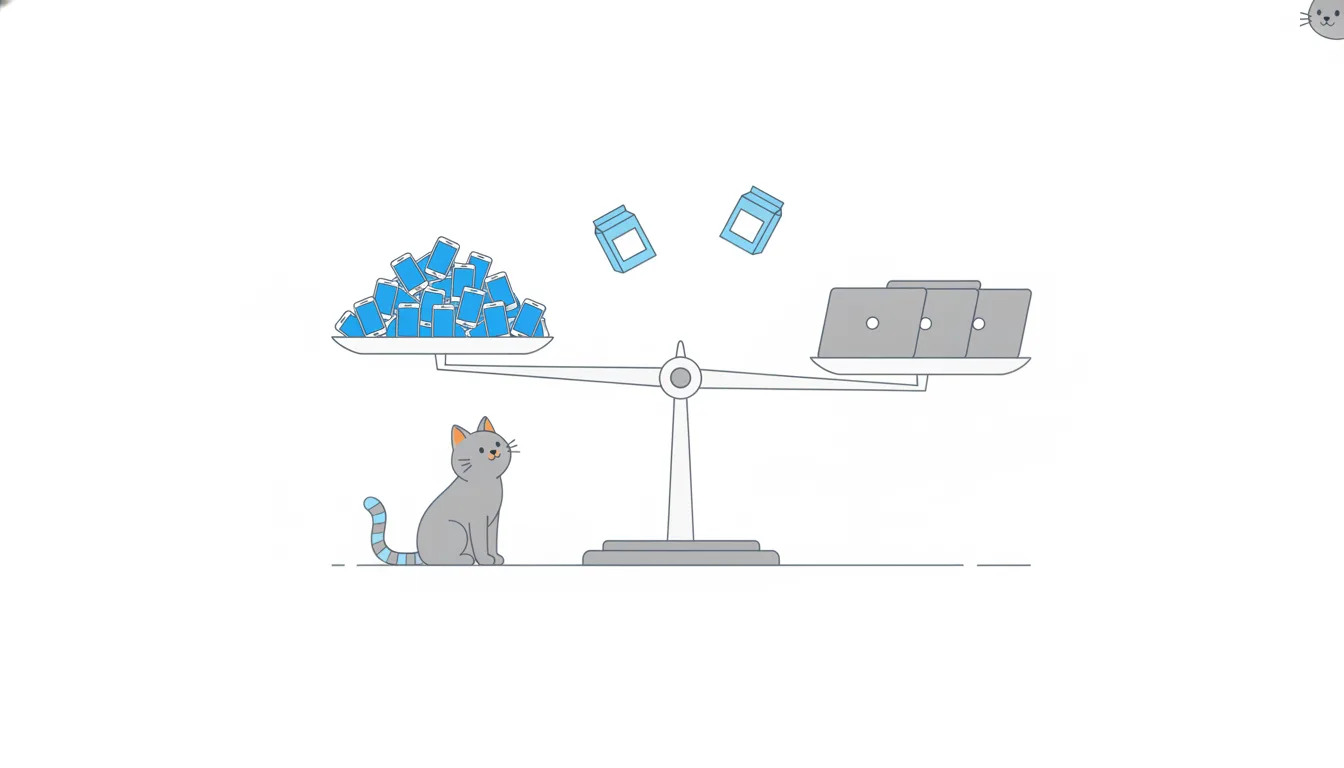
When you combine rates or averages from groups of different size (channels, devices, countries, cohorts), a plain average of the group values is almost always wrong. A small group gets the same say as a big one.
The fix is a weighted mean: each group counts in proportion to its size. The simplest way to get it is to go back to the raw counts.
- Turn each rate into a count: 1,500 sessions × 4% = 60 orders; 4,500 × 1% = 45 orders.
- Add up the counts: 60 + 45 = 105 orders from 1,500 + 4,500 = 6,000 sessions.
- Divide: 105 / 6,000 = 1.75%.
The plain average, 2.5%, overstates the result because the small, high-converting channel gets half the weight. The weighted answer always lies closer to the bigger group's rate.
The same trap appears with average order values per country, ratings per product or retention per cohort. Whenever segments differ in size, weight them, or simply total the numerators and denominators and divide.
- Do(60 + 45) / (1,500 + 4,500) = 105 / 6,000 = 1.75%
Total orders over total sessions.
- Don't(4% + 1%) / 2 = 2.5%
Gives the small channel as much weight as the channel with three times the traffic.
Writing a typical value into a report
A report sentence is where the choice of measure becomes a claim. "A typical customer spends $45" sounds harmless, but if $45 is a mean inflated by a few large orders, it describes almost nobody.
A safe pattern has three parts:
- The typical value, usually the median for money and time: "a typical order is about $32".
- The mean, if totals matter, with its role made clear: "the average order is $45, which is what drives revenue".
- The reason for any big gap: "a few large orders, such as one $284 shelter order, pull the average up".
This keeps both numbers honest. The median tells product and marketing what a normal basket looks like; the mean tells finance what the total will be.
Watch the wording, too. "Average" in everyday speech usually means "typical", but in tools and dashboards it almost always means the mean. If you mean the median, say "median" or "typical", and name the measure next to every number.
- Do“Typical order $32 (median); average $45, lifted by a $284 bulk order.”
Both numbers, each with its role.
- Don't“Our customers usually spend around $45.”
Calls the mean “usual” when most orders are below it.
The trimmed mean
The trimmed mean is a compromise between the mean and the median. It behaves like a mean but doesn't let a handful of extremes run the show.
- Sort the values.
- Drop the same share from each end, often 5–10%.
- Take the ordinary mean of what's left.
With 10 orders and a 10% trim, you drop one order from the bottom and one from the top. For $12, $20, $22, $25, $27, $30, $31, $35, $40 and $190, that leaves 8 orders worth $230, so the trimmed mean is $28.75. The plain mean is $43.20, pulled up by the $190 order; the median is $28.50.
The trimmed mean lands near the median but still uses the actual values of most orders, not just the middle one or two. In Sheets or Excel, =TRIMMEAN(range, 0.2) does it; note that the function takes the total share to remove, so 0.2 means 10% from each end.
Trimming only one end is a different thing: it biases the result in one direction.
- DoDrop $12 and $190 → 230 / 8 = 28.75
The same share from each end.
- Don'tDrop only $190 → 242 / 9 ≈ 26.89
Trimming one end pushes the result down.
Ready to practise?
Answer the lesson's exercises and earn 250 points the first time you finish it.
Start the exercises