

Theory
Clustering for customer segmentation
Customer segmentation from the data: letting cluster analysis suggest the segments instead of guessing them.
~11 min read · 11 exercises · 250 points
Before you start
Segments from the data
You're still on CatChow's product team, and Marketing has dropped a new request on your desk: customer segments. The quick option is to guess three groups, say bargain hunters, regulars and big spenders, and call it done.
In this lesson you'll let the data suggest the groups instead: how cluster analysis differs from classification, how to measure how similar two customers are, and how the common clustering methods work.
Clustering versus classification
Both put customers into groups, but they start from opposite places.
- Classification starts with known, named groups. You have past customers labelled "churned" or "active" and want to predict the label for new ones. A model learns from the labelled examples; logistic regression is one such tool. You can check it against the true labels.
- Cluster analysis (clustering) starts with no labels at all. You don't know what the groups are, or even how many there are. The method gathers similar customers together and lets the groups emerge from the data. There is no "right answer" to score against; you judge the result by whether the groups are distinct, stable and useful.

A quick test: is there a column in your data that already says which group each customer is in? If yes, and you want to predict it, that's classification. If no, and you want to discover structure, that's clustering.
The two often work together. Segmentation might use clustering to discover four customer types, then a classifier to assign each new sign-up to one of them.
- DoLabels “churned / active” exist → classification.
- Don't“We have churn labels, so let's cluster customers to predict churn.”
Clustering ignores the labels you already have.
Known k or unknown k
The first question in any clustering project is: do you already know how many groups you want? The answer picks the method.
- Unknown number of groups → hierarchical clustering. It doesn't ask for a number up front. It merges customers step by step and records the whole history as a tree, so you can look at the structure first and decide afterwards how many groups make sense.
- Known number of groups → k-means. If leadership wants exactly two spend-based segments, or the marketing team can run exactly three campaigns, you set k and the method finds the best split into that many groups.
The two also differ in scale. Hierarchical clustering compares every pair of customers, so it suits hundreds or a few thousand records and is great for exploring. k-means is fast on hundreds of thousands, which is why teams often explore a sample hierarchically and then run k-means on everyone with the k they chose.
What fits neither situation: methods that predict a known label (like logistic regression) or compare group means (like a t-test). Those answer different questions.
- Do“No idea how many segments → start with hierarchical clustering, look at the tree.”
- Don't“No idea how many segments → k-means with k = 3, because three sounds right.”
Fixes k by guesswork.
Distance: similarity as a number
Clustering needs a distance metric: a rule that turns "how similar are these two customers?" into a number. Each customer is a point in the space of their metrics, here (monthly spend, orders per month).
- Euclidean distance: the straight line between two points. Square each difference, add, take the root: d = √Σ(x − y)². For A(100, 1) and B(120, 1): √(20² + 0²) = √400 = 20.
- Manhattan distance: walk along the grid instead of cutting diagonally. Add the absolute differences: |120 − 100| + |1 − 1| = 20. Because nothing is squared, one large difference weighs less than in Euclidean distance.
- Chebyshev distance: only the single largest difference across all variables counts.
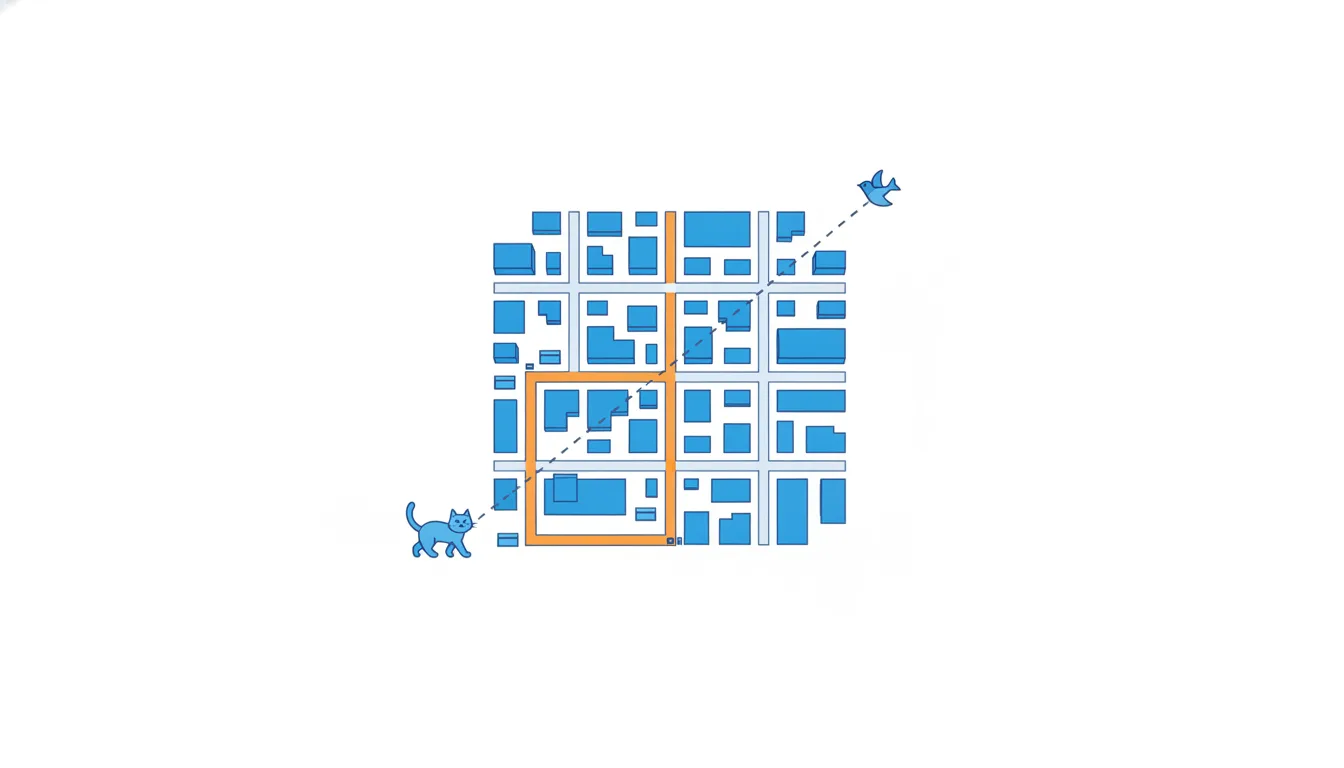
For A and B all three give 20, because they differ in only one variable. They part ways when customers differ on several.
The common slips: forgetting the square root in Euclidean distance (that gives 400 here), or adding differences with their signs, so a +20 and a −20 cancel to zero. Distance is never negative.
- Do√((120 − 100)² + (1 − 1)²) = √400 = 20
- Don't(120 − 100)² + (1 − 1)² = 400
Forgets the square root.
Hierarchical clustering and the dendrogram
Hierarchical clustering builds groups from the bottom up:
- Start with every customer as their own cluster.
- Find the two closest clusters and merge them.
- Recompute distances between the new cluster and the rest.
- Repeat until everyone is in one big cluster.
Every merge is recorded in a dendrogram: an upside-down tree with customers at the leaves. The height at which two branches join shows how far apart they were when merged. Short joins mean very similar customers; tall joins mean the method had to bridge a big gap.
To get segments, cut the tree with a horizontal line. Every branch the line crosses becomes one cluster. Cut low and you get many small, tight groups; cut high and you get a few broad ones. A natural place to cut is just below the tallest joins, where the groups being merged were clearly different.
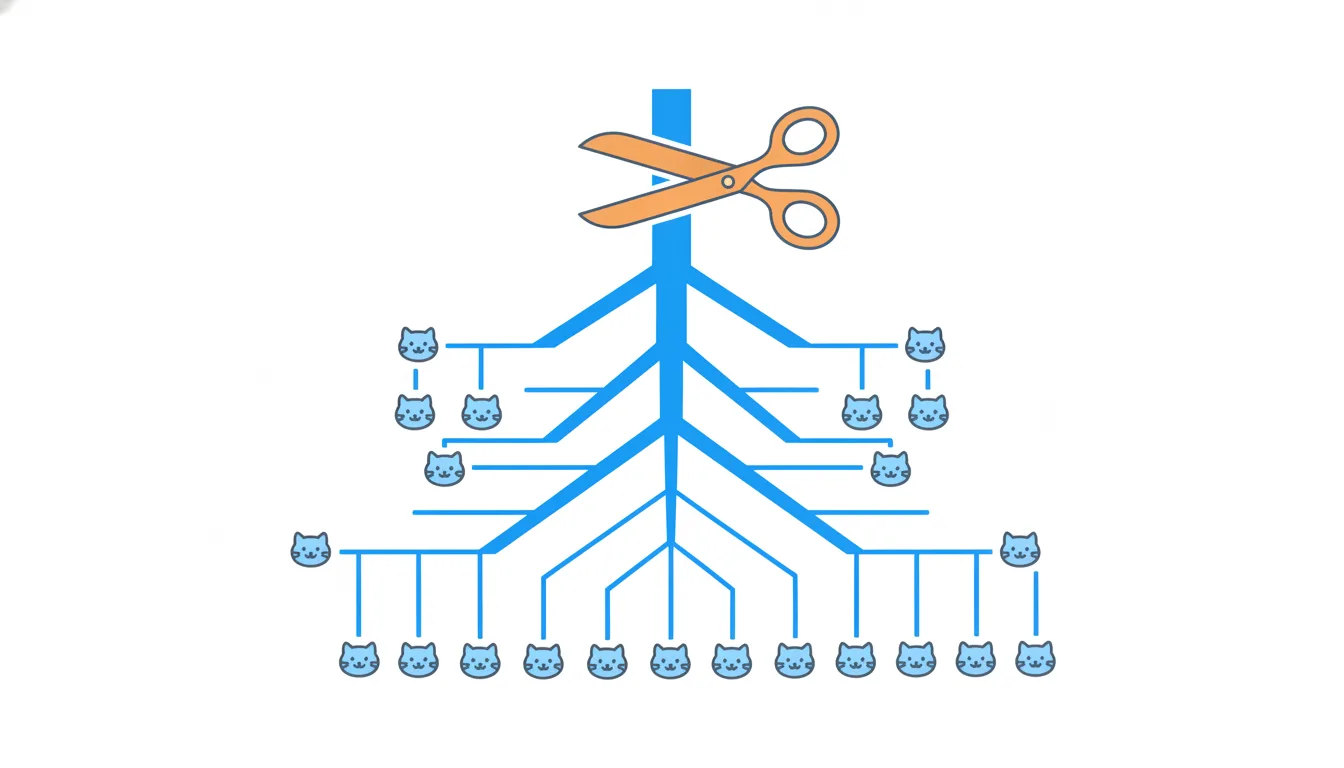
The dendrogram is the method's big advantage: you see all possible groupings at once and pick the number afterwards. Its weak spot is size: comparing every pair gets slow with very many customers, and an early merge can't be undone later.
- DoCut the dendrogram just below its tallest joins → a few clearly different segments.
- Don'tCutting right above the leaves and reporting 40 “segments”.
Groups of one or two customers are not actionable segments.
The centroid
In k-means each cluster is represented by its centroid: the point whose coordinates are the average of every member on every variable.
For a cluster of two customers at (monthly spend in UAH, orders per month) C(500, 5) and D(520, 5):
- spend: (500 + 520) / 2 = 510 UAH;
- orders: (5 + 5) / 2 = 5.
So the centroid is (510, 5). Note that no real customer sits there: the centroid is a calculated point, not a member. With three customers spending 300, 400 and 800 UAH, the centroid's spend would be 500, a value none of them has.
That's why it's useful as a segment profile. "Big spenders: about 510 UAH and 5 orders a month on average" is how you'd describe the cluster to marketing. Two cautions when you do:
- individuals vary around the centroid; report the spread or the range too, not just the average;
- like any mean, a centroid is pulled by outliers. One customer spending 10,000 UAH can drag a centroid away from where most members are.
The usual slip is averaging the wrong values, for example mixing members of another cluster in, or averaging spend and orders together into one number.
- DoCentroid of {C, D}: ((500 + 520) / 2, (5 + 5) / 2) = (510, 5)
- Don't“The centroid is customer D, the one closest to the middle.”
A centroid is a computed average, not a member.
How k-means works
k-means clustering splits customers into a chosen number of groups, k, by repeating two simple moves.
- Start: place k centroids at arbitrary positions, often on k randomly picked customers.
- Measure: compute the distance from every customer to every centroid.
- Assign: put each customer in the cluster of their nearest centroid.
- Update: move each centroid to the mean of the customers now assigned to it.
- Repeat steps 2–4 until no customer changes cluster and the centroids stop moving. That's convergence.
With four customers at (monthly spend in UAH, orders per month) A(100, 1), B(120, 1), C(500, 5), D(520, 5) and k = 2, the method settles in a step or two: A and B in one cluster with centroid (110, 1), C and D in the other with (510, 5).
Chart data
| Monthly spend, UAH | Small spenders (A, B) | Big spenders (C, D) |
|---|---|---|
| 100 | 1 | |
| 120 | 1 | |
| 500 | 5 | |
| 520 | 5 |
The order matters. Moving centroids before customers are assigned has nothing to average; stopping after one pass can leave customers attached to a centroid that has since moved away from them.
k-means always converges, but not always to the best split: a poor start can trap it in a worse grouping. That's why you run it several times from different starting points and keep the most stable result.
- DoPlace → measure → assign → update → repeat until nothing moves.
- Don'tRun one assign-and-update pass and report the clusters.
Stops before convergence.
When one variable takes over the distance
Distances add up raw differences, so they quietly favour whichever variable happens to use bigger numbers.
Take A(100 UAH, 1 order) and C(500 UAH, 5 orders):
d = √((500 − 100)² + (5 − 1)²) = √(160,000 + 16) = √160,016 ≈ 400.02.
Formula: Euclidean distance: the straight-line distance across all variables. · shown above
The 400 UAH gap in spend contributes 160,000; the gap of 4 orders a month, which is a big behavioural difference, contributes 16. Orders move the distance by 0.02. On raw values, the clustering is effectively a clustering by spend alone.
It gets worse with arbitrary unit choices. Measure spend in thousands of UAH (0.1 and 0.5) and suddenly orders dominate. The customers haven't changed, but the clusters can.
The tell-tale sign in practice: clusters that line up neatly along one variable and ignore the others. Before concluding that the other variables "don't matter", check their scale.
The fix is standardisation, putting every variable on a common scale before computing any distance.
- Do√(400² + 4²) ≈ 400.02: orders add almost nothing on raw values.
- Don't“Our clusters split only by spend, so order frequency doesn't matter for segments.”
The scale, not the business, decided that.
Standardise before you cluster
Standardisation (scaling) puts every variable on the same footing before distances are computed. The usual way is to convert each value to a z-score:
z = (value − mean of the variable) / standard deviation of the variable
After that, every variable has a mean of 0 and a standard deviation of 1. A customer who is one standard deviation above average on spend and one above average on orders is now "equally unusual" on both, whatever the original units.
For four customers at (spend, orders) A(100, 1), B(120, 1), C(500, 5) and D(520, 5), spend has a mean of 310 UAH and a standard deviation of about 231; orders have a mean of 3 and a standard deviation of about 2.3. A's z-scores are (100 − 310) / 231 ≈ −0.91 for spend and (1 − 3) / 2.3 ≈ −0.87 for orders: now both variables carry similar weight in the distance.
Standardise every variable that enters the distance, using the same customers you cluster. And remember what it implies: you are telling the method that each variable matters equally. If the business cares more about one variable, give it more weight deliberately rather than letting the units decide.
- DoConvert spend and orders to z-scores, then run k-means.
- Don'tRun k-means on spend in UAH and orders per month as they are.
Spend's large numbers drown out orders.
Choosing k and checking stability
Three checks turn a k-means run into segments marketing can trust.
- Choose k with judgement and data. Start from the business: how many segments can the team actually treat differently? Then plot the clustering error (the total distance from customers to their centroids) for k = 1, 2, 3, …. Error always falls as k grows, so look for the point where the drop flattens out; going past it adds clusters that split real groups into fragments.
- Standardise every variable first, so units don't decide the result.
- Run it several times from different starting centroids. If the same groups come back each time, the structure is real. If they reshuffle on every run, k is probably wrong or the data has no clear groups.
Then sanity-check the segments themselves: is each big enough to act on, and can you describe each one in a sentence from its centroid?
The tempting mistake is a very large k "for more personalisation". At the extreme, every customer gets their own cluster: perfect fit, zero insight. Segmentation is useful precisely because it simplifies.
- Dok = 3: the error curve flattens there, the groups repeat across 10 runs, and marketing can run 3 campaigns.
- Don't“k = 6, because more segments means more personalisation.”
Tiny, unstable segments help nobody.
Ready to practise?
Answer the lesson's exercises and earn 250 points the first time you finish it.
Start the exercises