

Theory
The north star metric and its KPI tree
One north star metric for the value users get, and a KPI tree of input metrics that teams can actually move.
~10 min read · 9 exercises · 250 points
Before you start
Which numbers should we steer by?
You're on the product team at Halves, a bill-splitting app for flatmates, couples and trips, with a paid plan, Halves Plus. This module asks which numbers the team should steer by: one north star that tracks the value users get, a tree of inputs teams can move, and the traps hidden in ratios and active-user counts. It ends with a case where you pick Halves's north star from real candidates.
This first lesson defines a north star, the five checks it must pass, and how to split it into a metric tree.
The test for a north star metric
A north star metric is the one number that captures the value users get from a product and, because of that, predicts the business. It's the number the whole team steers by, so picking the wrong one steers everyone the wrong way.

Most dashboards offer candidates that are easy to count: downloads, monthly active users, app opens. Run each through the first check: can it go up while users are worse off?
- Downloads double during a paid campaign in which nobody splits a single bill.
- App opens rise when a bug hides the balance and people check it three times.
- MAU counts anyone who touched the app once, whether splitting a bill worked or not.
All three fail. A candidate passes only if rising requires users to actually get the core value. For Halves that means a group sharing costs: "groups where at least two members added or settled an expense that week" can't rise unless people really split bills together.
Growth numbers still matter; they just sit lower in the tree, as inputs. A good north star has to pass four more checks besides this one.
- Do“Weekly active groups: groups where at least two members added or settled an expense.”
- Don't“Our north star is downloads: they doubled this quarter.”
Fails the test: a campaign can double them with no bill ever split.
What a good north star looks like
A good north star passes five checks, and every candidate, now or later, goes through the same five.
- It can't rise while users get less value. Downloads, app opens and MAU fail this one: each can grow while nobody splits a bill.
- It tracks delivered value. Start from the job the product does. Halves's job is that a group knows who owes whom without awkward conversations, so value appears only when a second member sees the balance and trusts it. That's why the unit is the group, not the user.
- It leads revenue. A group that stops sharing costs today cancels Plus next month; a metric that moves first gives you time to react.
- It splits into inputs teams can move. Nobody can "move weekly active groups" on a Monday morning, but a team can move the share of new groups that get a second member.
- It has a written definition: qualifying action, unit, exclusions, window, time zone. For Halves:
expense_addedby a person orsettle_up_recorded; distinctgroup_idwith at least two members acting; staff excluded; Monday to Sunday; UTC.

What doesn't matter: how big the number is, or how fast a campaign can jolt it.
- DoUnit: the group, because the value appears when a second member trusts the balance.
- Don't“Pick app opens: it's our biggest number and grows every week.”
Size and speed are not signs of value.
Building a metric tree
A north star is too big for any one team to move directly. A metric tree (also called a KPI tree or driver tree) splits it into input metrics that add up to it, level by level, until each branch is something one team owns.
For Halves, this week's active groups come from three disjoint sources:
- retained groups: active last week and this week;
- newly active groups: active for the first time = new groups × share that get a second member × share that add a shared expense in week 1;
- returning groups: active before, quiet last week, active again.
Each branch then splits further into inputs with natural owners. Growth marketing moves new groups from paid social and store search. The onboarding and invite team moves the share that get a second member. Core features, such as recurring bills, keep retained groups busy. Notifications and reminders bring quiet groups back.
The tree also shows where a team's work stops counting. Theo's campaigns sit under "new groups", but they only reach the top once those groups get a second member.
- DoActive groups = retained + newly active + returning; each branch has one owner.
- Don'tGive every team the same goal: “grow weekly active groups by 10%”.
Nobody knows which lever is theirs, so nobody owns the result.
The tree adds up to the top
A well-built tree is additive at the first level: every group active this week sits in exactly one branch, so the branches sum to the top. That makes it a bookkeeping tool, not just a picture.
Last week Halves had 1,600 weekly active groups. This week:
- retained: 1,360;
- newly active: 190;
- returning: 70.
Total: 1,360 + 190 + 70 = 1,620, up 20.
Two checks keep the arithmetic honest. First, a group must not appear in two branches. A group that was active last week is "retained" even if it also had a break a month ago; it can't count as "returning" too. Second, the flows out are implied: 1,600 − 1,360 = 240 groups were active last week and quiet this week.
That second number is the reason to build the tree at all. +20 looks like a calm week, but inside it 240 groups left and 260 new or returning groups replaced them. The top hides the flows; the branches show them.
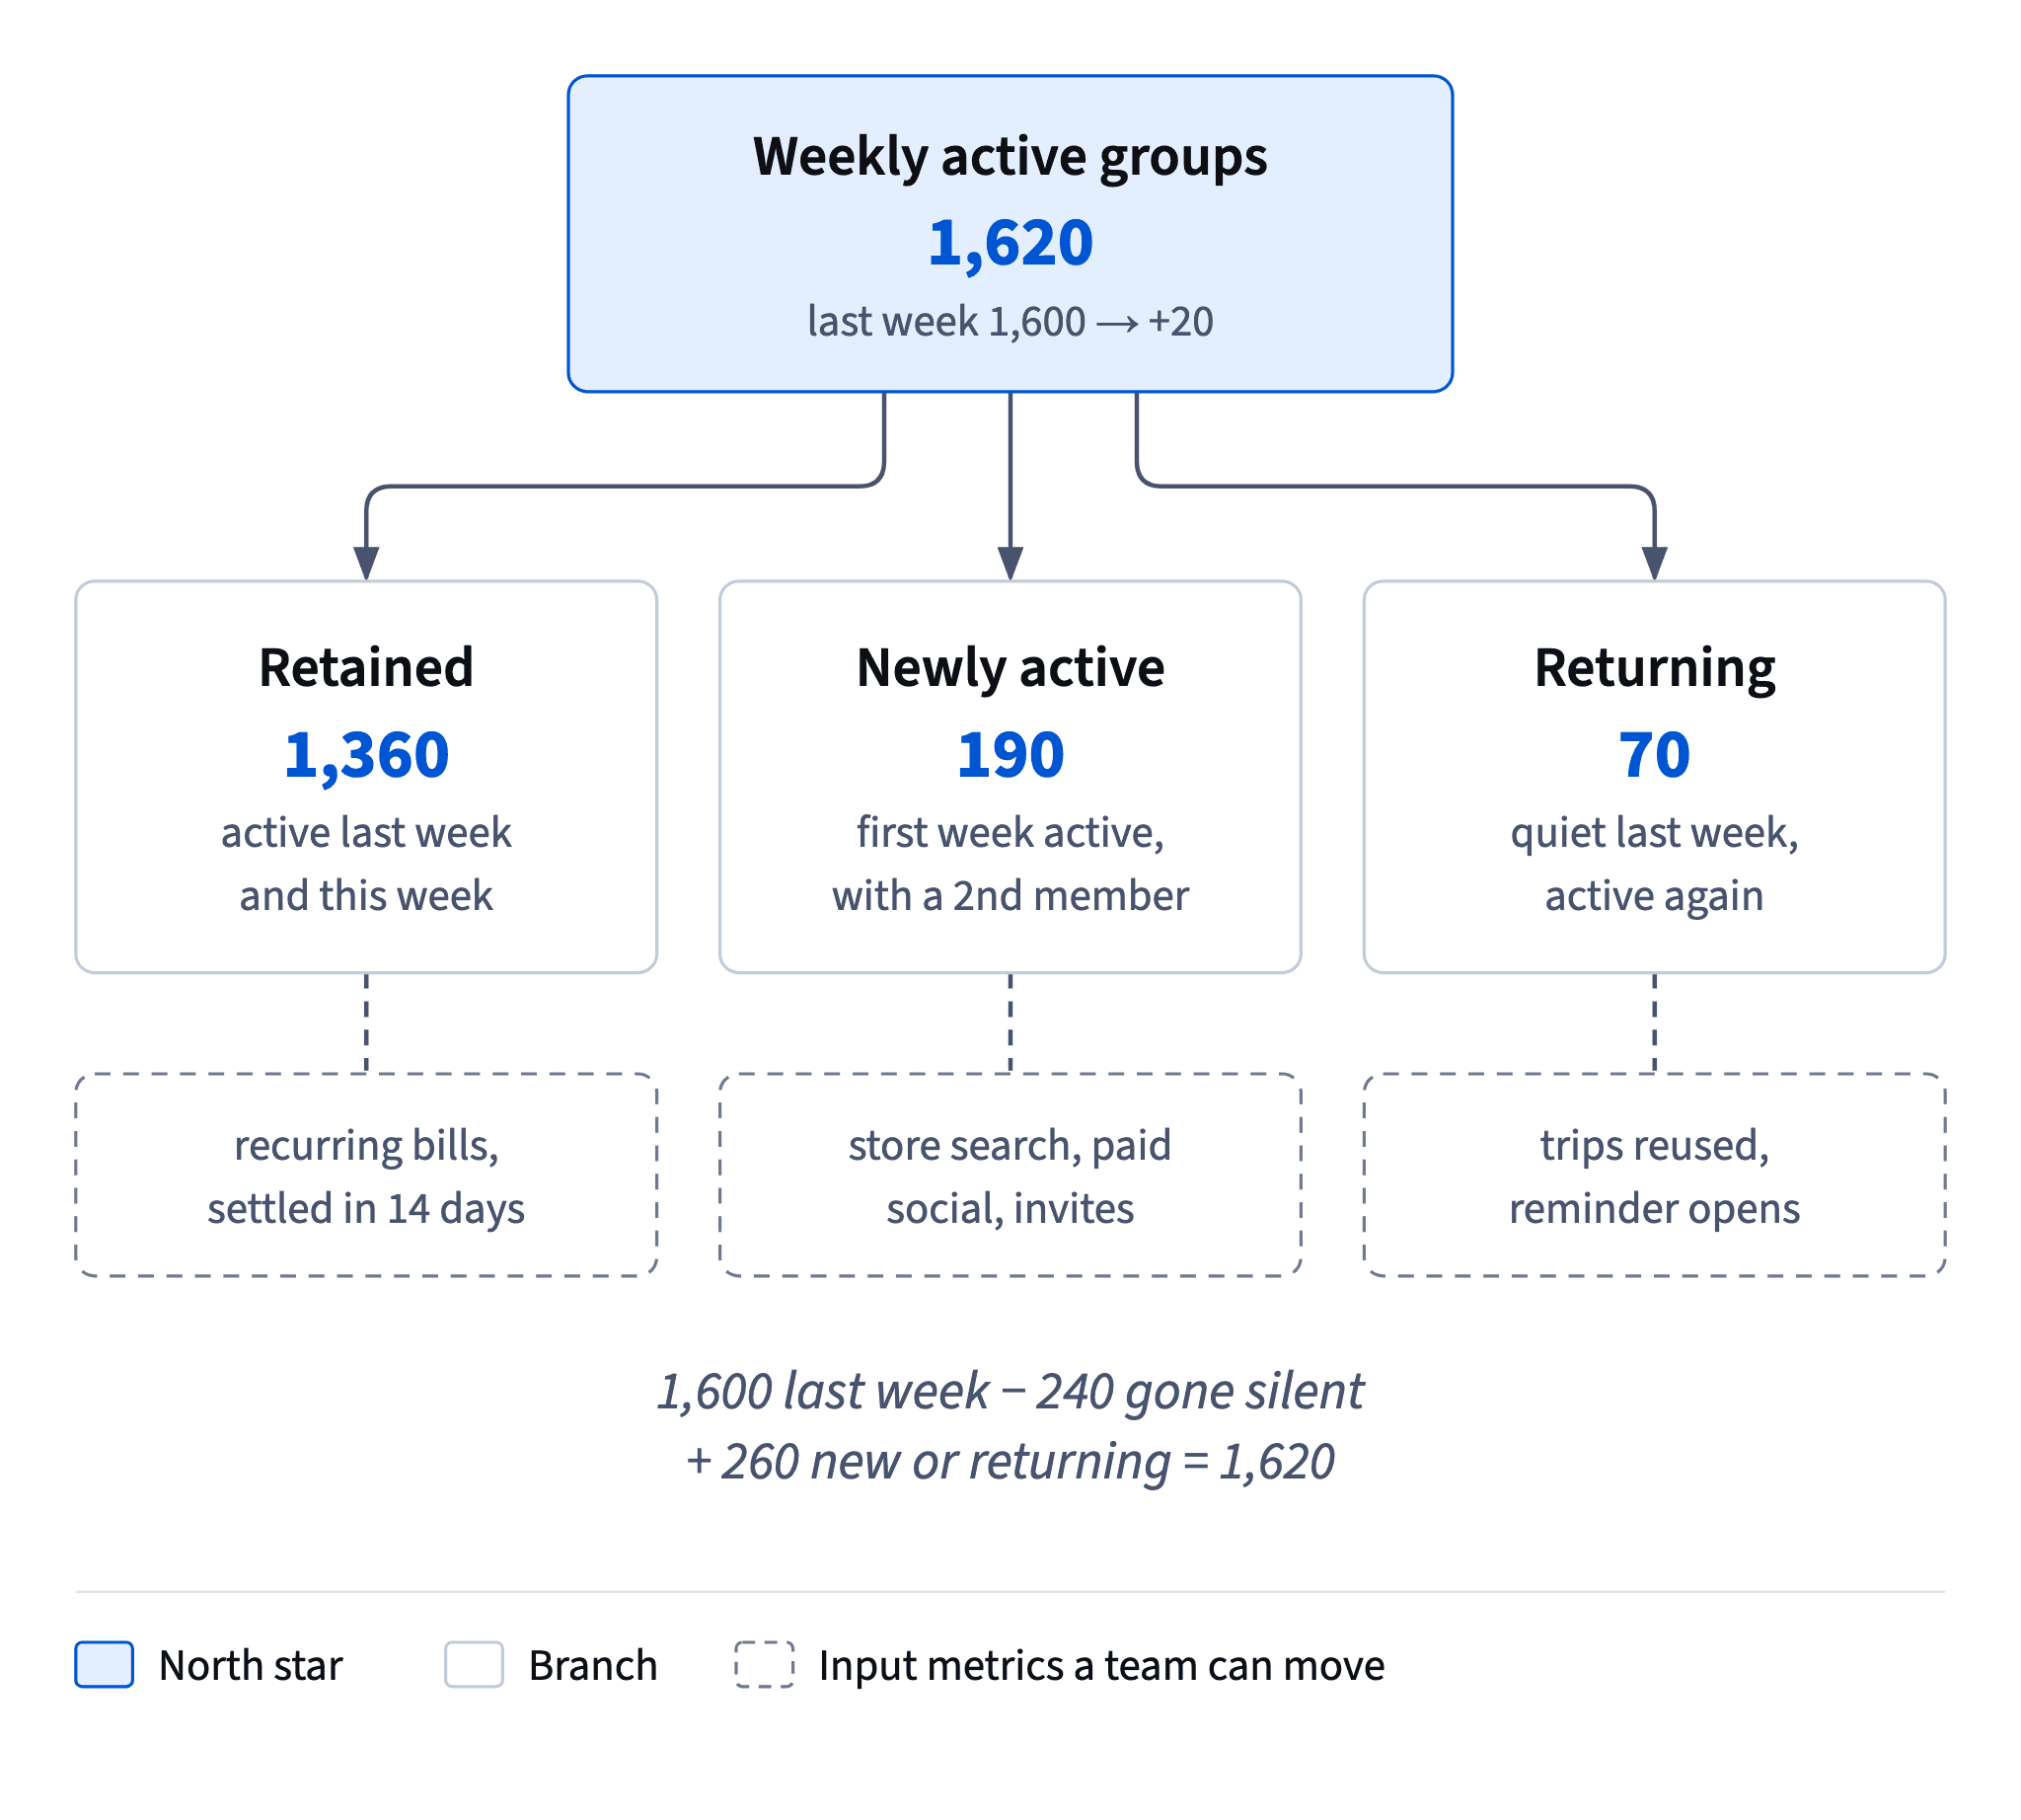
- Do1,360 + 190 + 70 = 1,620; quiet since last week: 1,600 − 1,360 = 240.
- Don't1,600 + 190 + 70 = 1,860 active groups this week.
Adds last week's total instead of the groups retained from it.
Retention as an input: pick the right base
A branch becomes steerable as a rate with the right base, because rates stay comparable as the product grows. For the retained branch that rate is week-over-week group retention = groups active last week and this week ÷ groups active last week. It's one of several retention measures; module 4 compares day-N, rolling and bracket retention.
For Halves: 1,360 ÷ 1,600 = 0.85 = 85%. The other 15%, 240 groups, went quiet.
The base must be last week's active groups, the ones that could have been retained. Dividing by this week's total (1,360 ÷ 1,620 ≈ 84%) mixes in new and returning groups that were never at risk, and the rate drifts whenever acquisition changes.
Why a rate helps: if next week Halves has 1,375 retained groups out of 1,620, the count grew by 15, but the rate is 1,375 ÷ 1,620 ≈ 84.9%, basically unchanged. The count rose only because the base was larger. Rates tell you whether the product got better at keeping groups; counts mix that with how many groups there were to keep.
- DoRetention = 1,360 / 1,600 = 85%
- Don'tRetention = 1,360 / 1,620 ≈ 84%
Divides by this week's total, which includes groups that were never at risk.
Reading the tree when the top moves
When the north star moves, the tree turns "why?" into a short search. Compare each branch with the same branch a week earlier, and the changes add up to the change at the top.
Suppose Theo pauses paid social, and a week after the 1,620-group week Halves has 1,540:
The whole drop sits in newly active groups, which fits the pause. Retained groups even went up, and their rate held at about 84.9%.
The tree doesn't end the analysis; it tells you which branch to open next. Newly active = new groups × share with a second member × share that add a shared expense, so the next question is which of those three moved.
This also protects people. Without the tree, Theo gets blamed for the whole chart; with it, everyone sees that retention held and acquisition paused.

- Do“−80 = +15 retained − 95 newly active + 0 returning: open the new-groups branch.”
- Don't“Active groups fell 5%; the product must be losing users.”
Reads the top without the branches; retention actually held.
Inputs only count when they reach the top
An input metric earns its place in the tree only if moving it moves the north star. That's worth checking before a team celebrates.
Take Theo's sign-ups. In the Halves tree, newly active groups = new groups × share that get a second member × share that add a shared expense in week 1. Sign-ups feed the first factor only. If a campaign doubles sign-ups but none of those people gets a second member into their group, the second factor is zero for them, and the top doesn't move at all.
The gap between a rising input and a flat top is information, not failure. It says the campaign stalls at the invite step: wrong audience, a confusing invite flow, or people who wanted a personal expense tracker rather than a shared one.
So report inputs together with the step after them: "sign-ups +100%, groups with a second member +0%" tells the true story. A tree is also a reminder that every input has a ceiling set by the steps above it.
- Do“Sign-ups +100%, but new groups with a second member flat: the campaign stalls at invites.”
- Don't“Sign-ups doubled, so the north star will follow next month.”
Skips the second-member step that the north star requires.
Revenue sits next to the north star
Revenue pays the salaries, so it's the most tempting north star. It's still the wrong one, for two reasons.
It lags. Revenue is a result of value delivered earlier: a group that stops sharing costs today cancels Plus next month.
Its easy levers can hurt users. If teams are judged on monthly revenue, the fastest moves are paywalls in front of features groups need, or harder cancellation. Revenue rises for a while as value falls.
The working setup is two numbers side by side: weekly active groups as the north star, and Plus revenue checked monthly next to it. Read together, they diagnose:
- both grow: value is delivered and monetized;
- active groups grow, revenue doesn't: look at pricing or the paywall, not the product's value;
- revenue grows, active groups fall: you're harvesting value you no longer create.
How it fits together: a north star that passes the five checks, a tree that splits it into inputs teams own, and revenue as the check beside it. Next, Volume, quality and Simpson's paradox shows how the ratios inside such a tree can mislead.
- DoSlide: weekly active groups 1,620 (north star) · Plus revenue, monthly, alongside.
- Don't“Revenue is our north star; put receipt splitting behind the paywall to hit the target.”
Lifts revenue for a while by taking value away from groups.
Ready to practise?
Answer the lesson's exercises and earn 250 points the first time you finish it.
Start the exercises