

Theory
The LTV curve
Cumulative gross profit per cohort user by month, how to read it, and when a young cohort can be extrapolated.
~10 min read · 9 exercises · 250 points
Before you start
What is a user worth?
Theo is planning the summer budget for paid social at Halves and needs a number to bid against: what is a new user worth? He's asking you, the person who answers from the data.
In this lesson you'll build an LTV curve, the cumulative gross profit per user of each cohort month by month, learn to read it, and see when a young cohort's curve can be extended and when it can't.
The LTV curve: worth how much, by when
"What is a user worth?" has no answer without a time. An LTV curve gives one answer per age: for a monthly cohort, the cumulative gross profit per cohort user, month by month since sign-up (month 0 is the sign-up month).
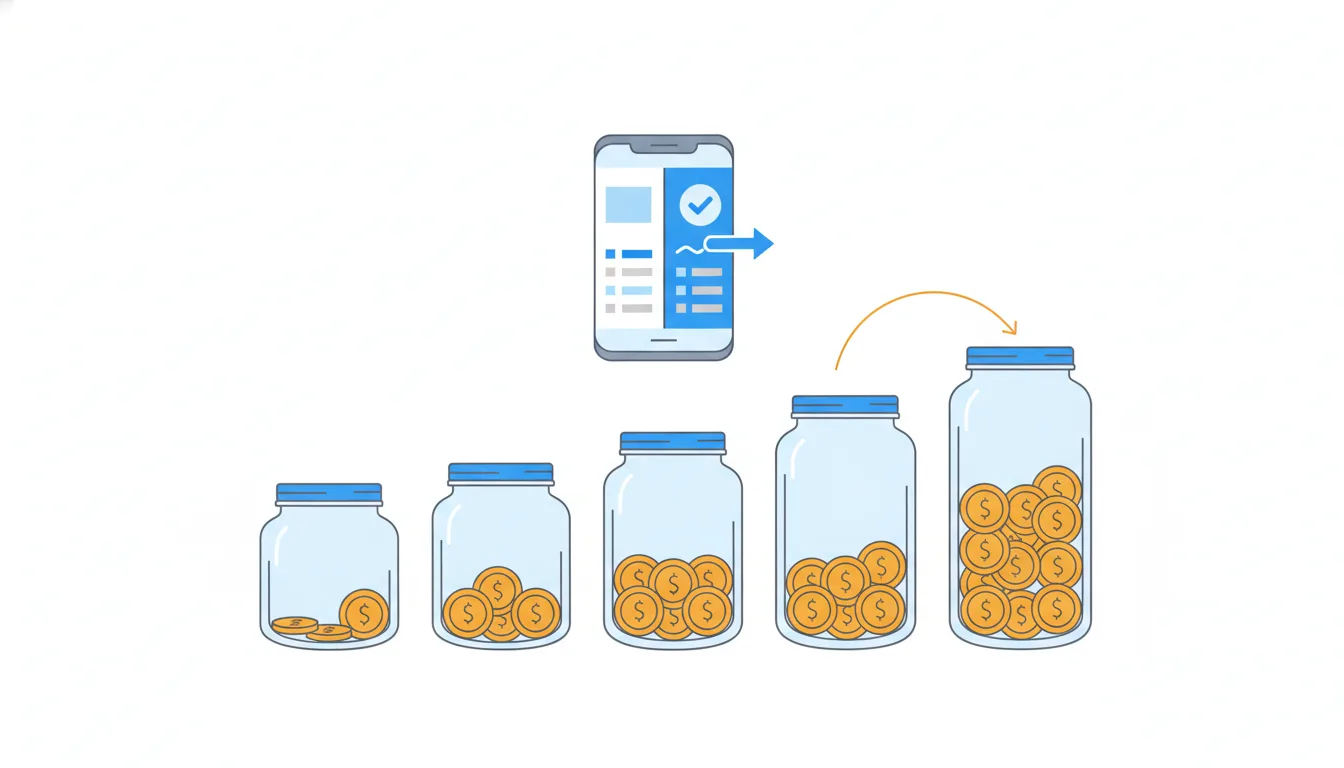
Chart data
| Months since sign-up | January 2025 | July 2025 | January 2026 | April 2026 |
|---|---|---|---|---|
| 0 | 0.37 | 0.25 | 0.37 | 0.48 |
| 1 | 0.57 | 0.39 | 0.57 | 0.73 |
| 2 | 0.74 | 0.49 | 0.73 | 0.93 |
| 3 | 0.89 | 0.57 | 0.88 | |
| 4 | 1.03 | 0.64 | 1.02 |
Show 7 more rows
| 5 | 1.16 | 0.7 | 1.15 | |
| 6 | 1.27 | 0.75 | ||
| 7 | 1.38 | 0.8 | ||
| 8 | 1.48 | 0.83 | ||
| 9 | 1.59 | 0.87 | ||
| 10 | 1.69 | 0.92 | ||
| 11 | 1.79 | 0.96 |
Three choices define it:
- Gross profit, not revenue. At Halves, the store commission, payment fees and receipt scanning take 20% of revenue. What's left is what can pay for acquisition.
- Divide by every user in the cohort, not by payers. Acquisition buys installs, and most installs never pay, so the value of an install is the cohort's total divided by all of its users.
- Cumulative. Each point adds that month's gross profit to all the months before it, so the curve never goes down.
January 2026 cohort, months 0–5: $5,358.04 of gross profit ÷ 4,646 users = $1.15 per user at month 5. Dividing by the 231 users still paying in month 5 gives $23.20, which is the value of a payer, not of an install.
Dataset · 150 rows
Halves cohorts by month since sign-up, January 2025 – June 2026
Months 0–11 of every monthly cohort; young cohorts have fewer rows. Data to 30 June 2026.
First 5 of 150 rows
- DoLTV at month 5, January 2026 cohort = $5,358.04 ÷ 4,646 cohort users = $1.15.
- Don'tLTV = $5,358.04 ÷ 231 users still paying = $23.20.
The value of a payer, not of the install Theo pays for.
Bid against gross profit, not revenue
A marketer who asks "what is a user worth?" usually wants a ceiling for the bid: how much can we pay for an install and still not lose money? That ceiling must come from money Halves actually keeps.
Revenue is what users pay. Gross profit is revenue minus the costs that come with every sale: at Halves, the app store's commission, payment processing and the receipt-scanning service, together 20%. Acquisition spend is paid from what is left, so an LTV in revenue overstates the ceiling by a quarter: $2.24 of revenue per January 2025 user at month 11 is only $1.79 of gross profit.
Two more points about the ceiling:
- bidding exactly the LTV means breaking even at that age, with nothing left for salaries or profit, so real bids sit below it;
- the ceiling has an age. "$1.79 at 12 months" means the money comes back over a year, and the company has to fund that year.
Always label an LTV with its base: "12-month gross-profit LTV".
- Do“12-month gross-profit LTV: $1.79 per install, so keep bids well below that.”
- Don't“Users bring $2.24 each, so we can bid up to $2.24.”
Revenue includes the 20% Halves never keeps.
Read the steps of the curve, not only its height
Two cohorts can have the same LTV at month 2 and very different futures. The shape is in the steps: how much each month adds to the curve. A step is that month's gross profit divided by the cohort's users, so it shrinks as payers cancel.
At Halves, winter cohorts keep adding about ten cents a month even at month 11. Summer cohorts are full of trip groups who subscribe for one holiday and cancel when the trip ends, so their steps shrink fast and the curve flattens:
- January 2025: $1.16 at month 5, $1.79 at month 11, so months 6–11 added $0.64;
- July 2025: $0.70 at month 5, $0.96 at month 11, so months 6–11 added only $0.26.
Chart: LTV curves: cumulative gross profit per cohort user · shown above
Subtract two cumulative points to get what a period added; never add the cumulative points together. And compare steps at the same ages: a young cohort's big early steps say little about its later ones until a similar older cohort shows what comes next.
- DoMonths 6–11 of July 2025 = LTV at month 11 − LTV at month 5 = $0.9612 − $0.6993 = $0.26.
- Don'tAdding the cumulative values for months 6 to 11 to get what those months earned.
Each cumulative point already contains all earlier months.
Check people before money
When one cohort's LTV runs above another's, split it before you explain it. For any month:
gross profit per cohort user = share of users paying × gross profit per payer
The first factor is about people: did more of them subscribe or stay? The second is about money: does each payer bring in more? Product changes such as a new onboarding usually move the first factor. Price changes, plan mix (monthly or yearly) and fees move the second.
Halves, month 0: the April 2026 cohort earned $0.48 per user against $0.37 for March. The paying share was the same, 4.34% (239 of 5,504) against 4.37% (236 of 5,395). Gross profit per payer jumped from $8.48 to $11.02. Since 1 April new subscribers pay $4.99 a month instead of $3.99, and yearly plans went up too, so the gap is the price, not the onboarding that shipped the same month.
Cohort size doesn't explain a gap in a per-user average, and neither does usage that never reaches a payment.
- Do“Same paying share (4.34% vs 4.37%), but $11.02 vs $8.48 per payer: the April price rise.”
- Don't“April’s LTV is higher, so the new onboarding works.”
Credits the product for a change in price per payer.
Extrapolate with a ratio from a matching cohort
A six-month-old cohort can't tell you its 12-month LTV by itself. Don't extend a straight line through its points: the steps shrink with age, so a line overshoots. Borrow the shape from an older cohort that has already lived to the target age:
ratio = template LTV at the target age ÷ template LTV at the young cohort's current age projection = young cohort's LTV now × ratio
Halves: January 2025 reached $1.1564 at month 5 and $1.7945 at month 11; ratio 1.7945 ÷ 1.1564 = 1.5518. January 2026 is at $1.1533 at month 5, so its 12-month LTV is about $1.1533 × 1.5518 = $1.79.
Then check the ratio isn't a one-off. The other winter cohorts of 2025 give 1.543 to 1.556, so the projection is a range, about $1.78 to $1.80. Report the range, the template and the age together. Keep four decimals until the last step; rounding $1.1533 to $1.15 and the ratio to 1.55 already moves the answer by a cent.
- Do$1.1533 × (1.7945 ÷ 1.1564) = $1.1533 × 1.5518 = $1.79; winter range $1.78–1.80.
- Don'tDoubling the month-5 LTV because 12 months is about twice 6: $2.31.
Assumes later months earn as much as the first ones; they earn less.
A template must match, not just be big
A large cohort gives a precise estimate of its own shape. It doesn't make that shape right for a different kind of user. When you pick a template for extrapolation, match it on what drives the shape:

- season: summer cohorts at Halves are full of trip groups who cancel after the holiday;
- prices and plans: a cohort that pays a different price grows in dollars differently, even if its people behave the same;
- channel mix: users bought through one channel may stay longer than those from another.
Halves: July 2025 is the biggest old cohort (5,871 users), but its month-11 to month-5 ratio is 1.3745 against 1.5518 for January 2025. Using it would put the January 2026 cohort at $1.1533 × 1.3745 = $1.59 instead of $1.79, a twenty-cent error from picking the wrong kind of user.
Chart: LTV curves: cumulative gross profit per cohort user · shown above
Check that the young cohort matches the template over the months both have: January 2026 and January 2025 agree within a cent or two at every month from 0 to 5.
- DoTemplate for January 2026: January 2025, checked against the other 2025 winter cohorts.
- Don'tTemplate for January 2026: July 2025, because it has the most users.
Size gives precision about the wrong shape.
After a price change: project people and price separately
A price change breaks the dollar curves of old cohorts as templates: the April 2026 cohort earns more per payer than any 2025 cohort did, so a 2025 dollar ratio describes the wrong money.
The fix splits LTV into people and price. LTV per user is built from the share of users still paying at each age and the gross profit per payer. The first part is about behaviour, and older comparable cohorts still describe it well, if the season and channel match. The second part changed with the price, and the new cohorts already show it.
So project the two parts separately: borrow the paying-share curve from comparable cohorts, multiply it month by month by the new gross profit per payer, and add up. Then state the assumption out loud: "assumes the higher price doesn't make subscribers cancel sooner". Watch the young cohort's paying share as it ages, because a price rise can change behaviour too.
What doesn't work: a dollar ratio from any old-price cohort, a straight line through three points, or a template picked only because it signed up in the same calendar month.
- Do“Paying share by age from winter 2025 cohorts × April 2026 gross profit per payer, assuming the new price doesn’t raise cancellations.”
- Don't“April 2026 × April 2025’s month-11 ratio: same month, so same shape.”
April 2025 paid the old price, so its dollars grew differently.
Four checks before you extrapolate
A projected LTV is only as good as the template behind it. Before it goes on a slide, check four things:
- The template reached the target age in real data: January 2025 has twelve observed months, so it can speak about month 11.
- It lived under the same conditions: season, prices, plans, channel mix.
- The young cohort tracks it, and several comparable cohorts agree on the ratio. January 2026 matched January 2025 within a cent or two up to month 5; five winter cohorts gave ratios of 1.543–1.556.
- You stop at the oldest observed age: a 12-month LTV, not a "lifetime" value. Winter curves still add about ten cents a month at month 11, and nobody has seen what comes after.

Chart: LTV curves: cumulative gross profit per cohort user · shown above
A bigger young cohort doesn't help (size says nothing about shape), and neither does a straight line to month 36.
How it fits together: gross profit per cohort user by age, read by its steps, split into people and price, extended only with a matching template and only to the oldest observed age. Next, CAC, payback and ROI sets the cost of buying users against it.
- Do“12-month LTV about $1.79 (range $1.78–1.80), from five winter 2025 cohorts.”
- Don't“Lifetime value of a Halves user: $4.50.”
No observed data reaches “lifetime”, and no age is named.
Ready to practise?
Answer the lesson's exercises and earn 250 points the first time you finish it.
Start the exercises