

Theory
CAC, payback and ROI
Judge a paid channel by the cohort it buys: CAC, payback period and cohort ROI at a stated age, and why a month's profit divided by that month's spend flatters ads.
~10 min read · 9 exercises · 250 points
Before you start
Triple the budget?
Budget meeting week at Halves. Paid social is the cheapest way to buy users, and Theo wants to triple its budget for the summer. He wants your support at Friday's meeting, and on the product team that means the data has to agree.
In this lesson you'll judge a paid channel by the cohort it buys: what each user cost, how many months until the cohort pays that back, and why a month's profit divided by that month's spend flatters ads.
CAC: what one acquired user cost
CAC (customer acquisition cost) = acquisition spend ÷ new users that spend brought in, for one channel and one sign-up period.
Every dollar of paid acquisition buys a cohort: the users who signed up through that channel in that month. So CAC belongs to the cohort, not to the channel in general. January 2026 at Halves:
- store search ads: $892.60 ÷ 570 users = $1.57;
- paid social: $1,048.70 ÷ 1,112 users = $0.94.
Write down what goes into both parts. Spend: media cost only, or also agency fees and creative production? New users: installs, sign-ups, or only users who completed onboarding? Change either definition and CAC changes, so two CACs are comparable only if they are built the same way.
Keep paid users separate from users who would have come anyway (organic search, invites). Dividing paid spend by all new users makes paid acquisition look cheaper than it is.
And CAC is half of the story: it says what a user cost, not what the user brings back. Cohort ROI and the payback period answer that.
- DoCAC, January 2026 store search ads = $892.60 ÷ 570 new users from that channel = $1.57.
- Don'tCAC = all January ad spend ÷ all January sign-ups, invites and organic included.
Users who came for free make paid users look cheap.
Cohort ROI is always stated at an age
Cohort ROI at month m = (cumulative gross profit of the cohort up to month m − spend) ÷ spend.
Negative means the cohort hasn't earned its cost back yet; zero means break-even; positive means profit on the spend so far. The same cohort has a different ROI at every age, so an ROI without an age is not a number anyone can use.
January 2026 paid social at Halves: spend $1,048.70. Cumulative gross profit was $855.57 at month 3 and $984.13 at month 4, so ROI was (855.57 − 1,048.70) ÷ 1,048.70 = −18.42% at month 3 and (984.13 − 1,048.70) ÷ 1,048.70 = −6.16% at month 4. At month 5 ($1,100.72) it turned positive: +4.96%.
Use gross profit, not revenue, in the numerator, the same base as The LTV curve: the store commission and payment costs are not money Halves can recover its spend from. And compare channels and cohorts at the same age: a three-month-old cohort will always look worse than a five-month-old one.
- Do“January paid social: ROI −6.16% at month 4, +4.96% at month 5.”
- Don'tROI = $984.13 ÷ $1,048.70 = 93.84%.
That is the share of spend recovered; ROI subtracts the spend first: −6.16%.
Payback period: the first month the cohort covers its cost
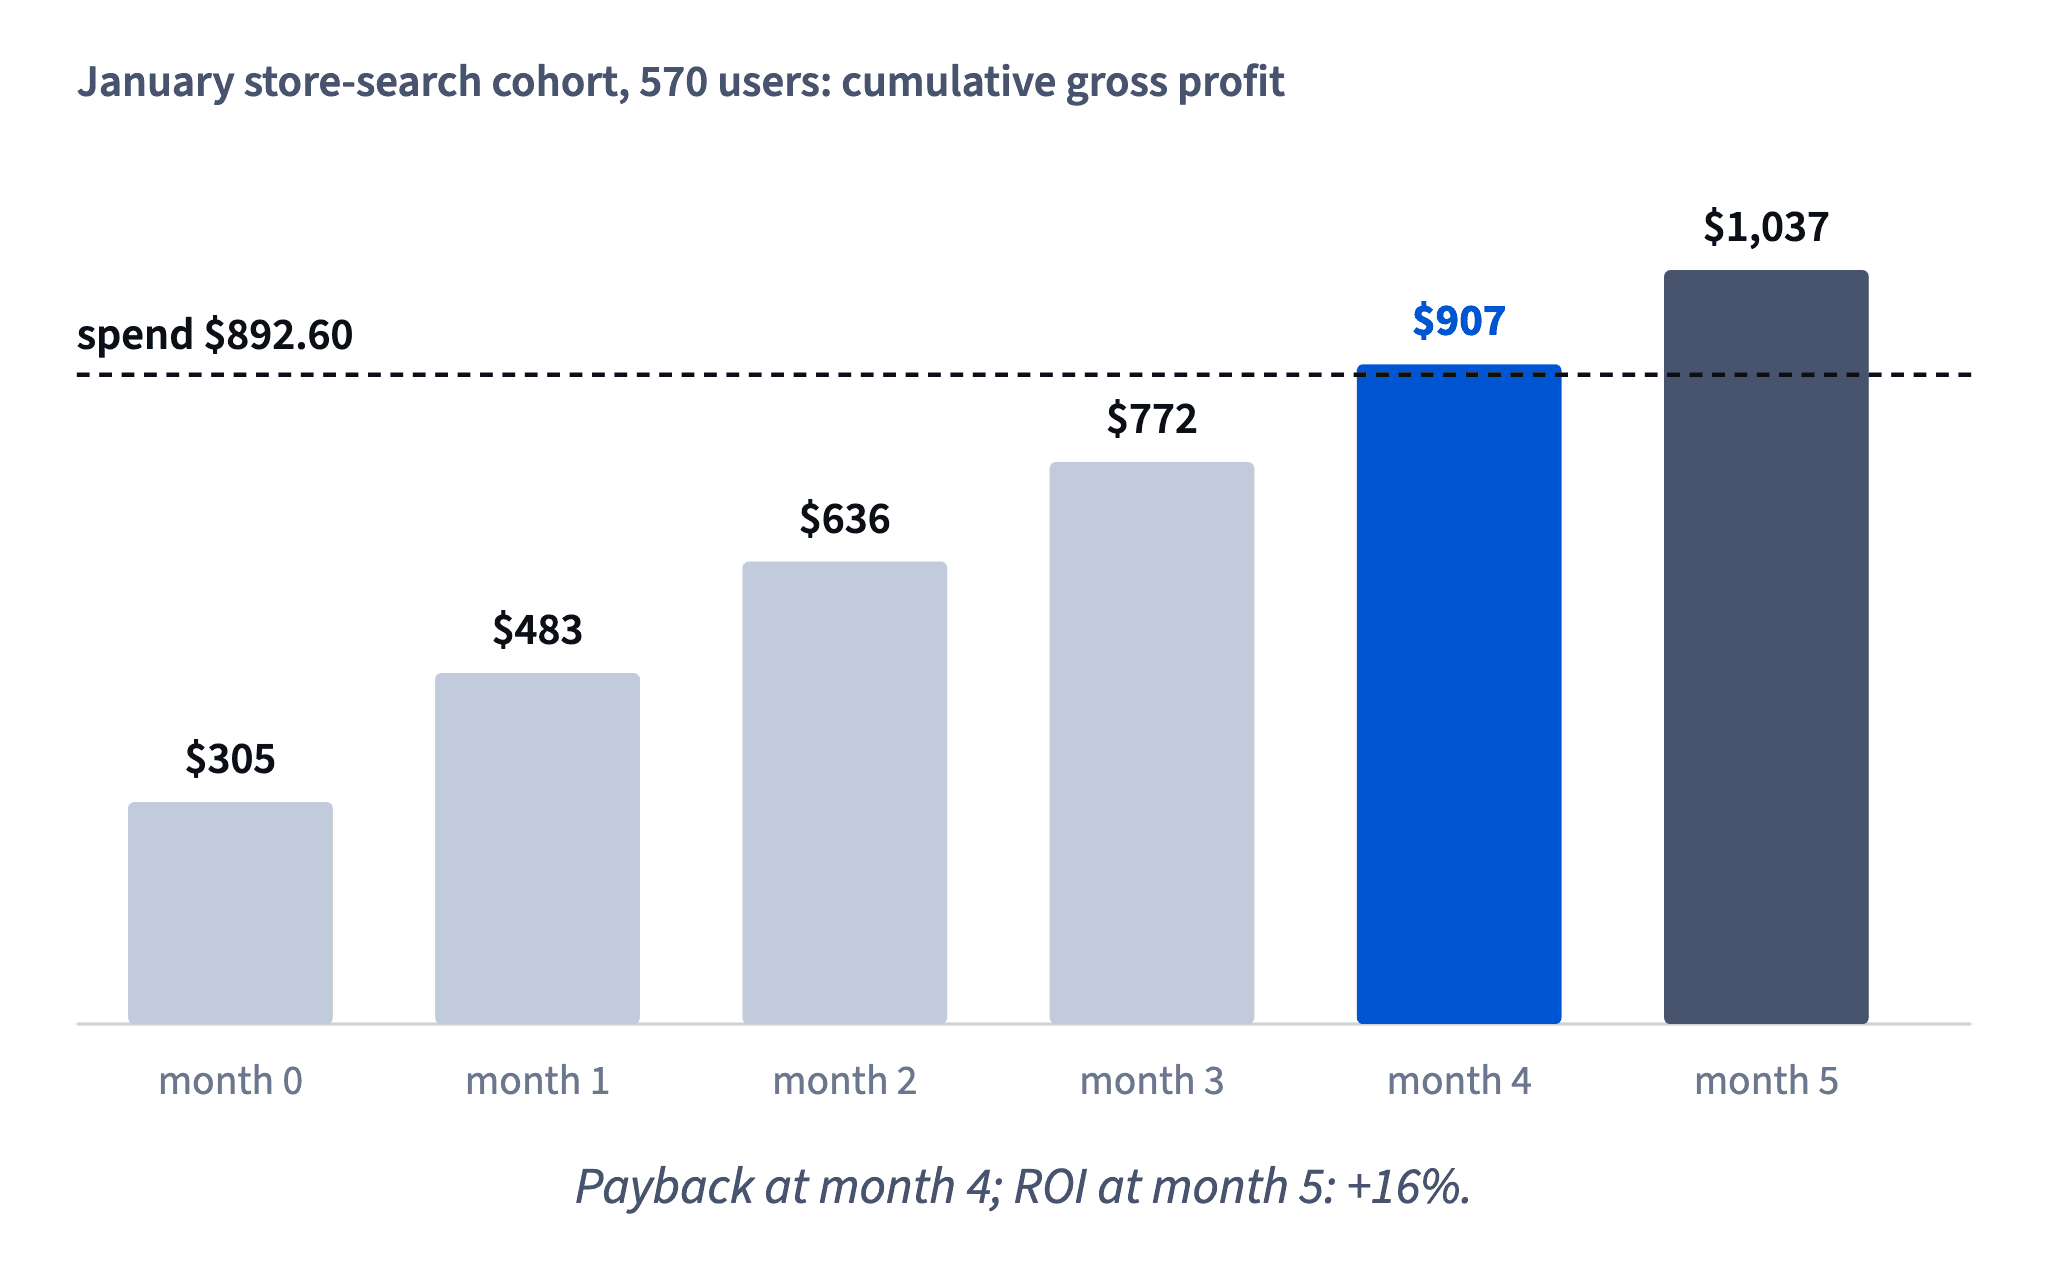
The payback period is the first month since sign-up at which a cohort's cumulative gross profit is at least its acquisition spend, the first age where ROI is zero or positive.
Read it off a cumulative row from left to right and stop at the first value that reaches the spend. January 2026 at Halves:
Dataset · 12 rows
Paid cohorts, January–June 2026
One row per sign-up month and paid channel; cumulative gross profit by month since sign-up.
First 5 of 12 rows
- store search ads, spend $892.60: month 3 $772.47 (short), month 4 $907.41 (covered), so payback at month 4;
- paid social, spend $1,048.70: month 4 $984.13 (short), month 5 $1,100.72 (covered), so payback at month 5.
Say which counting you use. With month 0 as the sign-up month, "month 4" is the cohort's fifth month of life. Using the column names (gp_cum_m4) avoids off-by-one arguments.
Payback answers the cash question a budget meeting cares about: how long the company has to fund the spend before it comes back. A cohort that hasn't reached payback yet has no payback period; write "not yet, −0.19% at month 4", not a guess.
- DoPaid social, January: $984.13 < $1,048.70 at month 4; $1,100.72 ≥ $1,048.70 at month 5, so payback at month 5.
- Don'tPayback = CAC ÷ gross profit per user in month 0 = $0.94 ÷ $0.33 ≈ 3 months.
Assumes every month earns as much as the first; later months earn far less.
A cheap CAC is not a cheap user
CAC tells you the price of a user; it doesn't tell you the value. A channel with a low CAC can be the worse buy if its users pay back slowly, and a pricier channel can be the better one.
Halves, January and February 2026: paid social bought users for about $0.94–0.95, store search ads for about $1.56–1.57, roughly 40% cheaper. Yet at month 4 both store-search cohorts had paid back (ROI +1.66% and +1.12%), while neither paid-social cohort had (−6.16% and −0.19%). People who search the store for a bill-splitting app arrive with a need, and more of them subscribe.

To compare channels:
- take cohorts from the same sign-up months;
- compare ROI or payback at the same age;
- look at several cohorts, not one, before calling a winner.
A ratio such as "LTV ÷ CAC" works the same way: it needs an LTV at a stated age and gross profit, not revenue.
- Do“At month 4, both store-search cohorts have paid back; neither paid-social cohort has.”
- Don't“Paid social is 40% cheaper per user, so it’s our best channel.”
Price per user without what the user pays back.
Same age and same prices
A fair comparison of two cohorts holds two things fixed: age and conditions. Age, because cumulative ROI rises month by month. Conditions, because anything that changes money per user moves ROI without any change in the channel.
At Halves, new subscribers have paid $4.99 a month instead of $3.99 since 1 April 2026, so every April cohort earns more per paying user than a January cohort with identical ads. April paid social stood at −6.75% at month 2, January at −31.44%. Most of that gap is the price, not Theo's new creative.
To judge the ads, compare old-price cohorts with each other at the same age. March 2026 is the latest old-price cohort with a month-3 number: ($1,062.59 − $1,199.91) ÷ $1,199.91 = −11.44%, against −18.42% for January and −12.90% for February at month 3. That is a fair trend line.
Name other condition changes the same way: a new plan, a different trial length, a seasonal audience.
- Do“At month 3, old prices: January −18.42%, February −12.90%, March −11.44%.”
- Don't“April paid social is at −7% at month 2 against −31% in January: the new ads work.”
Same age, but different prices.
Write ROI with its cohort and its age
An ROI line in a report needs three labels to mean anything: which cohort (channel and sign-up month), at what age, and on what base (gross profit). Without them, a reader can't tell a three-month-old cohort from a five-month-old one, or a loss that is about to close from one that will never close.
Compare two ways to write the same data:
- "Paid social ROI: −6%." Which cohort? At what age? Is it improving?
- "January 2026 paid-social cohort: ROI −6.16% at month 4, +4.96% at month 5 (gross profit)."
The second line also shows the direction: the cohort crossed break-even between month 4 and month 5, so its payback period is month 5.
When a table shows several cohorts, put them in columns by age (month 0, 1, 2 …), not by calendar month. Then each column compares like with like, and young cohorts simply have empty cells instead of numbers that look worse because they are younger.
- Do“January 2026 paid social: ROI −6.16% at month 4, +4.96% at month 5.”
- Don't“Paid social ROI is −6%, store search is +16%.”
Two different ages (month 4 vs month 5) side by side, with no cohort named.
Why a calendar month’s ROI flatters ads
A common report divides a month's gross profit from a channel by the same month's spend on it. It looks like ROI, but the two parts belong to different people:
- the numerator is profit from every user the channel has ever brought, back to its first campaign;
- the denominator is what this month's spend bought, users who have had at most a few weeks to pay.
So the ratio grows with the channel's age, not with its quality. Halves, May 2026, paid social: $2,454.89 of gross profit against $1,414.55 of spend, "+74%". May's own paid-social cohort had earned $1,075.03 by month 1: −24.00%.

Worse, it rewards stopping. Cut spend to zero and the ratio becomes infinite, because old cohorts keep paying while the denominator vanishes. And when spend jumps, the ratio dives even if the new users are fine: June paid social shows +6.71% after spend nearly doubled.
Judge spend by the cohort it bought, at a stated age. Two channels with the same flawed ratio aren't comparable either.
- Do“May paid-social cohort: $1,075.03 earned by month 1 on $1,414.55 spent, ROI −24.00% at month 1.”
- Don't“May paid social: $2,454.89 profit on $1,414.55 spend, +74%, so the May campaign paid off.”
The profit comes from users bought in earlier months.
The next users cost more: average vs marginal CAC
A channel's CAC is an average: all spend divided by all users. When you raise the budget, the question changes: what do the extra users cost? That is the marginal CAC:
marginal CAC = extra spend ÷ extra users
Channels saturate. The first dollars reach the people most likely to install; more dollars reach less interested people, so each extra install costs more. The average hides this by blending cheap first users with dear last ones.
Halves, paid social: May $1,414.55 for 1,478 users (CAC $0.96); June $2,785.11 for 2,352 users (CAC $1.18). The extra $1,370.56 bought 874 extra users: $1.57 each.
Part of the jump may be seasonal, so treat it as a warning, not a precise curve: raise a budget in steps and check marginal CAC and payback at each step.
How it fits together: CAC buys a cohort; judge it by ROI and payback at a stated age, at the same prices, never by a calendar-month ratio, and price the next users at marginal CAC. Next, Price testing case: price or paywall?
- DoMarginal CAC, May → June: ($2,785.11 − $1,414.55) ÷ (2,352 − 1,478) = $1,370.56 ÷ 874 = $1.57.
- Don't“CAC is $0.96, so three times the budget buys three times the users.”
Assumes the next users cost what the average one did.
Ready to practise?
Answer the lesson's exercises and earn 250 points the first time you finish it.
Start the exercises