

Theory
Scoring frameworks: impact effort matrix, RICE and more
How an impact effort matrix sorts quick wins, big bets, fill-ins and money pits, how a value vs effort scorecard and RICE turn criteria into scores, how to keep confidence honest and read a ranking, where cost of delay, WSJF and MoSCoW fit, and why a score only starts the conversation.
~11 min read · 12 exercises · 250 points
Before you start
Ten out of ten for what?
Ian stops by your desk on CatChow's product team with news: over the weekend the founders scored the whole spreadsheet themselves, and loyalty points got ten out of ten. He'd like to just use their scores. The trouble is that nobody said what a ten means.
In this lesson you'll try the common scoring frameworks, from a simple value and effort grid to RICE, learn to keep the inputs honest, and see why a score starts the conversation rather than ending it.
The impact effort matrix
“Ten out of ten” means nothing until someone says what a ten is. A prioritization framework fixes that: an agreed, repeatable way to rank items against the same criteria, so anyone can see how a score was reached.
The simplest one is the impact effort matrix, also called a value vs effort grid: a 2×2 with value on one axis and effort on the other. Each corner comes with its own instruction.
- Quick wins (high value, low effort): do them soon; a real gain for little work.
- Big bets (high value, high effort): plan them, split them into steps and test the riskiest assumption first.
- Fill-ins (low value, low effort): only when there's spare capacity.
- Money pits (low value, high effort): avoid them, or rethink the solution, however exciting they sound.
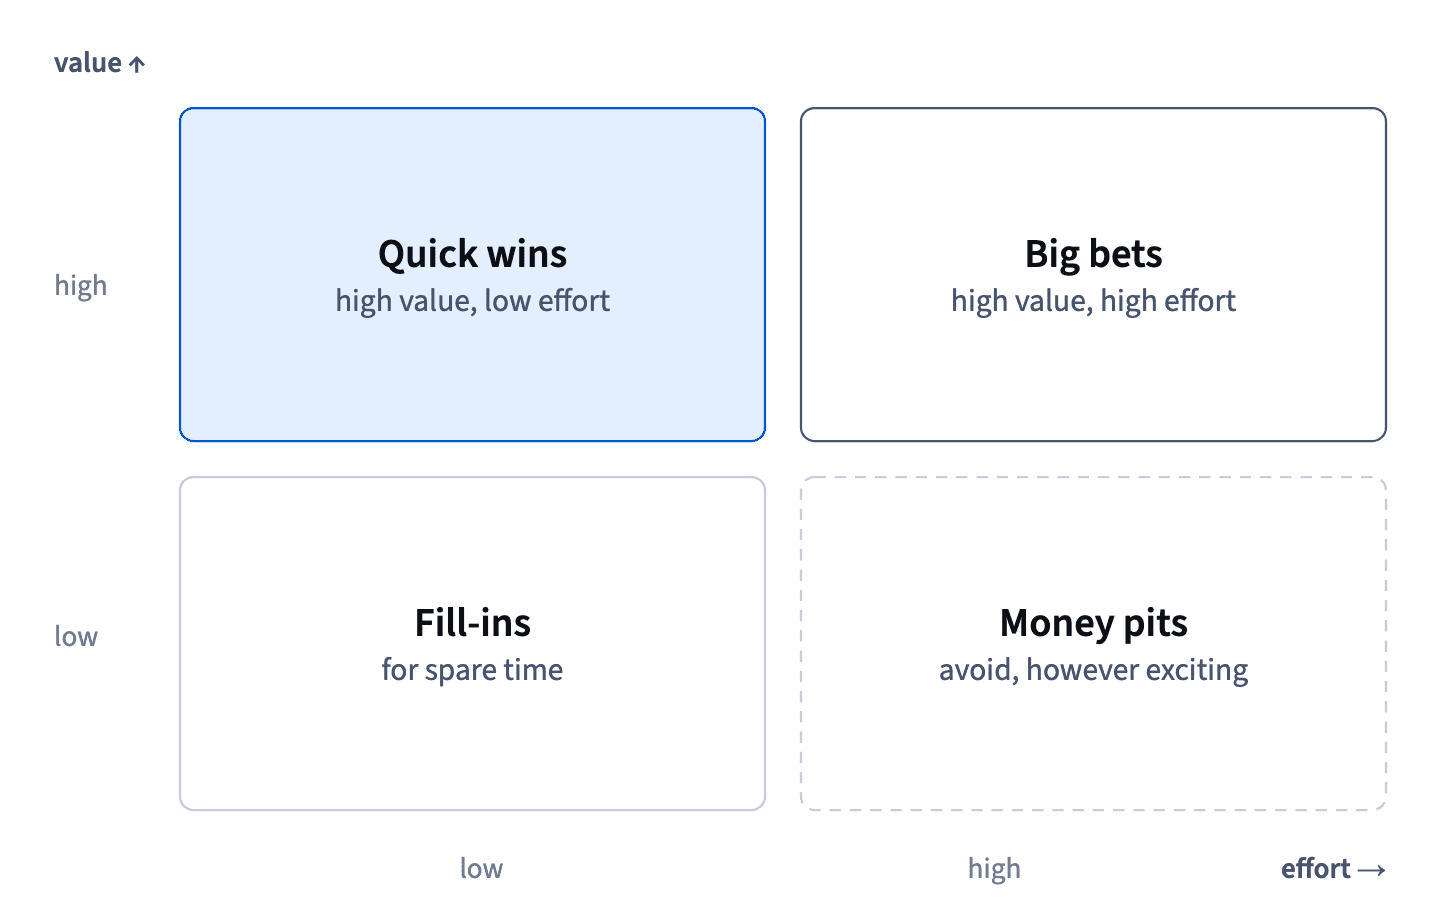
The grid is quick and easy to explain in a meeting. Its weakness is that “high value” is still a feeling. The next step is to score value against your objectives, so the corners rest on something people can check.
- DoClinic ordering portal: high value, high effort → a big bet: pilot a small form first
The corner tells you how to approach it.
- Don'tA complex cat-horoscope feature “because it's fun”
Low value, high effort: a money pit.
A value vs effort scorecard
A value vs effort scorecard makes “high value” less of a feeling by scoring it against your objectives.
Value: for each objective, give the candidate 0, 1 or 2 (no effect, some, a lot), and add them up. Negatives are allowed: if a candidate hurts one objective, score it −1 there. Effort: T-shirt sizing is enough: XS, S, M, L and XL, counted as 1 to 5. Relative sizes, with no calendar attached, are easier for engineers to give honestly than days. Confidence: a risk discount, written as a fraction.

Score = value ÷ effort × confidence.
The online order form: 2 for clinics, 0 for subscribers, size S, 80% sure: 2 ÷ 2 × 0.8 = 0.8. The idea of Brandon, the key account manager, of letting clinic orders skip the warehouse queue helps clinics (+2) but makes subscriber boxes wait longer (−1). Value 2 + (−1) = 1, so 1 ÷ 2 × 0.8 = 0.4. The negative halves the score, and that's the point: a scorecard shows the cost to one group that a single “value” number would hide.
- DoSkip-the-queue: (2 + (−1)) ÷ 2 × 0.8 = 0.4
The cost to subscribers is counted.
- Don'tSkip-the-queue: 2 ÷ 2 × 0.8 = 0.8
The typical slip: dropping the −1, so it ties with the form.
RICE scoring
RICE scores one candidate against one objective: Reach × Impact × Confidence ÷ Effort.
- Reach: how many customers the item touches in a period, here per quarter.
- Impact: how far it moves each of them towards that objective's key results, on fixed steps: 3 massive, 2 high, 1 medium, 0.5 low, 0.25 minimal.
- Confidence: 100% for tested results, 80% for a clear pattern in data, 50% for a few requests or a hunch. Use it as a fraction: 0.8, not 80.
- Effort: person-months for everyone involved, not only engineering.
Flexible delivery dates: 1,500 subscribers × 2 × 0.8 = 2,400; ÷ 4 person-months = 600. One-click reorder: 1,200 × 1 × 0.8 ÷ 1 = 960. Apple Pay and Google Pay at checkout: 3,000 × 0.25 × 0.8 ÷ 0.5 = 1,200.
Dataset · 9 rows
CatChow candidate solutions, scored in November
Nine candidates from CatChow's roadmap with the RICE inputs Sofia and Lucy agreed in mid-November. Reach is per quarter; effort is in person-months for everyone involved. Synthetic data made for this course.
First 5 of 9 rows
The fixed steps are what make RICE comparable: if every team invents its own impact scale, the scores mean nothing side by side. Agree the scales once, write examples next to them, and reuse them.
- Do1,500 × 2 × 0.8 ÷ 4 = 600
Confidence as a fraction, divided by everyone's effort.
- Don't1,500 × 2 × 80 ÷ 4 = 60,000
Typical slip: confidence as 80 instead of 0.8.
- Don't1,500 × 2 × 0.8 = 2,400
Typical slip: forgetting to divide by effort.
Rank within each objective
RICE scores only compare when they share a unit of reach. CatChow's clinic items count clinics (54 of them); its subscriber items count people (thousands). So every clinic item scores far below the subscriber items, not because it matters less, but because the units differ.
The online order form for clinics: 54 × 1 × 0.8 ÷ 1 = 43.2. Automatic reorders: 54 × 2 × 0.5 ÷ 3 = 18. The portal: 54 × 2 × 0.5 ÷ 6 = 9. Inside the clinic objective, that order means something: the pilot raised the form's confidence, and it's small.
Dataset: CatChow candidate solutions, scored in November · shown above
Put 43.2 next to the 600 for flexible delivery dates, though, and the comparison is empty. Rank within each objective.
That leaves a question no score can answer: how capacity is split between objectives, for example most of the team on keeping subscribers and a fixed share on clinics. The split is a strategy decision, one of the choices behind the objectives in module 2, made before anyone scores. Scores then rank only inside each share.
When you check a row by hand, keep every factor, confidence included: it's the one most often dropped.
- DoOnline order form: 54 × 1 × 0.8 ÷ 1 = 43.2, first among the clinic items
Ranked against items with the same unit of reach.
- Don't54 × 1 ÷ 1 = 54
Typical slip: dropping confidence.
- Don't“The form scores 43.2 and flexible dates 600, so subscribers matter more.”
Clinics and people aren't the same unit.
- Do“Two thirds of the team on subscribers, one third on clinics; RICE orders the work inside each.”
The split is decided first, by strategy.
Honest inputs: confidence, impact, effort
The same formula gives very different answers depending on who fills it in. The founders scored loyalty points with impact 2, confidence 100% and effort 2: 5,000 × 2 × 1.0 ÷ 2 = 5,000. The honest version is 5,000 × 1 × 0.5 ÷ 8 = 312.5, sixteen times lower and the lowest in objective 1.
Dataset: CatChow candidate solutions, scored in November · shown above
Each input moved for a reason. Confidence is 50%, not 100%: the evidence is a few comments from long-term subscribers, and 100% is reserved for tested results. Impact is 1, not 2: points also reward people who were staying anyway, so much of the effect lands on subscribers you weren't going to lose. Effort is 8 person-months, not 2: two months is only engineering's part; add the points rules, finance, emails, support training and marketing.
Honest confidence and impact account for a factor of four; counting everyone's effort accounts for another four. 4 × 4 = 16.
That's why effort always counts everyone involved. A feature that is cheap for engineering can still be expensive for the company.
- DoLoyalty points: 5,000 × 1 × 0.5 ÷ 8 = 312.5
Evidence-based confidence, everyone's effort.
- Don't5,000 × 1 × 0.5 ÷ 2 = 1,250
Typical slip: counting only engineering's two months.
- Don't5,000 × 2 × 1.0 ÷ 2 = 5,000
The founders' inputs: 100% confidence on a few comments.
False precision and gaming
A RICE score multiplies four estimates, so the warning about false precision from Going deeper applies in full: the quiz (450) isn't clearly ahead of loyalty points (312.5). Round, call close scores a tie, or group them into high, medium and low.

Dataset: CatChow candidate solutions, scored in November · shown above
The risk this lesson adds is gaming: whoever wants an item rates it high. The founders' ten out of ten is the classic case. Four guards keep scores honest:
- Define each step of the scale with an example from past work, so “impact 2” means the same to everyone.
- Score together as a group, not alone, so one person's enthusiasm meets others' doubts.
- Ask for evidence behind any confidence above 50%.
- Compare estimates with results after launch, so the team learns how good its guesses are.
Two habits make things worse: letting requesters score their own ideas, and showing scores to two decimal places so they look exact.
A score starts the conversation; it doesn't end it. Its real job is to show which estimates are worth arguing about.
- DoQuiz ≈ 450, loyalty points ≈ 300: both “medium”, worth a closer look
Rounded and grouped, not ranked to the decimal.
- Don'tLoyalty points 312.50 vs quiz 450.00: the quiz wins
Decimals on top of guesses.
A high score isn't a strategy
Once every candidate is scored, the top of the list can surprise you. At CatChow, Apple Pay and Google Pay at checkout leads objective 1 with 1,200, ahead of everything that serves a theme. The arithmetic is right: it's tiny (half a person-month) and reaches 3,000 buyers. But its impact on the key results is minimal (0.25), and it serves no theme.
Dataset: CatChow candidate solutions, scored in November · shown above
That's a quick win without strategic weight. Doing it when there's slack is fine, as a fill-in. Putting it first in Now, or filing it under “Subscribers never run out” to make the theme look stronger, would pass it off as progress on something it barely touches.
The bottom of the list needs the same care. The warehouse replacement scores 1.8, dead last. On its own it changes little for clinics, but like any enabling work it is judged by what it unlocks, so in time it goes first anyway.
A ranking is a picture of your estimates. Read it with the themes and dependencies beside it before you act on it.
- DoApple Pay and Google Pay: a fill-in for spare capacity, outside the themes
High score, low impact: done when there's slack.
- Don'tPut the highest RICE score first in Now, whatever it serves
Lets a tiny quick win pass as progress.
Cost of delay and WSJF
RICE has no clock. It can't tell you that something loses value every week it waits. Cost of delay asks exactly that: what do we lose for every week this item isn't done? For CatChow's clinic solution, the conference on 23 May makes the loss concrete: if clinics can order online by then, Brandon can sign new clinics right at the stand.

WSJF, weighted shortest job first, puts cost of delay next to size: WSJF = cost of delay ÷ job size, and the highest ratio goes first. That way short, urgent work goes ahead of long work of similar value.
An example in relative points. Online order form: cost of delay 8, size 2, so 8 ÷ 2 = 4. Clinic portal: cost of delay 9, size 6, so 9 ÷ 6 = 1.5. The portal loses slightly more per month of waiting, but the form delivers its value much sooner, so it goes first.
Both inputs are estimates, so the same cautions apply as for RICE: agree the scales, score together and don't trust small differences.
- DoForm: 8 ÷ 2 = 4 · Portal: 9 ÷ 6 = 1.5 → the form first
Cost of delay weighed against size.
- Don't“The portal has the higher cost of delay (9), so it goes first.”
Typical slip: forgetting to divide by size.
MoSCoW communicates priorities; it doesn't set them
The MoSCoW method sorts a release's scope into four groups: Must have, Should have, Could have and Won't have this time. It's a clear way to tell a team and its stakeholders what's in a release, what's optional and what's deliberately left out.
What MoSCoW doesn't do is decide which items deserve to be Musts. It has no criteria of its own. If people label items before the scoring is done, “Must have” simply records who argued hardest, and it becomes the same loud-voice ranking in a new format. The founders' sheet with “Must have” next to loyalty points is exactly that.
So use it in the right order. First set priorities with criteria from your objectives and with scores. Then use MoSCoW to communicate the scope of a particular release. And keep “Won't have this time” honest: it's a real answer, not a hidden Later.
How it fits together: Each tool answers one question: the matrix, where to look; the scorecard, trade-offs between objectives; RICE, order inside one objective; cost of delay and WSJF, what loses value by waiting; MoSCoW, what's in this release. None decides alone. Next: handling an answer that disappoints someone.
- DoScores and criteria first; then “Must: online order form · Won't this time: portal”
MoSCoW tells people what's already decided.
- Don't“Loyalty points: Must have” written before anything is scored
A label replacing the decision.
Ready to practise?
Answer the lesson's exercises and earn 250 points the first time you finish it.
Start the exercises