

Theory
Many tests at once
The complement rule, multiplying independent chances, the chance of at least one false alarm, counting pairs and the Bonferroni split.
~9 min read · 9 exercises · 250 points
Before you start
Five metrics, one test
Still at Klasna. The growth team tested a new price page and checked five metrics at once, from sign-ups to average package size. One of the five came out "significant", and it sounds like a real effect.
You'll work out how likely at least one false alarm is when nothing changed at all, using the rule for "this and that" and the complement, and see what a team can do about testing many things at once.
Independent events multiply
Two events are independent when knowing that one happened doesn't change the chance of the other. A tutor confirming a lesson and a learner showing up can be close to that: the learner's habits don't depend on the tutor's message.
For independent events, the chance that both happen is the product: P(A and B) = P(A) × P(B). With 0.7 and 0.9 that is 0.63. Multiplying shares always gives something smaller than either factor, which matches common sense: two things lining up is rarer than one.
The rule extends to any number of events. If one check stays quiet with probability 0.95, two independent checks both stay quiet with 0.95 × 0.95 = 0.9025, and five with 0.95⁵ ≈ 0.774.
Two slips to avoid: adding the probabilities (that can exceed 1) and averaging them. And check independence first; related events need the conditional probability from Conditional probability and the 2×2 table.
- Do"Confirmed 0.7, attended 0.9, independent: both 0.7 × 0.9 = 0.63."
- Don't"Both happen with probability 0.7 + 0.9 = 1.6."
A probability above 1 is always a sign of adding where you should multiply.
At least one false alarm = 1 − none
Every significance check has a small false-alarm rate α, usually 0.05: the chance it calls a change "significant" when nothing changed. One check is a 5% risk. Several checks are several tickets in the same lottery.
Counting "at least one false alarm" directly means adding up one alarm, two alarms, three… The complement from p and 1 − p is much shorter. "No false alarm at all" means every check stays quiet; for independent checks that is (1 − α)^m. So P(at least one) = 1 − (1 − α)^m.
For Klasna's price-page test with five metrics: 1 − 0.95⁵ = 1 − 0.774 = 0.226, almost a quarter. Ten metrics give 1 − 0.95¹⁰ = 1 − 0.599 = 0.401, and twenty give 0.642.
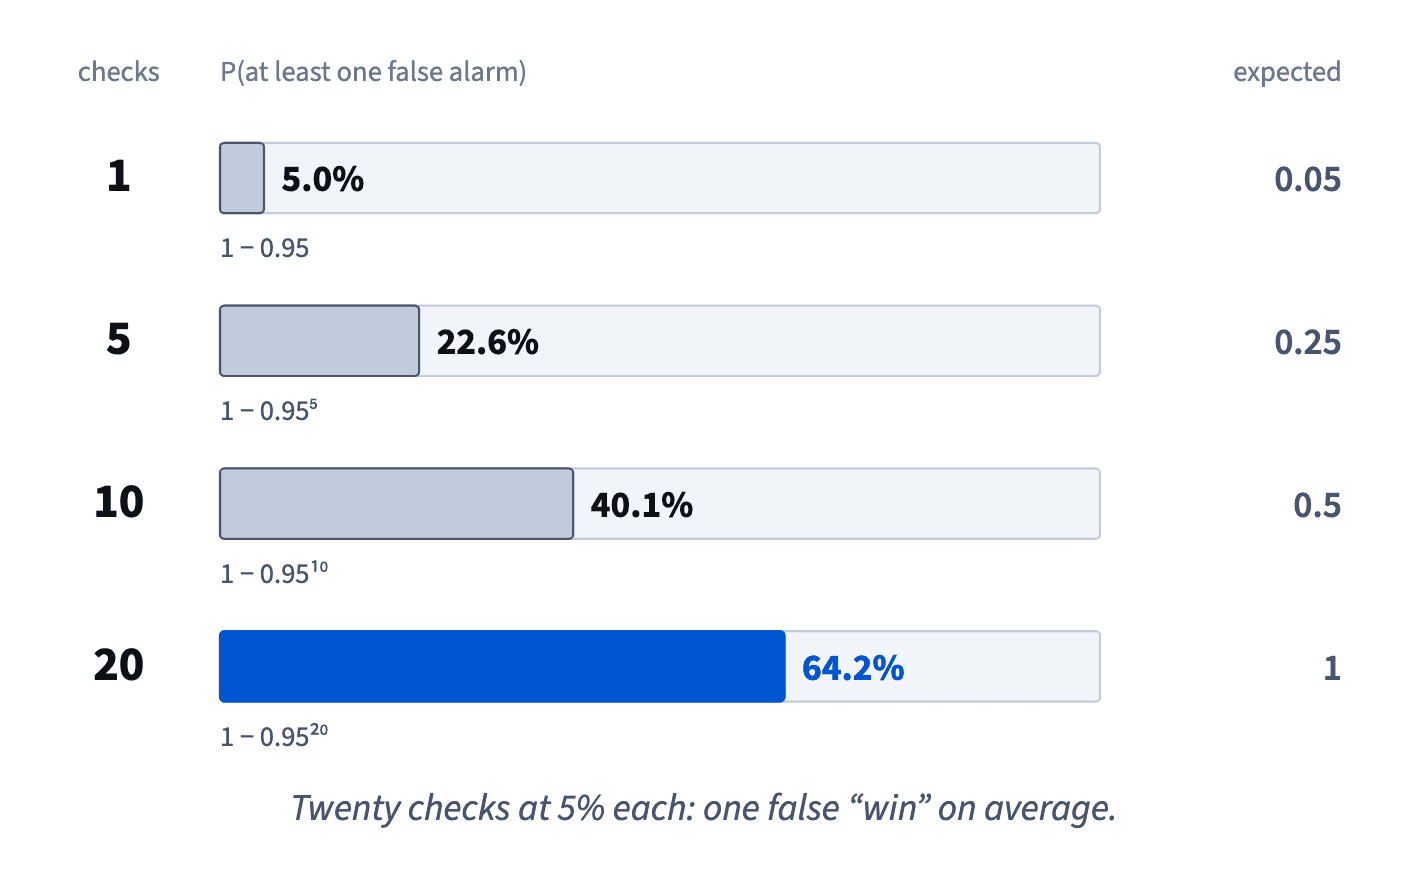
So a single "significant" metric out of many is weak evidence: with enough checks, a false alarm somewhere is the normal outcome, not a surprise.
- Do"We checked ten metrics, so a 40% chance of at least one false alarm comes with the dashboard."
- Don't"One metric of five is significant at 5%, so the page surely works."
With five checks, a lone alarm turns up 22.6% of the time by chance.
Why m × α is not the chance of an alarm
A tempting shortcut is to add the risks: three checks at 5% make 15%. It is close for a few checks and wrong in principle.
Adding counts the overlaps more than once. A run where two checks both raise a false alarm is counted in the first 5% and again in the second. The exact chance of at least one alarm among three independent checks is 1 − 0.95³ = 1 − 0.857 = 0.143, a bit under 15%.
The gap grows fast. Twenty checks at 5% would "add up" to 100%, a certainty, yet 1 − 0.95²⁰ = 0.642. Forty would give 200%, which no probability can be.
The sum m × α does have a meaning, just a different one: the expected number of false alarms, which can be above 1. Keep the two apart: 1 − (1 − α)^m is a chance between 0 and 1; m × α is a count.
- Do"Three checks: 1 − 0.95³ ≈ 14.3% chance of at least one false alarm."
- Don't"Twenty checks at 5% each, so a false alarm is 100% certain."
The real chance is 64.2%; 20 × 5% = 1 is the expected count.
Related checks and the upper bound
The formula 1 − (1 − α)^m multiplies "stays quiet" across checks, so it assumes the checks are independent events. Product metrics rarely are: sign-ups and trial bookings rise and fall together, and so do package purchases and Club conversion.
Formula: α: the false-alarm rate of one check; m: the number of independent checks. · shown above
Related checks tend to raise their false alarms together. When sign-ups jump by chance, trial bookings often jump with them, so the two count as roughly one ticket in the lottery, not two. Fewer separate tickets mean a lower chance of being fooled.
So for Klasna's five related metrics the true chance of at least one false alarm sits between two bounds: 5% (as if all five were one check) and 22.6% (as if all five were independent). The formula gives the upper bound.
That makes it the safe number to plan with. If even the upper bound is acceptable, you're fine; if not, cut the number of checks or correct for them.
- Do"Our five metrics are related, so the false-alarm risk is somewhere between 5% and 22.6%; we plan with 22.6%."
- Don't"The metrics are related, so the formula doesn't apply and there is no risk to worry about."
Related checks lower the risk, they don't remove it.
Expected false alarms: m × α
A second way to see the same risk is to count. If each of m checks has a false-alarm rate α, the expected number of false alarms when nothing changed is m × α. Five metrics give 5 × 0.05 = 0.25; twenty give 20 × 0.05 = 1.
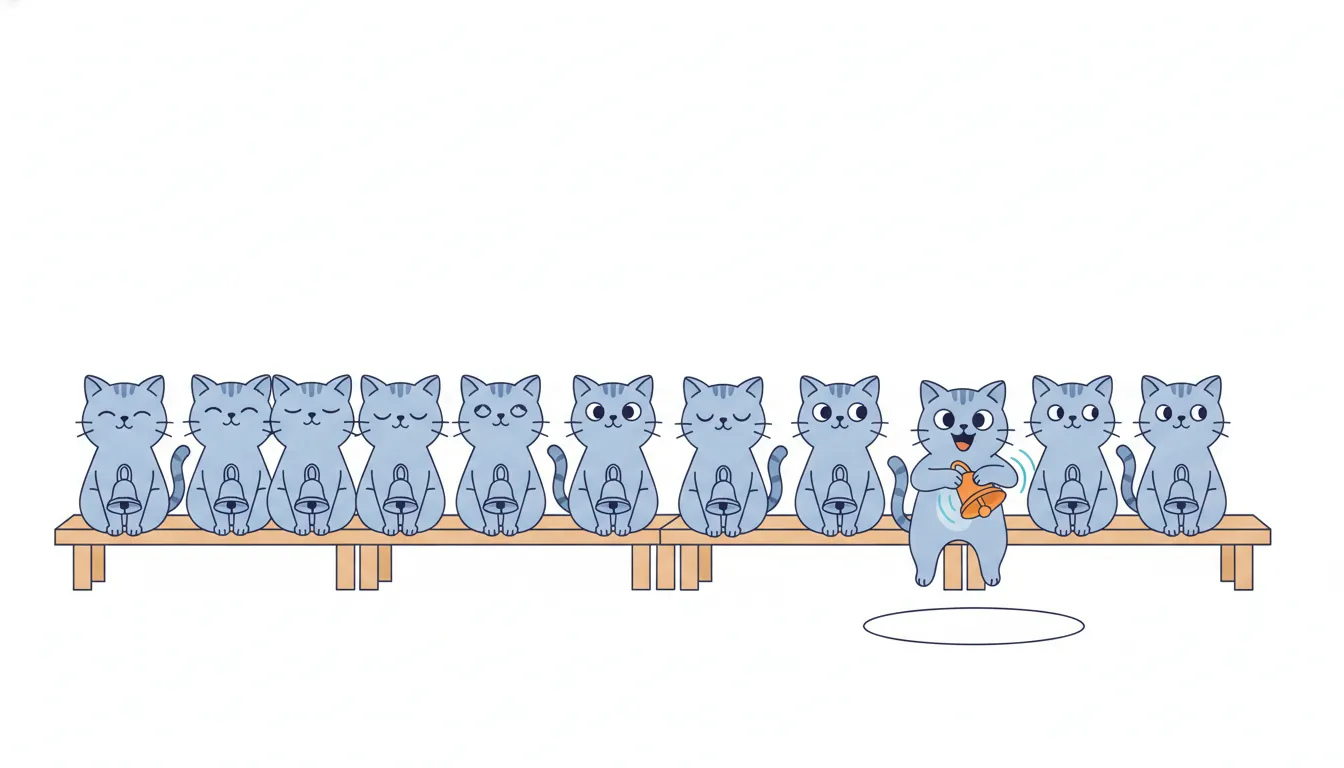
This reading is the clearest defense against sliced results. An analyst who splits a test that showed nothing into 40 segments (cities, devices, ages) and checks each one at 5% should expect 40 × 0.05 = 2 "significant" segments from pure noise. Finding two winners is not a discovery; it is the forecast.
The count also explains why a lucky slice is so convincing: the story behind it (Lviv likes the ad, tablets prefer the new page) is easy to invent afterwards. Treat such a slice as a hypothesis for a new test, with that segment named in advance as the primary one.
- Do"40 segments at 5% means about 2 fake winners; let's retest the best one on its own."
- Don't"Two of forty segments are significant, so the change works for them."
That is exactly what noise predicts.
Counting pairs: k(k − 1)/2
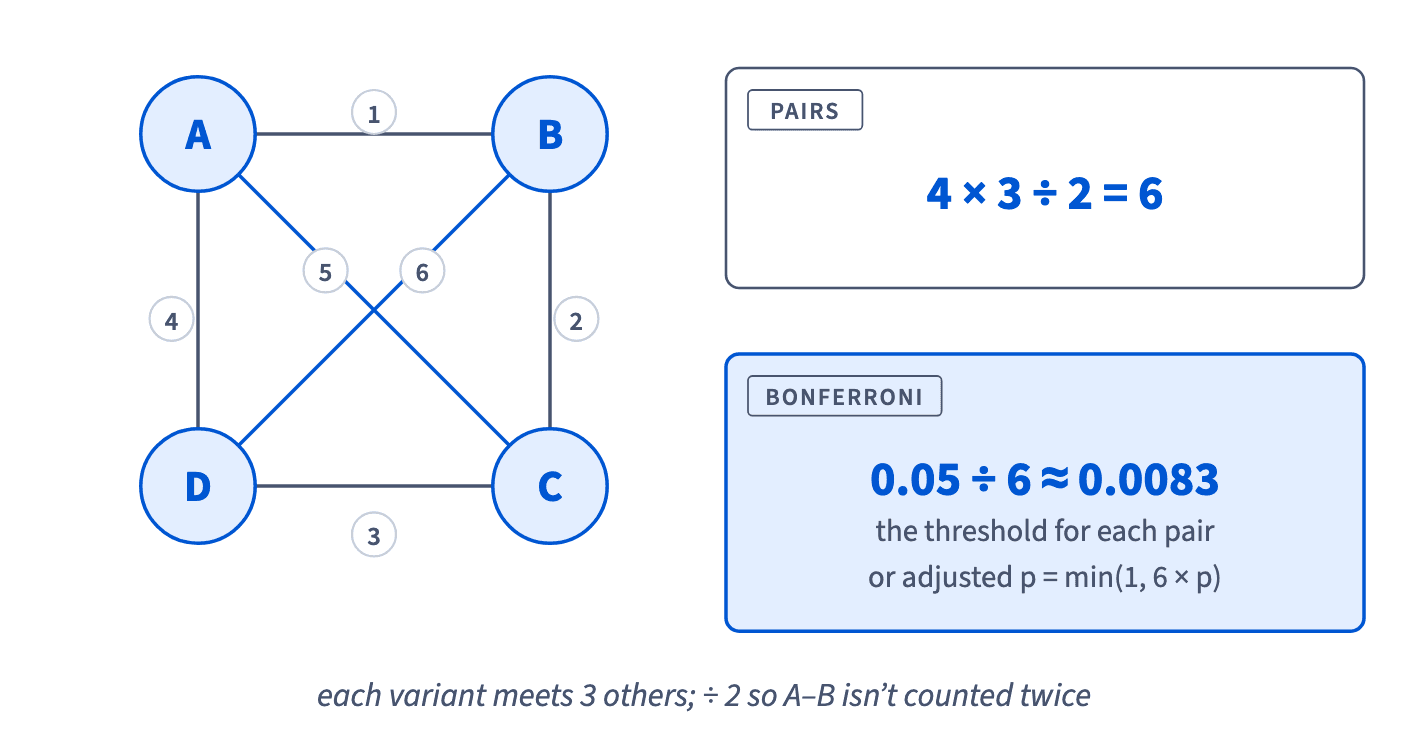
Tests with several variants multiply the checks too. Klasna's price page had four versions, A, B, C and D. Comparing every version with every other: each meets the three others, 4 × 3 = 12, but that counts A–B and B–A separately, so halve it: 6 pairs.
In general, the number of pairs among k items is k(k − 1)/2. Four variants give 6, five give 10, ten give 45. The count grows roughly with the square of k, so the false-alarm risk grows much faster than the number of variants.
One design choice cuts it sharply: compare each new variant only with the control instead of with every other variant. With five variants that is 4 comparisons instead of 10. Decide which comparisons matter before the test, and count them; that count is the m you will correct for.
- Do"Five variants, each against control A only: 4 comparisons."
- Don't"Five variants, so five comparisons."
Every pair is 5 × 4 ÷ 2 = 10; against control it is 4.
The Bonferroni split: α ÷ m, or m × p
The simplest fix shares the 5% among the checks: test each of m comparisons at α ÷ m. With six pairs, 0.05 ÷ 6 ≈ 0.0083 per pair. Then the chance of any false alarm across all six stays at about 5% or below.
Software often shows the same rule turned around, as an adjusted p: min(1, m × p), compared with the usual 0.05. A pair with p = 0.012 among six gives 6 × 0.012 = 0.072: not significant any more. A pair with p = 0.004 gives 0.024: still significant. The min caps the result at 1, because a probability can't exceed 1.
Both forms give the same verdict: p < α ÷ m exactly when m × p < α. Use whichever your tool shows, but always know what m is: the number of comparisons actually made, counted before looking at the results.
- Do"Six pairs: B vs D has p = 0.004, adjusted 0.024 < 0.05, so it holds."
- Don't"A vs C has p = 0.012 < 0.05, a win," among six pairs.
Adjusted, it is 6 × 0.012 = 0.072, above 0.05.
The cheaper defense is fewer checks
Bonferroni is strict. It protects against false alarms by lowering the bar for every check, and a lower bar also makes real effects harder to see. With 120 checks the bar is 0.05 ÷ 120 ≈ 0.0004, which only a large effect clears.
The better defense costs nothing: make fewer checks. Before the test, name one primary metric and the comparisons that matter. Four variants against the control on one metric is m = 3, a bar of 0.05 ÷ 3 ≈ 0.017. The other metrics still get looked at, but as hints that suggest the next test, never as the verdict of this one.
The same logic covers peeking and slicing: every extra look and every extra segment is another check, whether anyone counts it or not.
How it fits together: independent checks multiply, so "at least one false alarm" is 1 − (1 − α)^m, the expected count is m × α, pairs grow as k(k − 1)/2, and fewer checks or Bonferroni keep the risk low. Next: where 1.96 comes from, on the normal curve.
- Do"Primary metric: package purchases. Three comparisons with the control, each at 0.05 ÷ 3."
- Don't"We'll decide which metric matters once we see the results."
Choosing after the fact turns every metric into a check.
Ready to practise?
Answer the lesson's exercises and earn 250 points the first time you finish it.
Start the exercises