

Theory
Mann–Whitney: when data isn't normal
A rank-based test for skewed metrics like revenue and session length.
~12 min read · 11 exercises · 250 points
Before you start
A redesign and a 130-second visit
Same CatChow product team, new test: the product page was redesigned, and you have the time visitors spent on it, six sessions on the old page and six on the new one. One visitor on the new page stayed far longer than anyone else, most likely with the tab left open.
A single value like that can wreck a mean. In this lesson you'll meet a test that compares groups by the order of their values rather than their size.
Why a rank-based test shrugs off outliers
The t-test is built on means, and a mean listens to every value in proportion to its size. One 130-second session among sessions of about a minute drags the new page's mean from 64.6 to 75.5 seconds, and inflates the variance too. The t-statistic then depends heavily on one visitor who left a tab open.

The Mann-Whitney U test replaces each value with its rank: its position when both groups are sorted together. The 130-second session simply becomes "the longest one", rank 12. Whether it lasted 73 seconds or 7,300, its rank is the same, so it can't dominate the result.
That makes Mann-Whitney the natural choice for two independent groups when:
- one group has extreme outliers;
- the metric is heavily skewed, like revenue per user or session length;
- the data only exists as ranks or ordered categories.
It's not a universal replacement. For paired data you need a paired test, and yes/no outcomes call for a test on proportions.
- DoSession times with one 130-second tab left open → Mann-Whitney.
The outlier keeps its place but loses its pull.
- Don'tDelete the 130-second session and run a t-test, without saying so.
Silently drops real data to make the tool fit.
Ranking two groups together
Mann-Whitney starts by forgetting which group each value came from.
- Pool all observations from both groups into one list: 12 sessions here.
- Sort them from smallest to largest.
- Rank them: 1 for the shortest, 12 for the longest.
- Split the ranks back by group and add them up. Each total is a rank sum.
The old page's sessions (38, 42, 47, 49, 55, 61 seconds) land on ranks 1, 2, 3, 4, 5 and 8, so R₁ = 23. The new page gets ranks 6, 7, 9, 10, 11 and 12, so R₂ = 55.
Chart data
| Rank | Old page | New page |
|---|---|---|
| 1 | 38 | |
| 2 | 42 | |
| 3 | 47 | |
| 4 | 49 | |
| 5 | 55 |
Show 7 more rows
| 6 | 58 | |
| 7 | 60 | |
| 8 | 61 | |
| 9 | 65 | |
| 10 | 68 | |
| 11 | 72 | |
| 12 | 130 |
A built-in check catches slips: the ranks 1 to N always add up to N(N + 1) / 2. With N = 12 that's 12 × 13 / 2 = 78, and indeed 23 + 55 = 78.
The intuition: if both pages were alike, their ranks would be mixed and each rank sum would sit near half of 78, that is 39. A rank sum far from 39, like 23, means one group's values tend to sit at the bottom of the combined list.
- DoOld page ranks 1 + 2 + 3 + 4 + 5 + 8 = 23; check 23 + 55 = 78 = 12 × 13 / 2.
Rank both groups together, then sum per group.
- Don'tRanking each page separately: old 1–6, new 1–6, so both sums are 21.
Separate rankings erase any difference between the groups.
From a rank sum to U
A rank sum depends on group size, so it's converted into a cleaner number, U:
U₁ = R₁ − n₁(n₁ + 1) / 2
The subtracted part is the smallest rank sum a group of n₁ could possibly have: ranks 1 to 6 add up to 6 × 7 / 2 = 21. So U₁ measures how far above that floor the group landed. For the old product page in CatChow's test (6 sessions, rank sum R₁ = 23): 23 − 21 = 2.
U has a neat meaning: it counts pairwise wins. Take every pair of one old-page session and one new-page session, 6 × 6 = 36 pairs, and count how often the old page's session is the longer one. Only the 61-second old session beats two new ones (58 and 60), so U₁ = 2.
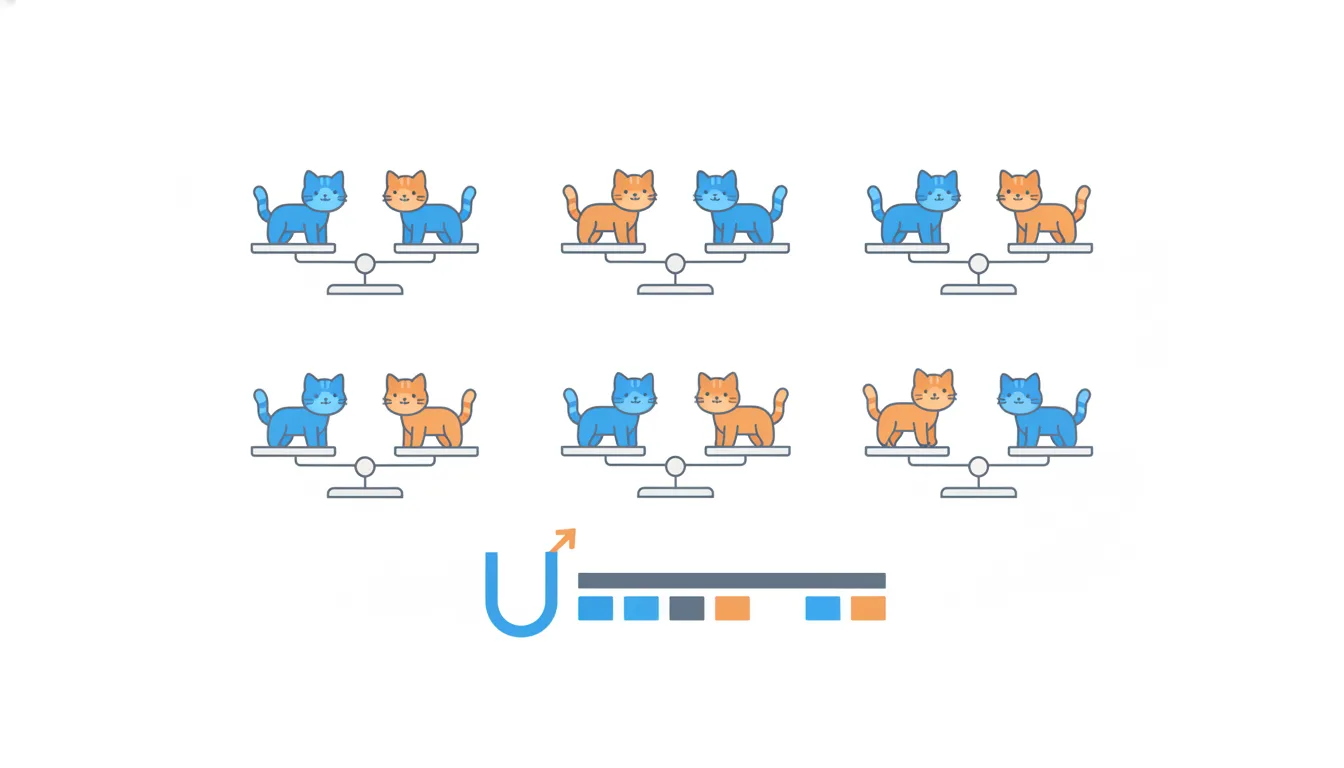
So a U near 0 means one group almost never beats the other; a U near half the pairs (18 here) means the groups are well mixed. The old page winning just 2 of 36 matchups is a strong hint that the new page holds visitors longer.
- DoU₁ = 23 − 6 × 7 / 2 = 23 − 21 = 2
Subtract the smallest possible rank sum.
- Don'tU₁ = 23 − 12 × 13 / 2 = −55
Uses the total N instead of the group's own n₁; U can never be negative.
U₂, the sanity check, and the test statistic
The same recipe works for the second group, the new product page (6 sessions, rank sum R₂ = 55):
U₂ = R₂ − n₂(n₂ + 1) / 2 = 55 − 21 = 34
Formula: Each group's U subtracts out the rank sum it would have if it only ranked against itself. The smaller of the two is the Mann-Whitney U statistic. · shown above
U₂ counts the pairs the new page wins: 34 of the 36.
Two checks are worth a few seconds:
- U₁ + U₂ = n₁ × n₂. Every pair has exactly one winner, so the wins add up to the number of pairs: 2 + 34 = 36 = 6 × 6. If they don't, a rank or a sum is wrong.
- The rank sums add up to N(N + 1) / 2: 23 + 55 = 78 = 12 × 13 / 2.
The test statistic is the smaller of the two:
U = min(U₁, U₂) = min(2, 34) = 2
Taking the smaller one makes the test work in both directions: whichever group tends to be higher, a lopsided split pushes the smaller U towards zero. Tables of critical values are built for this smaller U, so always compare min(U₁, U₂), never the bigger value.
- DoU₂ = 55 − 21 = 34; check 2 + 34 = 36 = 6 × 6; U = min(2, 34) = 2.
Both U values, a check, then the smaller one.
- Don'tReporting U = 34 and comparing it with the critical value of 5.
The table is for the smaller U; 34 would wrongly look “not significant”.
The decision rule runs backwards
In a t-test, a big statistic is the exciting one: |t| above the critical value means reject H0. Mann-Whitney works the other way round.
Reject H0 when U ≤ the critical value.
Why? U counts how often one group beats the other. If the groups came from the same distribution, the wins would split roughly evenly, about half of n₁ × n₂ each. A small U means one group almost never wins: the ranks barely overlap, and that's evidence of a real difference.
The critical value comes from a table for the given group sizes and significance level. For n₁ = n₂ = 6, two-tailed at α = 0.05, it's 5. In CatChow's product page test (6 sessions per page) U = 2 ≤ 5, so the difference in session length is significant at 5%. With n₁ = n₂ = 8 it's 13: a U of 25 there would not be significant.
This backwards rule is the most common mistake in Mann-Whitney write-ups. Before you conclude anything, say the rule out loud: "small U, significant".
- DoU = 2, critical 5 (n₁ = n₂ = 6): 2 ≤ 5 → reject H0.
Small U, significant.
- Don'tU = 25, critical 13 (n₁ = n₂ = 8): “25 > 13, significant!”
Applies the t-test's direction; here the groups overlap a lot.
What a Mann-Whitney result says
Mann-Whitney doesn't compare means. It asks whether values from one group tend to rank higher than values from the other. A significant result supports a sentence like "sessions on the new page tend to be longer".
So report it with numbers that match that question:
- medians of each group: 48 seconds on the old page, 66.5 on the new;
- the share of pairwise wins: the old page's session was longer in only 2 of 36 pairs (U₁ = 2), the new page's in 34;
- the test result: U = 2, critical value 5, significant at 5%.
The tempting mistake is to run a rank test and then report the difference in means. Here the means are 48.7 and 75.5 seconds, a gap of 26.8, but 130 seconds from one open tab is a big part of that. Without it, the new page's mean is 64.6. You chose Mann-Whitney precisely because the means weren't trustworthy, so don't bring them back in the headline.
If you need a size of effect in seconds, the difference in medians, about 18.5 seconds, is the honest companion.
- Do“New page sessions tend to be longer (median 66.5 s vs 48 s; U = 2, p < 0.05).”
Robust numbers that match what the test checks.
- Don't“Mann-Whitney proves the new page adds 26.8 seconds on average.”
A rank test says nothing about means, and this mean is inflated.
Parametric and non-parametric tests
Four words carry the whole method:
- a rank is an observation's position when both groups are sorted together, 1 for the smallest;
- a rank sum (R) is the total of the ranks that belong to one group;
- the U statistic is the smaller of U₁ and U₂, the number compared with the critical value;
- a non-parametric test makes no assumption about the shape of the distribution.
The last one deserves a closer look. A parametric test, like the t-test, assumes the data (or at least the sample means) follow a known shape, the normal distribution, described by parameters such as the mean and the standard deviation. A non-parametric test like Mann-Whitney works only with order, so the shape doesn't matter.
"Non-parametric" doesn't mean "assumption-free". Mann-Whitney still needs two independent groups, and its result is about one group tending to rank higher than the other, not about means. Keep the vocabulary straight in reports: "rank sum 23" and "U = 2" are different numbers.
- Do“Rank sums 23 and 55; U = min(2, 34) = 2.”
Each number named for what it is.
- Don't“Non-parametric, so it works for before-and-after data on the same users too.”
Mann-Whitney still needs independent groups.
Mann-Whitney or t-test: the trade-off
Ranking is a deliberate trade: you give up exact magnitudes to gain robustness. Whether that's a good deal depends on the data.
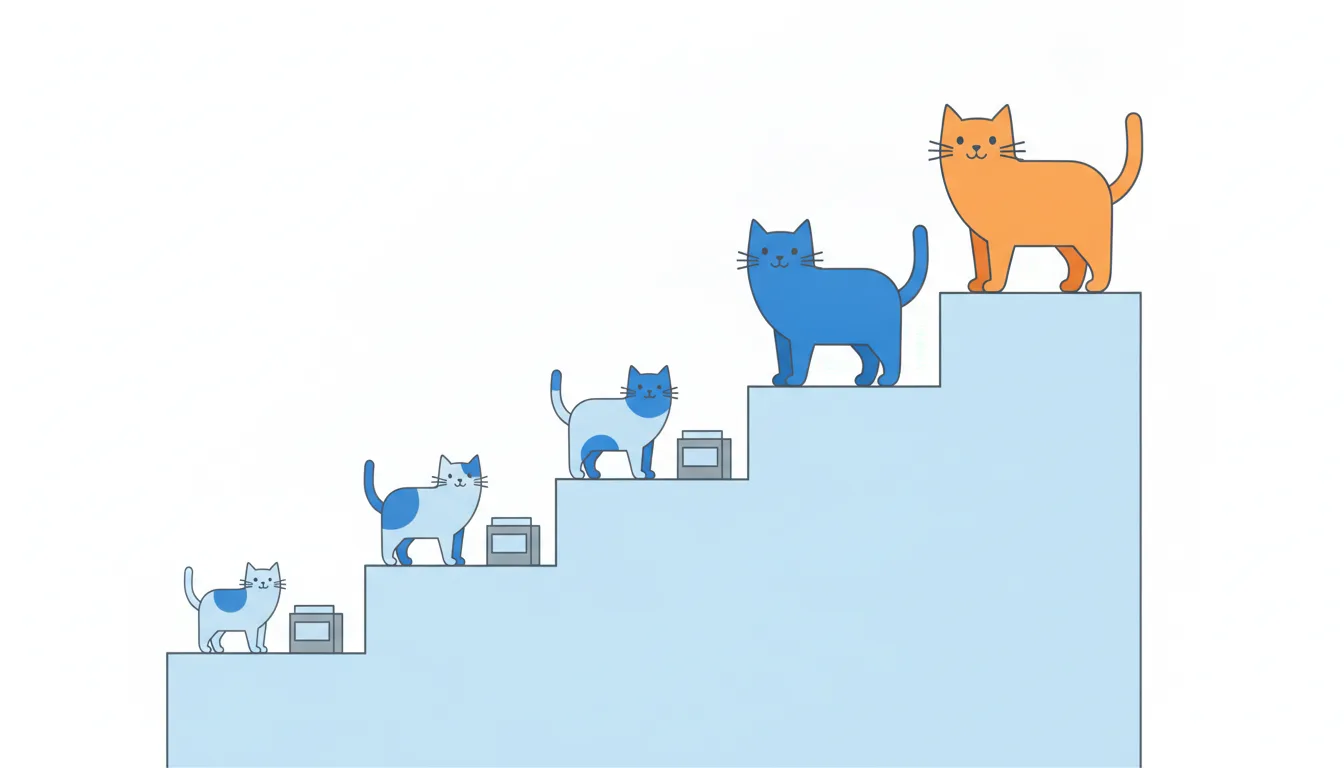
Reach for Mann-Whitney when:
- the metric is heavily skewed, with a long tail of high values (revenue per user, time in app);
- a few extreme values would dominate a mean;
- the data only exists as ranks or ordered categories ("1st, 2nd, 3rd", or satisfaction from "poor" to "great").
Stay with the t-test when the samples are large and roughly normal without nasty outliers. There, it's more powerful: from the same data it's better at detecting a real effect, because it uses the actual values rather than just their order.
Use neither when the outcome is yes/no (churned, converted, clicked). That's a comparison of proportions and needs its own test.
A practical habit: look at a histogram or box plot of each group first. Skew and outliers you can see are the reason to switch; "just to be safe" isn't.
- DoRevenue per user with a few whales in each group → Mann-Whitney.
Skew and outliers are visible in the data.
- Don'tAlways use Mann-Whitney “to be safe”, even on 20,000 clean, bell-shaped values.
Gives up power for nothing.
Ties: share the ranks
Real data has ties: two sessions of exactly 14 seconds, several customers who rated a product 4 stars. They can't both be rank 2 and rank 3, and picking one arbitrarily would change the result depending on which you put first.
The rule is simple: tied values share the average of the ranks they occupy.
- Sorted: 10, 14, 14, 20, 25, 30.
- The two 14s occupy ranks 2 and 3, so each gets (2 + 3) / 2 = 2.5.
- Everything after continues normally: 20 is rank 4.
The old page (10, 14, 20) gets ranks 1, 2.5 and 4, so R₁ = 7.5 and U₁ = 7.5 − 6 = 1.5. Fractional U values are normal when there are ties.
The usual checks still hold: the ranks add up to 6 × 7 / 2 = 21 (7.5 + 13.5), and U₁ + U₂ = 1.5 + 7.5 = 9 = 3 × 3. In pairwise terms, a tied pair counts as half a win for each side.
With many ties, software applies a small correction to the test; the averaging rule is what you need to compute ranks by hand.
- Do14, 14 on ranks 2 and 3 → both 2.5; R₁ = 1 + 2.5 + 4 = 7.5; U₁ = 1.5
Tied values share the average rank.
- Don'tOld page's 14 gets rank 2, new page's 14 gets rank 3 → U₁ = 1
The order you happened to list them in decides the result.
Ready to practise?
Answer the lesson's exercises and earn 250 points the first time you finish it.
Start the exercises