

Theory
Who is in the test: triggers and cluster randomization
Who belongs in an A/B test: triggered enrollment, dilution, and cluster randomization of whole groups when users affect each other.
~10 min read · 9 exercises · 250 points
Before you start
Why did the test find nothing?
Maya has an old Halves test result that disappointed the team. In spring they tested a suggestion to make a repeating bill recurring, and split everyone who opened the app between the two versions. The result was a fraction of a point, and nobody knows whether the idea failed or the test did.
In this lesson you'll look at who belongs in a test at all, how including people who can't see the change dilutes it, and what to do when users affect each other.
Dilution: an effect spread across people who never saw it
A test measures the average effect over everyone in it. If most of those people can never meet the change, their zero effect is averaged in.
The spring "Make it recurring?" test split all 34,000 weekly active users. Only 5,100 of them (5,100 ÷ 34,000 = 15%) added a bill that repeats an earlier one, the only situation in which the suggestion appears. Among those 15% it raised recurring set-ups by 3 pp. Everyone else had an effect of exactly zero. So across the whole test:
Overall effect = effect among the affected × share affected = 3 pp × 0.15 = 0.45 pp
That's dilution. The unaffected 85% cancel out in the difference between variants, but they don't cancel in the noise: their behavior still varies from person to person, so the interval stays wide while the effect shrinks to a fraction of a point.
The result is a test that reports "a fraction of a point, interval through zero" for a change that works well for the people it's built for.
- Do3 pp × (5,100 ÷ 34,000) = 3 × 0.15 = 0.45 pp overall
- Don't"The suggestion adds 3 pp across all users."
3 pp holds only for the 15% who could see it.
A diluted test isn't evidence of no effect
A diluted test is sized for an effect much smaller than the real one, so a flat result is not evidence of no effect (the power argument from How big and how long). Check who was in the test before concluding anything.
Across everyone, the recurring set-up rate goes from 0.15 × 24% + 0.85 × 2% = 5.3% in control to 5.75% with the suggestion. Detecting 5.3% → 5.75% with α = 5% and 80% power needs 40,414 users per variant. Among the users who add a repeat bill, the same change is 24% → 27%, which needs only 3,306 per variant: about twelve times fewer, and two weeks of repeat bills.
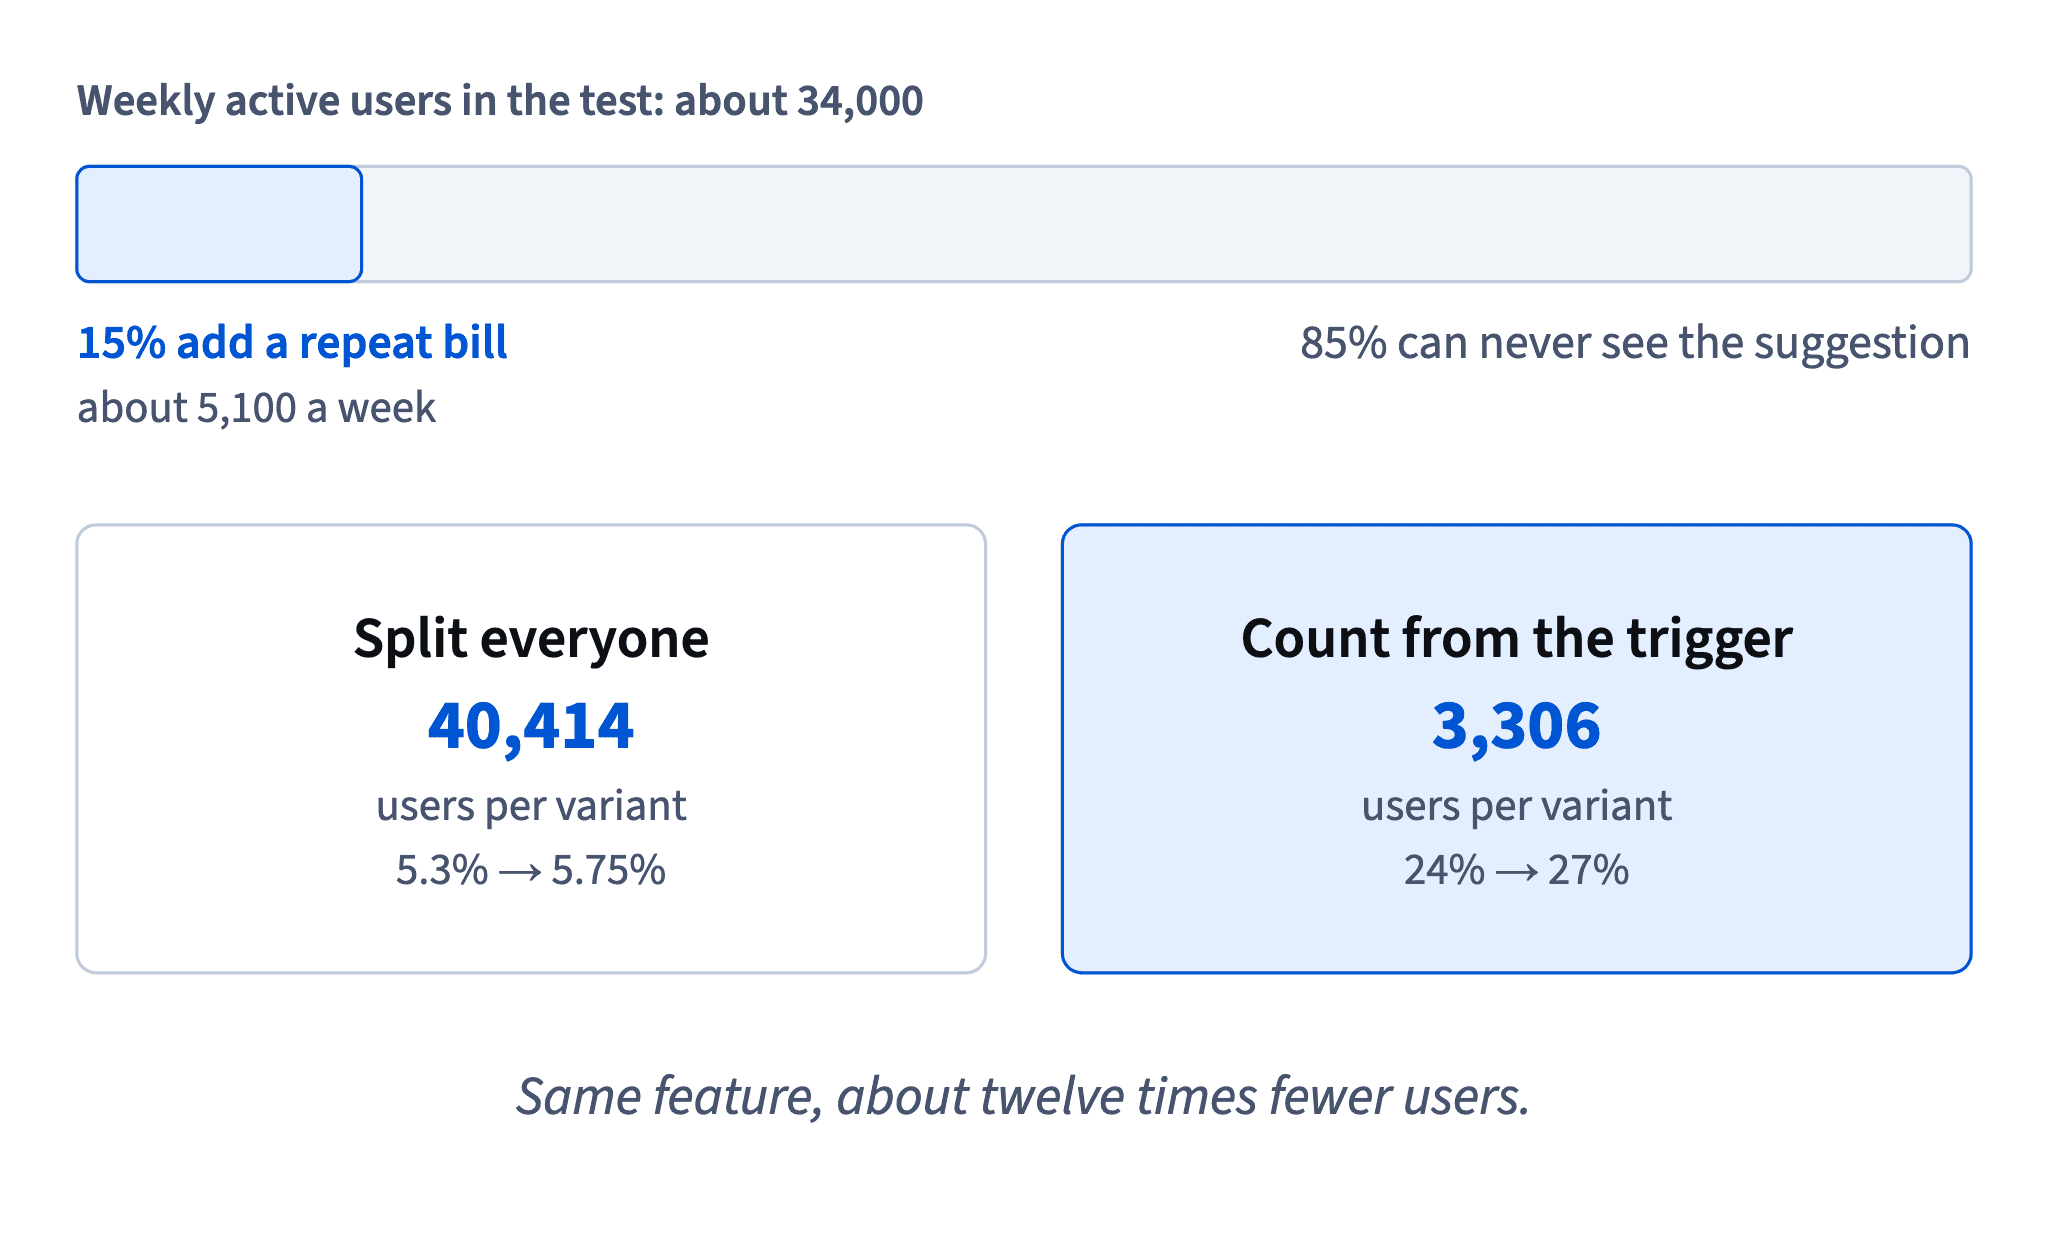
So the spring result says little about the suggestion. The test was sized for everyone and ran on everyone, while the effect lived in 15% of them. "Interval through zero" here means the test couldn't see the effect, not that there is none.
The honest reading is "inconclusive, because the test was diluted", followed by a rerun that counts only users who reach the moment the suggestion can appear. Dropping a feature after a flat diluted test throws away a change that may well work.
- Do"Inconclusive: 85% of the test could never see the suggestion. Rerun from the trigger: 3,306 per variant."
- Don't"Interval through zero, so the suggestion doesn't work. Remove it."
The test needed 40,414 per variant to see the diluted effect.
Triggered enrollment: count from where the versions can differ
Triggered enrollment fixes dilution: a user enters the analysis at the first moment the two versions could differ. For the "Make it recurring?" suggestion, that's adding a bill that repeats one from the month before.
A valid trigger has three properties:
- It happens the same way in both variants. Adding a repeat bill doesn't depend on whether the suggestion exists.
- It happens before the change can act. The suggestion appears only after the repeat bill is added.
- It's logged in control too. In control no suggestion appears, but the system still records "this user would have seen it now". Without that log you can't build the matching control group.
You may assign the variant earlier, for instance at sign-up; what changes is where the counting starts.
The tempting mistake is a trigger the variant itself influences: setting up a recurring bill, or tapping the suggestion. The suggestion changes who does those things, so each variant would enroll a different kind of person and the comparison stops being fair. The paywall test follows the same rule: users enter at their first paywall_viewed, not at trial_started.
- DoTrigger: user adds a bill that repeats last month's (logged in both variants)
- Don'tTrigger: user taps "Make it recurring?"
Control never shows the button, and the variant decides who taps.
Network effects: when one user's variant leaks to another
A standard A/B test assumes each user's outcome depends only on their own variant. In a product built around groups, that assumption often fails.
Take a group plan, where one member pays and everyone in the group gets Plus. Split a flat of three by user, and one flatmate in the new variant may buy the plan, giving Plus to the two flatmates in control. Control is no longer control. People also compare screens: "why does your paywall offer a group plan and mine doesn't?"

That leak is a network effect between variants, and it usually makes the measured difference smaller than the real one, because control has partly received the treatment.
The fix is cluster randomization: flip the coin for whole groups, so every member of a group gets the same variant.
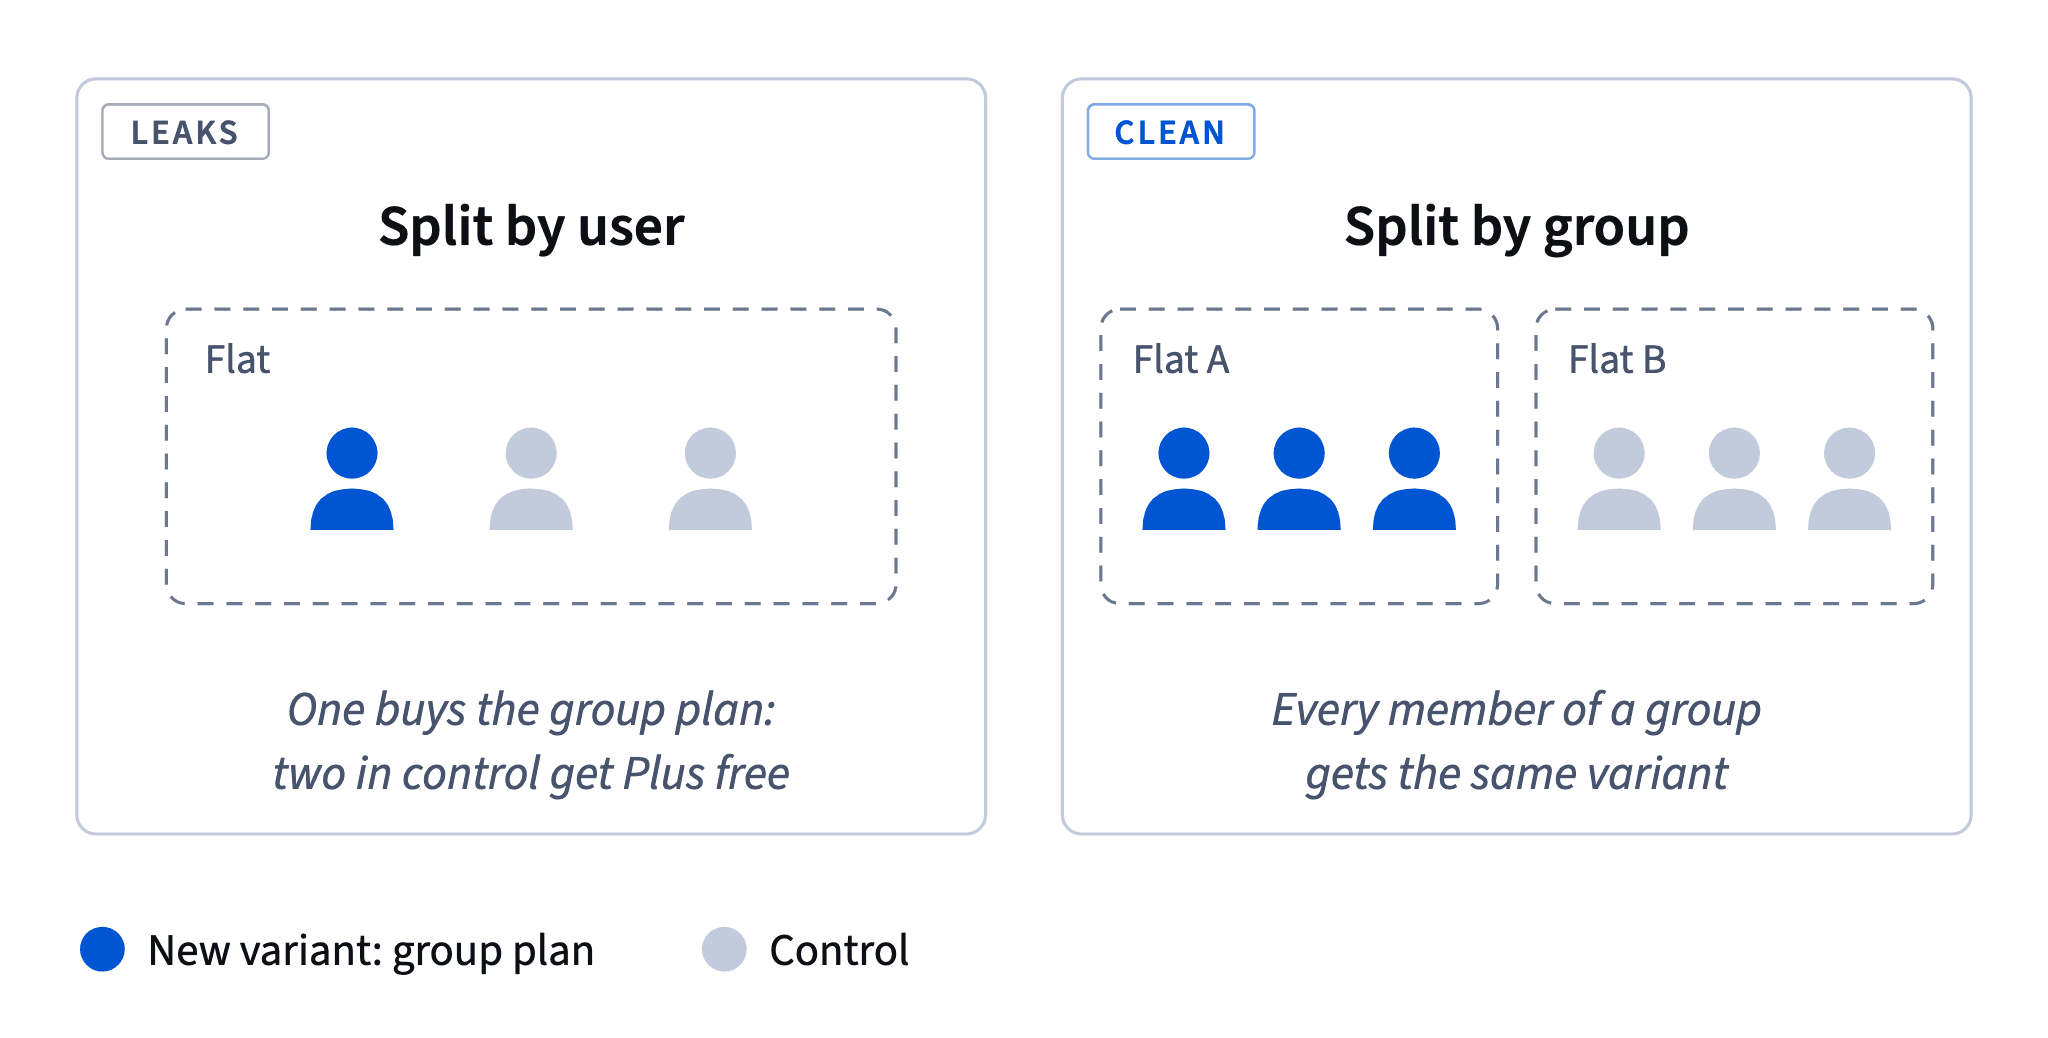
A quick test for whether you need it: is the change visible to, shared with, or bought for other members of the group? Group plans, group settle-up suggestions and shared spending charts all are, so randomize them by group. Dark mode or a personal settings icon stay with the user who sees them; user-level randomization is fine there.
- DoShared spending chart → randomize by group
- Don'tGroup plan split 50/50 by user
A buyer in treatment gives Plus to flatmates in control.
The design effect: what clusters cost
Randomizing whole groups protects the comparison, but it costs sample size. Members of one group behave alike: they travel together, pay rent together and often leave together. Three flatmates carry less independent information than three strangers.
The design effect (DE) tells you how many times more users a cluster-randomized test needs than a user-level one:
DE = 1 + (m − 1) × ICC
- m is the average group size in the test;
- ICC (intra-cluster correlation) measures how alike group members are on the metric, from 0 (as different as strangers) to 1 (identical). It's estimated from past data on the same metric.
For Halves flats: m = 3, ICC = 0.15, so DE = 1 + 2 × 0.15 = 1.3.
Multiply the user-level size by DE: 6,735 × 1.3 = 8,755.5 → 8,756 users per variant, or 8,756 ÷ 3 = 2,918.7 → 2,919 groups. The clusters cost 30% more users.
The formula is a planning approximation; it assumes groups of similar size. When sizes vary a lot, the cost is somewhat higher.
- DoDE = 1 + (3 − 1) × 0.15 = 1.3; 6,735 × 1.3 → 8,756 per variant
- Don'tDE = 1 + 3 × 0.15 = 1.45
Uses m instead of m − 1: each member adds to the first, not to zero.
Bigger groups, bigger design effect
The design effect grows with both inputs, and each one multiplies the other.
Formula: Design effect: multiply the users a user-level test would need by DE. · shown above
- Group size. At the same ICC of 0.15, groups of 3 give DE = 1.3, groups of 4 give 1 + 3 × 0.15 = 1.45, and groups of 6 give 1 + 5 × 0.15 = 1.75. Trip groups tend to be bigger than couples or flats, so a test randomized by trip group pays more.
- Similarity. At m = 3, an ICC of 0.05 gives DE = 1.1, while 0.30 gives 1.6. Metrics that groups decide together, like who pays for Plus or when the group stops using the app, tend to have a higher ICC than personal ones.
For groups of 4 with ICC 0.15: 6,735 × 1.45 = 9,765.75 → 9,766 users per variant, which is 9,766 ÷ 4 = 2,441.5 → 2,442 groups.
Two practical habits follow. Estimate ICC from past data on the same metric and the same kind of group you'll test, not from a guess. And when the design effect makes the test too long, look for a narrower trigger first: enrolling only groups that reach the paywall reduces the noise before the clusters multiply it.
- Dom = 4, ICC 0.15: DE 1.45 → 6,735 × 1.45 → 9,766 per variant
- Don'tReusing DE = 1.3 from flats for a test on trip groups
Bigger groups mean a bigger design effect.
Triggers at group level
When the coin is flipped per group, the trigger works per group too. The group-plan test enrolls a group at the first moment any of its members could see the difference: when any member first views the paywall. From then on the whole group is in, including members who never open the paywall themselves, because the plan reaches them anyway.
The same three rules as for a user-level trigger apply:
- it happens the same way in both variants (viewing the paywall doesn't depend on whether it offers a group plan);
- it comes before the change can act;
- it's logged in control too.
Two tempting alternatives break the test. Enrolling at purchase of the group plan picks only buyers, and only one variant can have them, so control has no matching group. Enrolling each member separately at their own first paywall view splits groups across time and analysis, which brings back exactly the leak cluster randomization was meant to stop.
So every test plan answers three questions before launch: who can be affected, when do they enter, and what unit gets the coin flip.
- DoGroup enters when any member first sees the paywall; the whole group is analyzed together
- Don'tGroup enters when someone buys the group plan
Only the new variant can produce that event.
Analyze at the unit you randomized
If the coin was flipped per group, the analysis must treat the group as the unit. The randomization unit and the analysis unit have to match.
The reason is the same similarity that created the design effect. 8,756 users in groups of 3 with ICC 0.15 carry about as much information as 8,756 ÷ 1.3 ≈ 6,735 independent users. A standard per-user interval pretends they are 8,756 independent people, so it comes out roughly √1.3 ≈ 1.14 times too narrow.
A too-narrow interval is overconfident: shaky effects look solid, and false wins become more likely than the 5% you planned for.
The correct options: compute the metric per group and compare groups, or use standard errors that account for clustering. The one wrong way is the default, treating each user as if randomized alone. Before reading a result, check that the analysis unit matches the plan's randomization unit.
How it fits together: decide who can be affected, enroll them when they reach the trigger, flip the coin for whatever shares the experience, and analyze at that same unit. Next, Case: reading a finished test.
- DoRandomized by group → interval computed with the group as the unit
- Don'tRandomized by group, analyzed with a plain per-user test on 8,756 users
The interval is about 1.14 times too narrow.
Ready to practise?
Answer the lesson's exercises and earn 250 points the first time you finish it.
Start the exercises