

Theory
Invites and viral growth
Viral growth from invites: the viral coefficient k, cycle time, why k below 1 still pays, and how to measure invites without flattering yourself.
~10 min read · 9 exercises · 250 points
Before you start
Are we viral?
Theo is preparing for investor questions about Halves. Every group needs members, so in a sense every user is a little salesperson, and investors will ask one thing: is Halves viral? He wants the answer from the data, which means from you.
In this lesson you'll measure viral growth honestly: the number of new users each user brings, how long one cycle takes, why growth from invites pays even when it doesn't snowball, and how not to flatter yourself.
The viral coefficient k, with a fixed window
The viral coefficient (k-factor) is the number of new users each user brings through invitations:
k = new users from invitations ÷ users in the cohort = (invitations ÷ user) × (new users ÷ invitation)
The second form shows the two parts you can work on: how many invitations people send, and how many of those turn into new users.
k needs a window. People keep inviting for months, so without one, older cohorts always look more viral simply because they've had longer. Fix it after sign-up and use the same window for every cohort. At Halves: invitations sent in a user's first 30 days, and invitees who sign up within that time.
January 2026 cohort: 4,646 users sent 5,737 invitations in 30 days (1.2348 per user); 1,460 of those became new users (0.2545 per invitation). k = 1,460 ÷ 4,646 = 0.3142, the same as 1.2348 × 0.2545.
Report k with its cohort and window: "0.31 within 30 days, January 2026 cohort", never as a bare number.
- Dok, January 2026 cohort, 30 days = 1,460 new users from invitations ÷ 4,646 users = 0.31.
- Don'tk = 1,460 ÷ 5,737 invitations = 0.25.
That is only the conversion of invitations, one factor of k.
Growth counts new people only
In a product built around groups, many accepted invitations go to people who already use it. At Halves, someone who already has the app and joins one more trip group accepts an invitation, but Halves doesn't gain a user.

So the numerator of k is new accounts created from invitations, not accepted invitations. January 2026: 1,947 accepts, of which 487 came from existing users, leaving 1,460 new users. k = 1,460 ÷ 4,646 = 0.31. Counting all accepts gives 0.42, a third too high, and the gap is similar in every month (0.39–0.44 against 0.29–0.33 for January–May).
Existing users joining more groups still matter: busier groups keep people coming back. That belongs in an engagement metric next to k (for example, groups joined per existing user), not inside it.
Before trusting any virality number, ask for its numerator in words: "new accounts that came from an invitation within 30 days". If the definition says "accepts", "invites" or "group joins", it's measuring activity, not growth.
- Dok = (1,947 accepts − 487 by existing users) ÷ 4,646 = 1,460 ÷ 4,646 = 0.31.
- Don'tk = 1,947 accepted invitations ÷ 4,646 users = 0.42.
Counts people who already had the app.
Two levers inside k
Because k = invitations per user × new users per invitation, a change in k always comes from one of two places, and they call for different fixes.
- Invitations per user depend on how often the product gives people a reason to invite: creating a group, adding an expense someone else must see, a reminder to settle up.
- New users per invitation depend on what happens to the invitee: the message they receive, the install and sign-up steps, whether they land straight in the group.
Halves, May 2026 against January: k fell from 0.3142 to 0.2931. Invitations per user barely moved (1.2348 → 1.2176), but new users per invitation dropped from 25.45% to 24.07% (1,755 ÷ 7,290). So the place to look is the invitee's path, not the inviting.
Split k every time it moves, the same way you'd split a funnel or ARPU. A single number can't tell the growth team which half of the loop to work on.
- DoMay: 7,290 ÷ 5,987 = 1.2176 invitations per user × 1,755 ÷ 7,290 = 24.07% = k 0.2931.
- Don'tMay invite conversion = 2,340 accepted ÷ 7,290 sent = 32.10%.
Accepts include 585 existing users; only new accounts count.
Below 1, k multiplies every channel
Each user brought in by any channel, a seed, invites k new users on average. They invite k² more, and so on. With k below 1 the generations shrink and the series adds up:
total = seed × (1 + k + k² + …) = seed ÷ (1 − k)
Halves, January–May 2026 pooled: k = 8,281 ÷ 26,638 = 0.3109, so the multiplier is 1 ÷ (1 − 0.3109) = 1.4511. In May, paid social and store search ads brought 2,169 users; with invites they turn into 2,169 × 1.4511 ≈ 3,147, about 978 more than the ad reports count. The cost per resulting user is roughly 31% lower than paid CAC alone suggests, if those invitees wouldn't have come anyway.
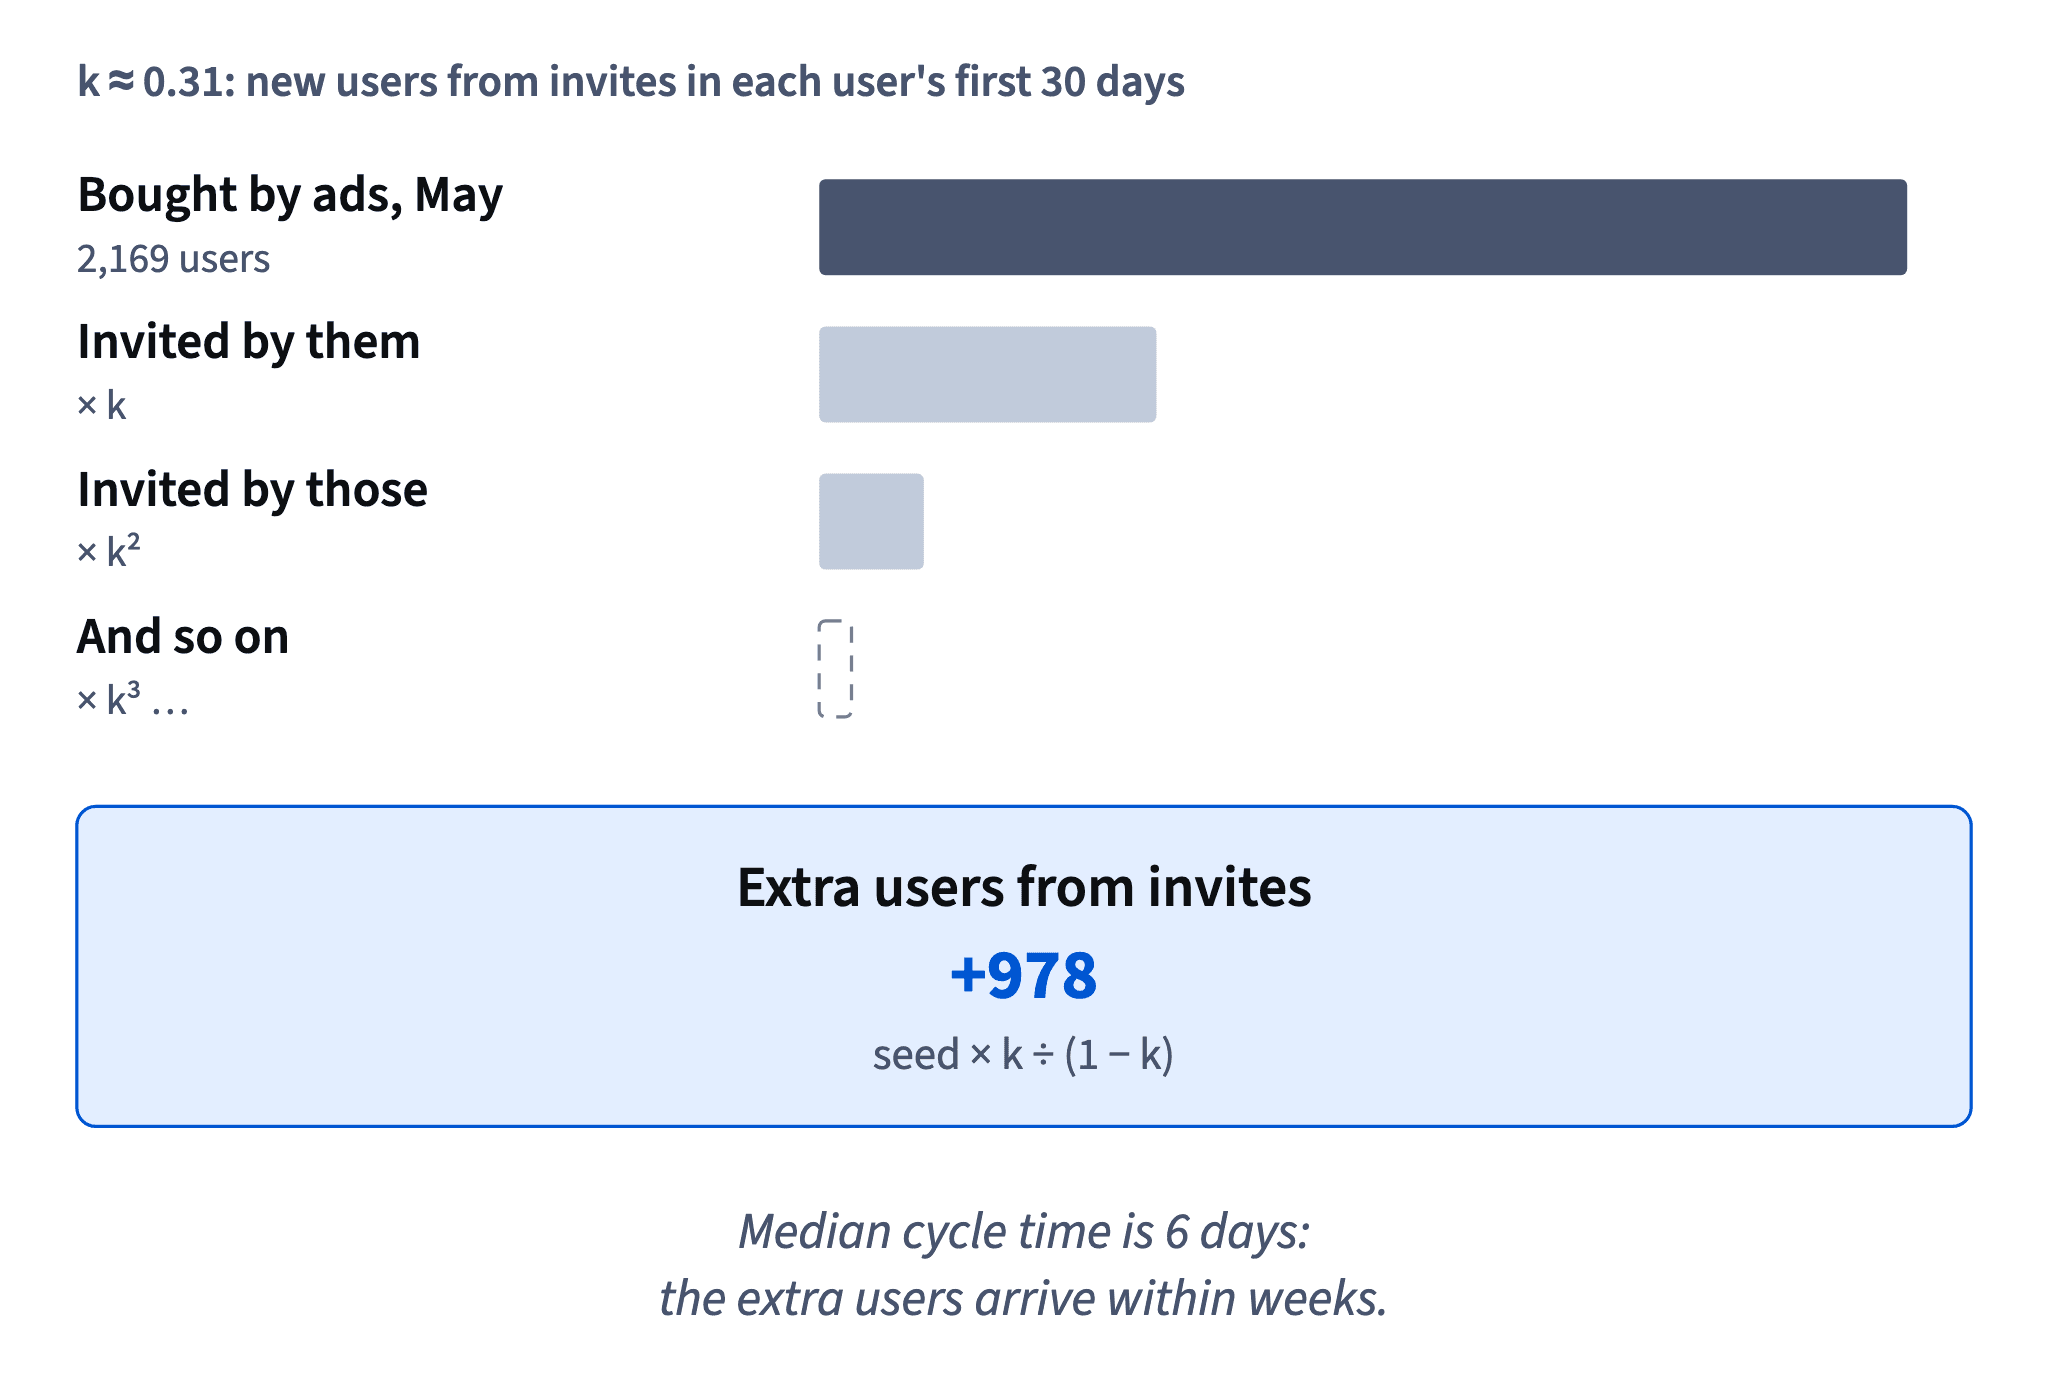
Two habits: pool several comparable cohorts for k, so one odd month doesn't drive the multiplier; and keep the season out (June's k of 0.55 would give a multiplier of 2.20).
Don't add k once (2,169 × 1.31 ≈ 2,843): that counts the first generation of invitees and forgets that they invite too.
- DoTotal = 2,169 ÷ (1 − 0.3109) = 2,169 × 1.4511 ≈ 3,147 users.
- Don'tTotal = 2,169 × (1 + 0.3109) ≈ 2,843 users.
Counts only the first generation of invitees.
Reading k below 1: a multiplier, not an engine
The threshold k = 1 separates two very different products.
- k above 1: each generation of invitees is bigger than the last, so invites alone can keep growth going: an engine. Very few products sustain this for long.
- k below 1: each generation is smaller and the chain dies out. Invites can't grow the product on their own, but they multiply every other channel by 1 ÷ (1 − k).

The mistake is to read "below 1" as "doesn't matter". At Halves, k = 0.31 means every user from ads, store search or the press brings about 0.45 more through invites. That lowers the effective cost of every paid user and makes cuts in other channels more expensive, because the missing users wouldn't invite anyone either.
The opposite mistake is to call a product "viral" because k is close to 1 in one season. Halves's June k of 0.55 is a trip-season effect.
Good sentence shape: "k = 0.31 (30 days, January–May cohorts): invites multiply our other channels by about 1.45, but don't drive growth on their own."
- Do“At k = 0.31, invites won’t grow us alone, but they add about 45% to every other channel.”
- Don't“k is only 0.31, so invites don’t really matter for growth.”
Ignores the 1.45× multiplier on every acquired user.
Viral cycle time: speed, not size
Viral cycle time is how long it takes from a user joining to the people they invite joining. At Halves the median is 6 days for January–May cohorts and 3 days in June, when trip groups form fast.
With k below 1, cycle time changes when the extra users arrive, not how many. The total from a seed is seed ÷ (1 − k), and the formula has no time in it: May's 2,169 paid users turn into about 3,147 whether invitees join in 3 days or in 30. A shorter cycle still matters: the extra users arrive within weeks, so a forecast or a cash plan sees them sooner, and the paid spend comes back faster.
Formula: Valid for k below 1. · shown above
With k above 1 the picture changes: the chain never ends, and a shorter cycle makes growth compound much faster, because the generations follow each other more quickly.
So report the two numbers together. k says how much the loop adds; cycle time says how fast. And measure cycle time as a median (the middle value once times are sorted), because a few invitees who join months later would drag an average far out.
- Do“k = 0.31, median cycle 6 days: May’s 2,169 paid users bring about 978 more within weeks.”
- Don't“Halving the cycle to 3 days will double what invites add.”
Below 1, the total is seed ÷ (1 − k), with no time in it.
Five rules for an honest k
A k that holds up next quarter follows a few rules:
- A fixed window after sign-up, the same for every cohort (30 days at Halves).
- Only new accounts in the numerator; existing users joining groups go into an engagement metric.
- By cohort and season. Halves's January–May cohorts give 0.29–0.33; June gives 0.55 because trip groups pull in friends within days. Quoting the best month promises growth the rest of the year won't deliver.
- Pooled for planning. For a multiplier, pool comparable cohorts (0.3109 for January–May) instead of picking one.
- Incrementality checked. Some invitees would have installed anyway, from the store or a friend's recommendation. Only a holdout shows how many: hide the invite prompt for a small random share of new groups, say 5%, and compare how many new users join through them.
The first four rules make k comparable; the fifth makes it true. Until a holdout has run, say so: "k as measured; the share that would have come anyway is not yet known."
- Do“k = 0.31 (30 days, January–May 2026 cohorts, new accounts only); holdout planned.”
- Don't“Our k is 0.55.”
June’s trip season quoted as the year.
Reading a holdout: incremental k
A holdout group, as Case: the version or the traffic? defines it, is a random slice kept without the feature; for invites, a small share of new groups never see the invite prompt. Their friends can still find Halves on their own, so the difference between the arms is what invites truly add:

incremental k = new users per user with the prompt − new users per user without it
In a made-up example, groups with the prompt bring 0.31 new users per member within 30 days and holdout groups 0.12. Then 0.12 would have come anyway and the prompt adds 0.19: the planning multiplier is 1 ÷ (1 − 0.19) ≈ 1.23, not 1.45.
Read it like any test: a difference with an interval, randomized by group (the cluster unit from Who is in the test: triggers and cluster randomization), and enough groups to see an effect that matters.
How it fits together: k = invitations × conversion, measured in a fixed window on new accounts, read as a multiplier with its cycle time and corrected by a holdout. Next, Channels and marketing attribution.
- Do“Incremental k = 0.31 − 0.12 = 0.19; plan with a multiplier of about 1.23.”
- Don't“The holdout groups still got 0.12, so k is really 0.12.”
0.12 is what comes without invites; the invite effect is the difference.
Ready to practise?
Answer the lesson's exercises and earn 250 points the first time you finish it.
Start the exercises