

Theory
Traffic mix and seasonality
What seasonality and a changing traffic mix do to product metrics, and how to compare like with like.
~10 min read · 9 exercises · 250 points
Before you start
Another release, another drop
Another release, another drop at Halves, this time at the start of summer. A new version went out in early July, week-2 retention of new users slid, and the team wants the old home screen back. Maya wants your data first.
In this lesson you'll check what else changed in July: the season and the mix of channels and group types inside the metric, and how to compare like with like before blaming the screen.
Same metric, different crowd
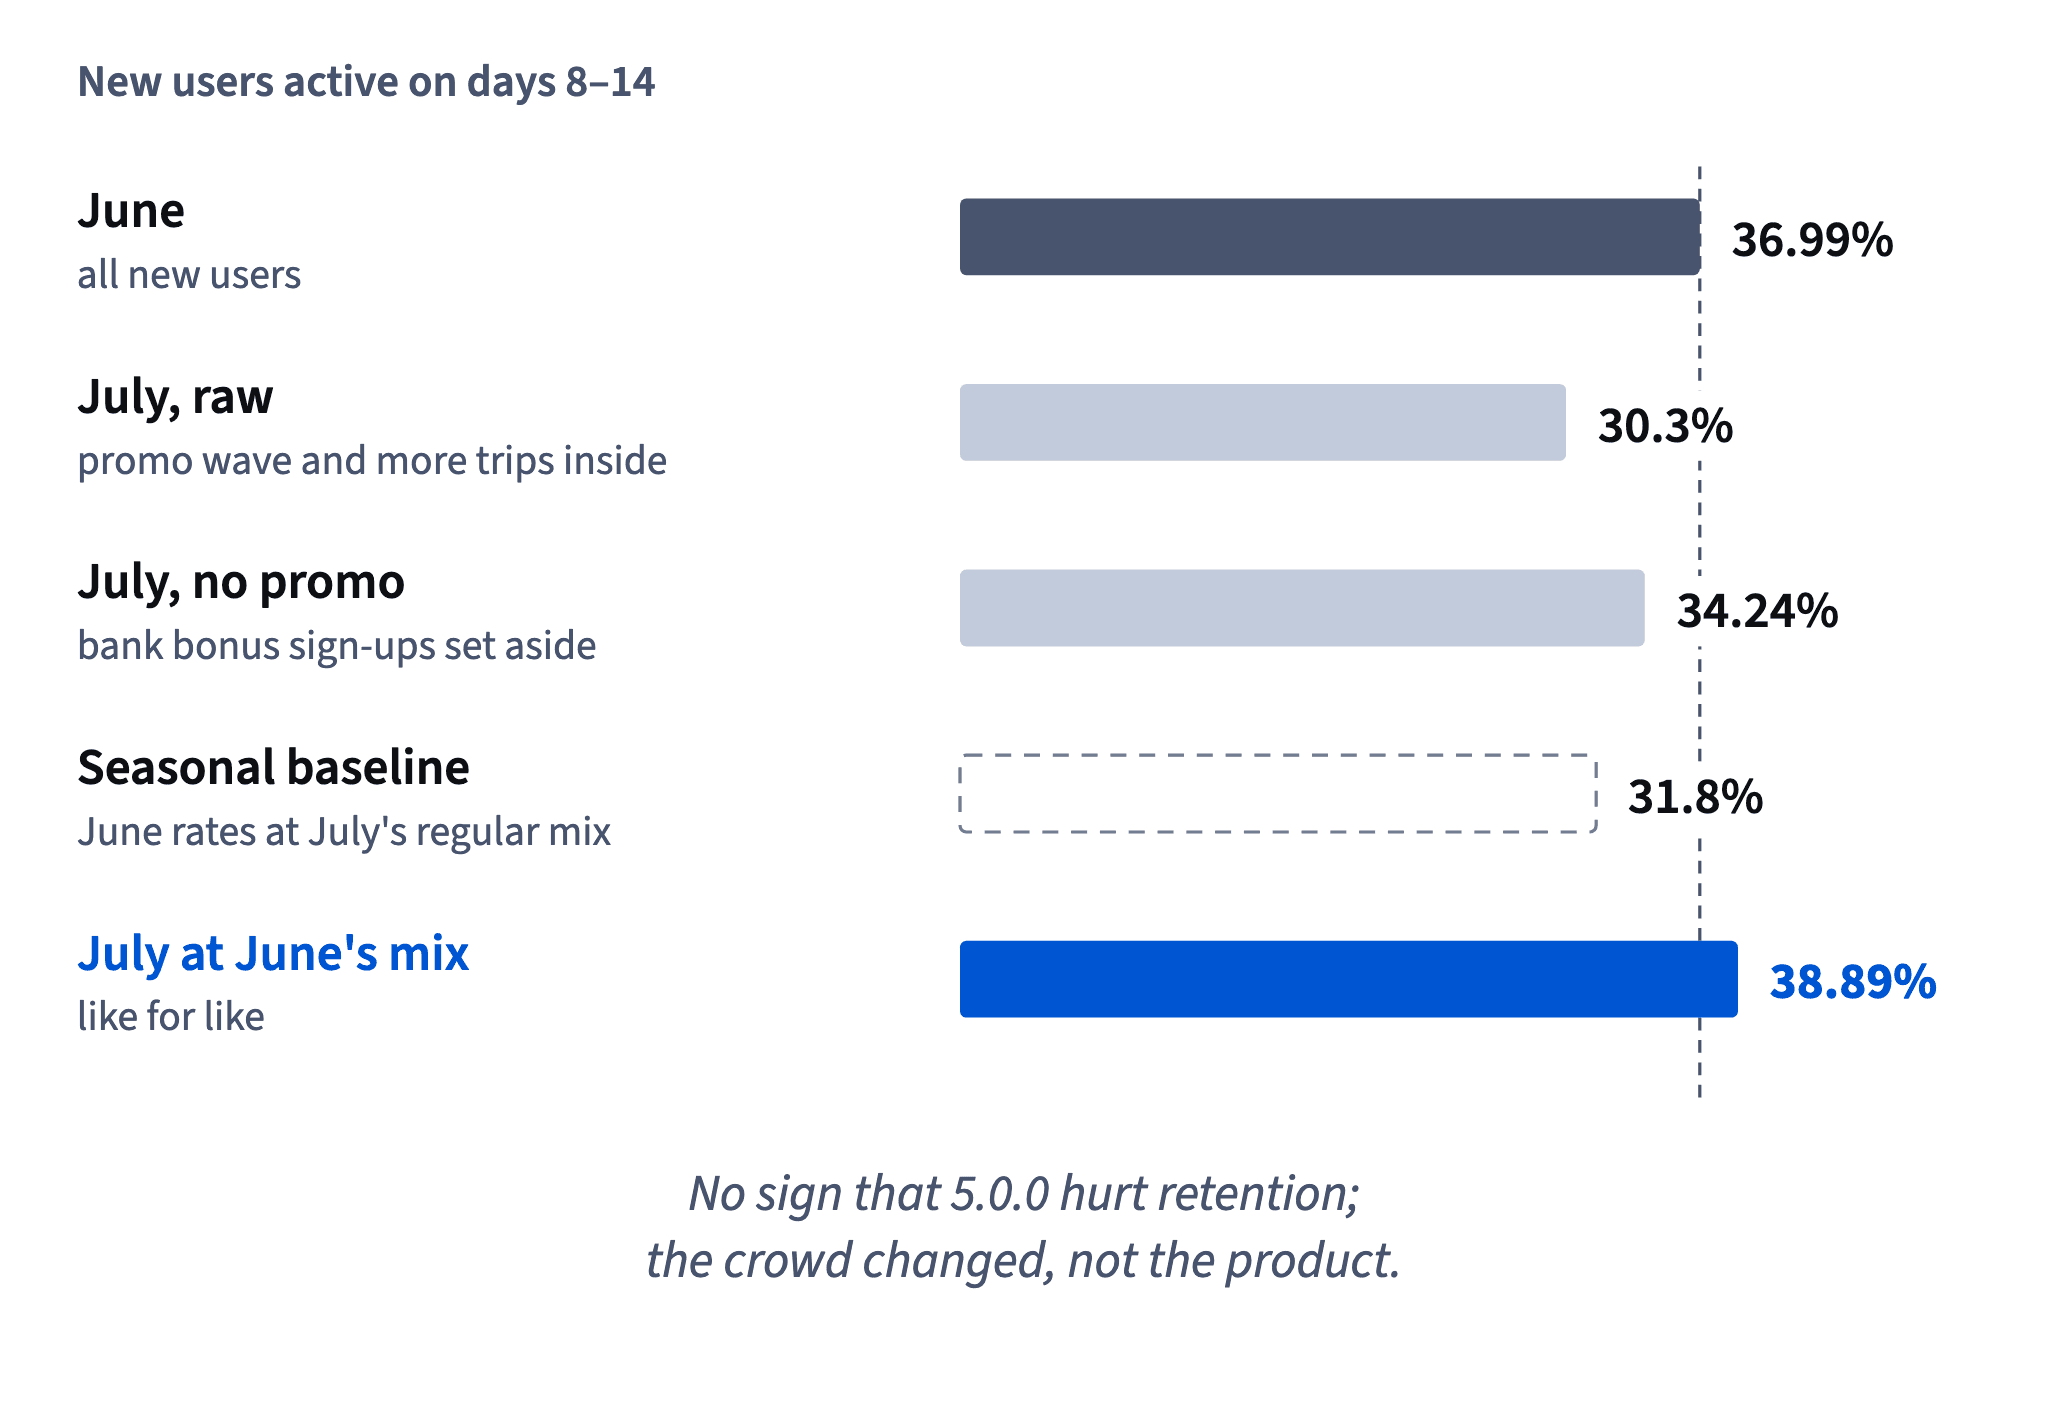
In a before/after comparison, the first thing to rule out is a change in who arrived. Halves' week-2 retention of new users fell from 37.0% in June to 30.3% in July, right after version 5.0.0. The metric itself is identical in both months (new users, days 8–14, every cohort complete), so what could have changed is the crowd inside it.
That's the traffic mix: the shares of new users by channel and by the type of group they joined first. Segments retain very differently. In June, flats kept 43.25% on days 8–14, couples 40.29% and trips only 16.46%, because a trip group ends when the holiday does.
So look at the shares before the totals. Trips were 407 of 2,033 June sign-ups, 20.02%. In July they were 1,095 of 2,952, 37.09%: almost double.

This is a mix shift, the effect Volume, quality and Simpson's paradox describes: the total moves while no segment changes. Here a low-retention segment grew, so the average can fall even if every segment behaves as before. Check it whenever a metric jumps together with a season, a campaign or a new channel.
- DoTrips: 20.02% of June sign-ups → 37.09% of July sign-ups
- Don't"Retention fell 6.7 points after 5.0.0, so the release broke it."
Reads the total without checking who arrived.
A promo wave has no counterpart
For two weeks from 13 July a bank paid its student-card holders $5 for signing up to Halves and creating a group. Those users arrived as partner_promo: 393 in the week of 13 July and 395 in the week of 20 July, 788 in all. Against 2,952 July sign-ups that's 788 ÷ 2,952 = 26.69%, more than a quarter of the month.
These are incentivized sign-ups: people who joined for the reward. Some really had rent to split; many made a group only to meet the condition. Only 153 of the 788 were active on days 8–14, which is 19.42%, below every regular June channel (29–41%).
June had no such channel, so these users have nothing to be compared with. The first step of a like-for-like comparison is therefore to set them aside: July without the promo rows is 741 ÷ 2,164 = 34.24%, against June's 36.99%.
Dataset · 78 rows
Weekly sign-up cohorts, June and July
New Halves users, weeks of 8 June to 27 July 2026. Version 5.0.0 was released on 6 July. Every cohort has its full days 8–14.
First 5 of 78 rows
Setting them aside isn't hiding them. The promo is reported on its own line, judged by its own question (how many users did the money buy who are still here?), and kept out of the comparison it would only distort.
- DoJuly without
partner_promo: 741 ÷ 2,164 = 34.24%; promo on its own line (19.42%) - Don'tComparing June with all of July, promo included
A quarter of July comes from a channel June never had.
Compare inside each segment
Without the promo, July is 34.24% against June's 36.99%: still lower. The remaining gap comes from the extra trips, so the next step is to compare inside each group type: flats with flats, couples with couples, trips with trips.

For July flats (regular channels only): users 348 + 249 + 179 = 776, active 177 + 104 + 62 = 343, so 343 ÷ 776 = 44.20%. June flats: 436 ÷ 1,008 = 43.25%. The other segments move the same way: couples 40.29% → 43.68%, trips 16.46% → 19.63%.
Dataset: Weekly sign-up cohorts, June and July · shown above
Every segment is slightly higher in July, while the total is lower. That pattern, segments up and total down, is the signature of a mix shift. It's the same effect as in a cohort table where dropping a weak cohort makes an average rise; here adding a weak segment makes it fall.
Two cautions. Segment rates rest on fewer users (July couples are 522 people), so small differences are within noise; read them as "no segment got worse" rather than as precise gains. And choose segments that plausibly drive the metric, such as group type and channel, rather than slicing until something looks interesting.
- DoFlats: June 436 ÷ 1,008 = 43.25% vs July 343 ÷ 776 = 44.20%
- Don'tJuly flats including the 402 promo flats: 443 ÷ 1,178 = 37.61%
Puts the promo wave back into the segment.
A seasonal baseline: what the mix alone predicts
A seasonal baseline is the total you'd expect if every segment kept its old rate and only the mix changed. It puts a number on how much the season should move the metric by itself.
June rates by group type: flats 43.25%, couples 40.29%, trips 16.46%. July's regular sign-ups (promo aside) were 35.9% flats, 24.1% couples and 40.0% trips. So:
Expected July = 0.359 × 43.25 + 0.241 × 40.29 + 0.400 × 16.46 = 15.53 + 9.71 + 6.58 ≈ 31.8%
The mix alone would pull June's 37.0% down by about five points. July's regular users actually reached 34.24%, above that baseline. So the July dip is more than explained by the season, with room to spare.
This is the mirror image of the mix-adjusted rate (July's segment rates weighted by June's mix). One keeps the old rates and swaps in the new mix ("what the season predicts"); the other keeps the old mix and swaps in the new rates ("what July would be at June's traffic"). Both ask how much of the change is mix.
- Do0.359 × 43.25 + 0.241 × 40.29 + 0.400 × 16.46 ≈ 31.8%
- Don't(43.25 + 40.29 + 16.46) ÷ 3 = 33.3%
Ignores the mix entirely, which is the whole point.
Seasonality: compare with the same weeks last year
Seasonality is a pattern that repeats with the calendar. For Halves, summer brings trip groups, and trip groups go quiet once the holiday ends. So a July dip in week-2 retention is likely to come back every year, release or no release.

That changes which comparison makes sense. June against July mixes the release with the season. Three better options, from simplest to strongest:
- The same weeks a year earlier. July 2026 against July 2025 shares the season; what's left is the year's changes, the release among them.
- Hold the mix fixed. Re-weight to a reference mix, or compute a seasonal baseline, so the shift toward trips is taken out.
- Read each segment on its own. Flats against flats is far less seasonal than the total.
Year-on-year has its own traps: last July may have had a different promo, a different product, or a different number of weeks with holidays in them. So it's a better comparison, not a perfect one.
The rule that never changes: don't read two adjacent months raw when one of them is a season.
- DoJuly 2026 vs July 2025, same weeks, read by group type
- Don'tJune 2026 vs July 2026, total only
The season changes between the two months, so it hides inside the difference.
Judging a promo by the users who stay
A sign-up bonus is easy to make look good: 788 new users in two weeks, more than a quarter of July. But the useful question is how many users who still use Halves the money bought.
Of the 788 promo users, 153 were active on days 8–14: 19.42%. Compare that with what the same budget would buy elsewhere, in retained users rather than sign-ups, and the deal may look very different.
Three habits make the next promo easy to read:
- Tag it from day one. Give the offer its own sign-up code, so every bonus user carries
partner_promoin the data. Without the tag, promo users blend into the regular channels and quietly drag them down. - Judge it by retained users (active in week 2, or later), and by cost per retained user if you have the spend.
- Don't overlap it with a release. A promo and a release that start in the same fortnight are hard to separate afterwards; agree the dates with the product team.
None of this says the promo was bad; some of those 153 may become regular users. It says what the deal should be measured by.
- Do"Bank promo: 788 sign-ups, 153 active in week 2 (19.4%)."
- Don't"Bank promo: 788 new users, 27% of July. Let's double it."
Counts sign-ups, not users who stayed.
A mix-adjusted rate: fairer, not causal
A mix-adjusted rate makes a before/after fairer, but it removes only the differences you split by. The rate itself comes from Volume, quality and Simpson's paradox: each cell's July rate, weighted by that cell's share of June. Here the cells are channel × first group type, the promo rows are set aside first (June has no such cells), and July comes to 38.89% against June's 36.99%.
The bigger share of trips is handled, because trips get June's weight. The promo wave is handled, because it was set aside. Everything that isn't a column in the table stays inside the number:
- school holidays and summer weather;
- a competitor's campaign or anything else in the market;
- plain chance: each July cell holds only about 120–380 users.
So a mix-adjusted rate is a fairer comparison, not a causal one. It can show that the change in who arrived explains a drop. It can't turn a before/after comparison into a measured effect of the release.
- Do"At June's mix, July is 38.89% vs 36.99%: the drop is explained by the mix."
- Don't"Adjusted for mix, 5.0.0 raised retention by 1.9 points."
Holidays, weather and chance are still inside the number.
Ruling out harm isn't proving a gain
A before/after comparison is often strong enough to reject a claim and too weak to establish one. Here, without the promo, every group type is slightly higher in July, and at June's mix July comes to 38.89% against 36.99%. Raw, July looked 6.7 points worse; like for like, about 1.9 points better.
Match the claim to the evidence:
- Supported: the July drop is explained by who signed up (more trips, the promo wave); like for like, nothing points to harm from 5.0.0. No rollback on this evidence.
- Not supported: "5.0.0 added 1.9 points". Holidays, heat and chance are still inside the number.
- Also wrong: "without an A/B test, the table says nothing". It can't prove a cause, but it can rule one out: that the new screen caused the drop.
How it fits together: set aside what has no counterpart, compare inside segments, hold the mix still, check the season; then a before/after can reject a story, rarely prove one. Next, Selection bias: users who do X retain better: when users pick their own group.
- Do"July's drop comes from who signed up; like for like, nothing points to harm from 5.0.0."
- Don't"The new home screen added 1.9 points of retention."
A causal claim the adjustment can't carry.
Ready to practise?
Answer the lesson's exercises and earn 250 points the first time you finish it.
Start the exercises