

Theory
How big and how long
Sample size and duration for a product test.
~11 min read · 10 exercises · 250 points
Before you start
“A week should do it”
The paywall test at Halves has a signed plan, and Maya suggests running it for a week and reading it next Monday. A week might be enough, or it might be a coin toss, and she wants your view before launch.
In this lesson you'll learn that a test's length isn't picked but computed: from the baseline, the smallest effect worth finding, the error risks you accept and how much traffic enters the test each week.
Four inputs that fix the size of a test
How long a test runs isn't a matter of taste. It's computed from four inputs, plus one fact about traffic.
- Baseline: how often the primary metric happens today, in the population that will enter the test. For the paywall: 4.0% of first-time paywall viewers pay within 14 days.
- MDE (minimum detectable effect): the smallest change worth finding, usually the smallest effect worth shipping. Here +1 pp, from 4% to 5%.
- Significance level α: the risk of declaring a win when the change does nothing. 5%, two-sided.
- Power: the chance of detecting the MDE if it's real. 80% is the usual minimum, which still means a 1-in-5 chance of missing a real +1 pp.
Baseline and MDE describe the product and the business. α and power describe how much risk of each kind of mistake you accept: a false win, or a missed real effect. Together they fix the number of users per variant.

The traffic fact then turns users into time: how many eligible users enter the test each week.
- DoBaseline 4.0%, MDE +1 pp, α 5% two-sided, power 80%
- Don't"Let's run it for a week and see."
A duration picked before any of the four inputs.
Users per variant for a conversion metric
For a metric that is a share of users (paid or didn't), a standard two-proportion formula gives the users needed in each variant:
n = (z₁ + z₂)² × [p₁(1 − p₁) + p₂(1 − p₂)] ÷ (p₂ − p₁)²
- p₁ is the baseline, p₂ = p₁ + MDE;
- z₁ = 1.96 for α = 5% two-sided, z₂ = 0.84 for 80% power, so (1.96 + 0.84)² = 7.84.
For the paywall: p₁ = 0.04, p₂ = 0.05.
- p₁(1 − p₁) = 0.04 × 0.96 = 0.0384; p₂(1 − p₂) = 0.05 × 0.95 = 0.0475; sum 0.0859;
- (p₂ − p₁)² = 0.01² = 0.0001;
- n = 7.84 × 0.0859 ÷ 0.0001 = 6,734.56 → 6,735 per variant, 13,470 in total.
Always round up: 6,734 users would leave you a little short of 80% power. Calculators use slightly different versions of this formula, so answers a few users apart are the same answer.
The most common slip is mixing units: the MDE must be entered as a proportion (0.01), not as "1".
- Do7.84 × 0.0859 ÷ 0.0001 = 6,734.56 → 6,735 per variant
- Don'tReporting 6,735 as the total for both variants
The formula is per variant; the test needs 13,470.
From users to calendar weeks
The size tells you how many users you need; the calendar comes from three more steps.
- Divide by eligible traffic. Only users who see the paywall for the first time enter the test: about 3,400 a week across both variants. 13,470 ÷ 3,400 = 3.96 weeks.
- Round up to whole weeks. Halves has a weekly rhythm: rent is split at weekends, trips start on Fridays. A test that stops mid-week over-represents some days, so 3.96 becomes 4 weeks of enrollment.
- Add the metric's window. The primary metric is "paid within 14 days". The last user who enters at the end of week 4 needs 14 more days before their outcome is known. 4 + 2 = 6 weeks from launch to readout.

Step 3 is the one most often forgotten. Reading the test at the end of week 4 would count the last fortnight's users before most of them could possibly pay, which drags both variants down and blurs the difference.
Write the readout date into the plan when the test starts, so nobody is tempted to read it sooner.
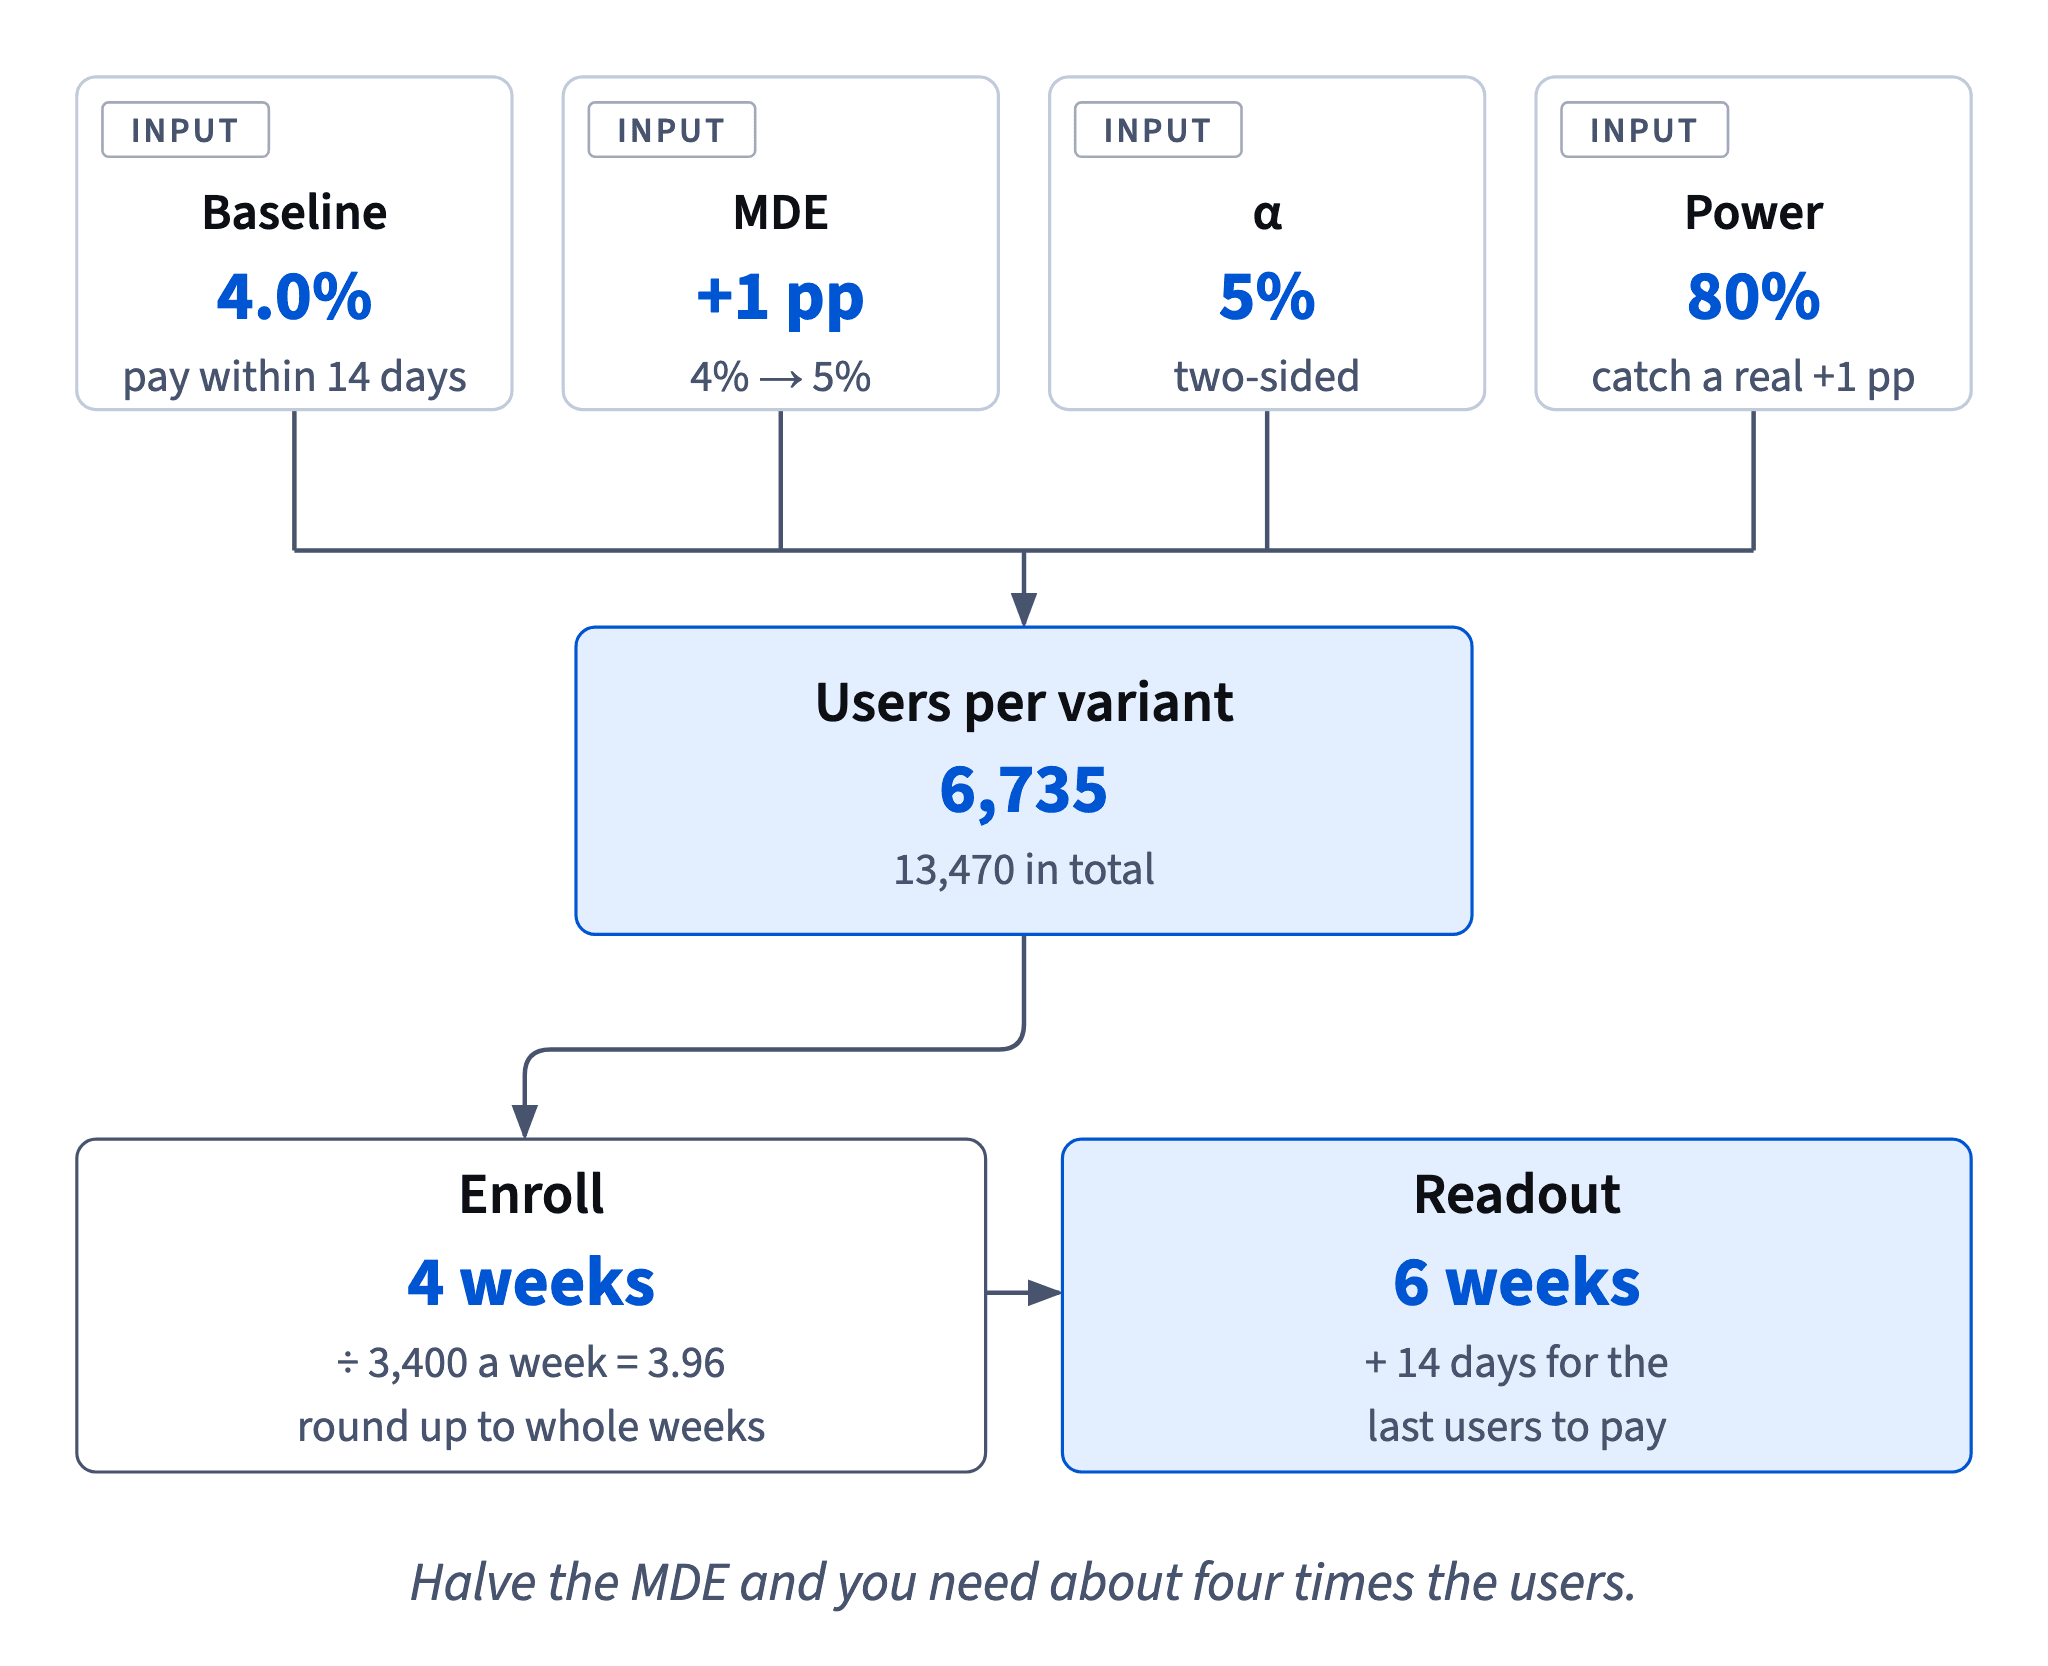
- Do3.96 → 4 weeks enrollment + 2 weeks window = 6 weeks
- Don'tReading the result on day 28, when enrollment ends
The last users haven't had their 14 days to pay.
Traffic sets the calendar
The users-per-variant number depends only on the four inputs. How long it takes to collect them depends on eligible traffic, which changes with the season, the marketing budget and who counts as eligible.
If the paywall gets 2,000 first-time viewers a week instead of 3,400, the same 13,470 users take 13,470 ÷ 2,000 = 6.7 weeks. Rounded up to whole weeks that's 7, plus the 2-week window: 9 weeks to readout.
Three ways teams get this wrong:
- Counting all traffic instead of eligible traffic. Only first-time paywall viewers enter the test; daily active users or total sign-ups overstate the inflow.
- Assuming traffic stays constant. A test planned in a busy month and run in a quiet one will fall short; check the forecast for the actual weeks.
- Stopping at the planned date regardless of the count. The plan fixes a number of users, and the date is only its estimate. If enrollment runs slow, extend to the next whole week; don't read early.
If the calendar is too long, change the inputs (a bolder change with a larger MDE, or more eligible traffic), not the reading.
- Do13,470 ÷ 2,000 = 6.7 → 7 weeks + 2 = 9 weeks
- Don't"Halves has tens of thousands of weekly users, so we'll fill the test in days."
Only first-time paywall viewers are eligible.
Halve the effect, quadruple the users
The MDE sits squared in the denominator of the size formula. That makes it by far the most powerful input: halving the effect you want to detect needs roughly four times the users, not twice.

Formula: Users per variant for comparing two conversion rates: p₁ is the baseline, p₂ = p₁ + MDE. Round up. · shown above
For 4.0% → 4.5% (MDE +0.5 pp):
- 0.04 × 0.96 = 0.0384; 0.045 × 0.955 = 0.042975; sum 0.081375;
- (0.005)² = 0.000025;
- n = 7.84 × 0.081375 ÷ 0.000025 = 25,519.2 → 25,520 per variant.
That's 3.8 times the 6,735 needed for +1 pp. It's slightly under 4 because the variance term shrinks a little when p₂ is closer to the baseline. In calendar terms: 51,040 users ÷ 3,400 a week = 15.0 → 16 whole weeks of enrollment if you round up, before the 14-day window.
The lesson for planning: small effects are expensive. When the effect you care about is too small for your traffic to detect in a sensible time, the useful move is to test a bolder change that could plausibly produce a bigger effect, not to run a tiny tweak for a season.
- DoMDE +0.5 pp: 7.84 × 0.081375 ÷ 0.000025 → 25,520 per variant
- Don't"Half the effect, so 2 × 6,735 = 13,470 per variant."
The effect is squared: about 4×, not 2×.
What moves the required size
Each input pulls the required users in a predictable direction. For the paywall test (6,735 per variant at baseline 4%, MDE +1 pp, α 5%, power 80%):
- More power (90% instead of 80%): z₂ rises from 0.84 to 1.28, so n grows to about 9,030 per variant.
- Stricter α (1% instead of 5%): z₁ rises from 1.96 to 2.58, so n grows to about 10,030.
- Uneven split (90/10 instead of 50/50): the small variant becomes the bottleneck. For the same power the total grows to nearly three times the 50/50 total.
- Larger MDE (+1.5 pp instead of +1 pp): n falls to about 3,150, because the effect is squared in the denominator.
- Higher baseline for the same absolute MDE: more variance, so more users. At 8% the same +1 pp needs 12,192 per variant.
So there is one honest way to need fewer users from the statistics side, a bigger MDE, and it isn't free: you must believe the change can move the metric that much. Lowering power instead just means accepting a bigger chance of missing a real effect.
- DoMDE +1.5 pp → about 3,150 per variant instead of 6,735
- Don't"Send only 10% to the new paywall to keep risk low; it'll be just as fast."
The small arm needs the same users, so the test takes far longer.
Choosing the MDE: worth shipping and findable
The MDE is a business decision with a statistical price tag. Two questions set it:
- What's worth shipping? The smallest effect that would pay for the change, its maintenance and its risks. For the paywall the plan says +1 pp.
- What can the traffic find? The effect you can detect within an acceptable calendar.
The second question is where the squared effect bites. At a 4% baseline:
- +0.5 pp needs 25,520 per variant, about 16 weeks of enrollment;
- +1 pp needs 6,735 per variant, 4 weeks;
- +1.5 pp needs 7.84 × (0.0384 + 0.055 × 0.945) ÷ 0.015² = 7.84 × 0.090375 ÷ 0.000225 = 3,149.07 → 3,150 per variant, 6,300 in total, so 2 weeks of enrollment.
A bigger MDE is only honest if the change could plausibly produce it. Sizing for +1.5 pp and then running a tiny copy tweak just makes a test that will probably miss the real, smaller effect and report "not significant".
If the effect worth shipping is smaller than anything the traffic can find, the answer is a bolder change, or a decision made without a test and stated as such.
- Do+1.5 pp: 7.84 × 0.090375 ÷ 0.000225 → 3,150 per variant
- Don'tSizing for +1.5 pp to finish fast, then testing a button color
The MDE must be an effect the change could plausibly produce.
Read once, at the planned size
A test is read once, at the size and date fixed in the plan. Checking it again and again and stopping on a good day is called peeking, and it breaks the test's error rate.
The 5% false-win rate holds for a single reading. While users arrive, a noisy metric wanders up and down. Look every morning and stop the first time it crosses the line, and chance gets a fresh try each day: the real false-win risk becomes several times higher than 5%. The day it first crosses is also usually a high point, so the effect you report is overstated.
Length has its own rule: run whole weeks covering at least one full usage cycle, plus the metric's window. Weekdays and weekends behave differently, and the first days of a change can mislead either way: people click something new out of curiosity, or stumble while they learn it.
If stopping early for clear harm or a huge win is truly needed, use a sequential design with stricter thresholds, planned before launch. An early stop improvised on a good day isn't one.
- DoReadout after 4 full weeks of enrollment plus the 14-day window; nobody reads the primary before then
- Don't"Looks good on day 9, let's stop and ship."
Day 9 is one of many looks; a noisy metric crosses the line now and then by chance.
A short test can't say "no effect"
One week of paywall traffic gives about 1,700 users per variant. That sounds like a lot of people, but power is about evidence, not headcount.
With 1,700 per variant, the standard error of the difference is √(0.0859 ÷ 1,700) ≈ 0.0071, or 0.71 pp. A real +1 pp effect is only about 1.4 standard errors from zero, short of the 1.96 needed for significance most of the time. The chance of detecting it, the power, is about 29%: in seven out of ten such tests, a paywall that really works would come out "not significant".
So an underpowered result can't be read as "the paywall doesn't work". Its interval, roughly ±1.4 pp around the estimate, would include both zero and the effect you care about: inconclusive, by the decision rule. Stopping early on a great first week is no fix either; that's the peeking trap: checking again and again and stopping on a good day.
How it fits together: the four inputs fix the users, eligible traffic and the metric's window fix the calendar, the MDE is the costly lever, and the result is read once, at that size. Next, Who is in the test: triggers and cluster randomization.
- Do"1,700 per variant gives ~29% power for +1 pp; a null result would tell us almost nothing."
- Don't"After a week it's not significant, so the trial-first paywall doesn't help."
With 29% power, a real +1 pp is missed most of the time.
Ready to practise?
Answer the lesson's exercises and earn 250 points the first time you finish it.
Start the exercises