

Theory
A/B test plan: hypothesis, metrics, guardrails
Write the A/B test plan before launch: a hypothesis, one primary metric, guardrail metrics and a decision rule.
~10 min read · 9 exercises · 250 points
Before you start
Did the change work?
You're on the product team at Halves, a bill-splitting app for flatmates, couples and trips, with a paid plan, Halves Plus. Every release comes with a claim that it helped, and a chart after launch can't separate the change from the season or the traffic. This module answers one business question, whether a change worked, with a randomized test: how to plan it, how big and how long it must be, who belongs in it, and how to read the finished result. This first lesson writes the plan: a hypothesis, the metrics and the decision rule, all fixed before launch.
Why the plan comes before the data
An A/B test compares a control group (the current version) with a treatment group (the change), with users assigned at random. The randomization makes the comparison fair. What it can't protect against is the team's own choices after the numbers arrive.
Watch twenty metrics and, by chance alone, a few will move. If the team decides afterwards which one counts, someone will always find a winner: trials for the growth marketer, revenue for the CFO, a lucky country split for the PM. The test then confirms whatever each person hoped.

So the A/B test plan is written, dated and agreed before the first user sees the change. It fixes four things on one page:
- a hypothesis that could turn out wrong;
- one primary metric the decision hangs on;
- guardrail metrics with the harm you won't accept;
- a decision rule saying what each possible result leads to.
The plan doesn't change how users behave, and it doesn't replace reading the result as an effect with its interval. It only removes the choices you'd otherwise make after seeing the data.
- DoPlan dated Friday; test starts Monday; result read once at the planned size
- Don't"Let's launch, put everything on one dashboard and see what moves."
Guarantees a lucky "winner" among many metrics.
A hypothesis that could lose
A useful A/B test hypothesis has four parts:
- the change: the paywall leads with a 7-day free trial;
- who it affects: users who reach the paywall;
- what should move, with a window: the share who pay within 14 days;
- why: trying Plus first makes paying feel less risky.
The window matters. With a 7-day trial the first charge comes on day 8 at the earliest, so 14 days leaves room for it and gives every user the same time to convert, whether they entered the test on Monday or Sunday.
The test of a hypothesis is simple: could the data prove it wrong? "Users will like the new paywall more" or "the experience will improve" can't be measured as stated, so no result can contradict them. "Better on every metric" is measurable but invites fishing: one of many metrics will move.
A good hypothesis names a number that could come out flat or worse. The why is useful too: if the primary metric doesn't move, the reason tells you what to try next.
- Do"Leading with a 7-day trial raises the share of paywall viewers who pay within 14 days, because trying first lowers the risk."
- Don't"Users will understand the value of Halves Plus better."
No metric, no window: nothing could prove it wrong.
Four roles a metric can play
A test plan gives every number a role, and only one role decides.
- Primary metric: the one number the decision hangs on. For the paywall: the share of test users who pay within 14 days of their first paywall view. It should be the outcome you actually want, not a step on the way to it.
- Guardrail metric: a number you don't try to improve, only protect, with a margin of acceptable harm. Here: the share who still add an expense in days 8–14.
- Secondary metric: read to explain why the primary moved. Trials started belong here. A paywall can double trials and still leave fewer payers if most trials lapse, so trials can't be the goal.
- Exploratory cuts: splits by country, platform or channel. The test wasn't sized for them, and every extra cut is another chance to find a lucky difference, so they produce ideas for the next test, not decisions.
The usual temptation is to promote a fast-moving secondary metric to primary because it shows a result in days. That's choosing a metric for speed rather than for what the business needs.
- DoPrimary: paid within 14 days. Secondary: trials started. Guardrail: expense added in days 8–14.
- Don'tPrimary: trials started, "because they move faster"
A step, not the goal: trials can rise while payers fall.
Why only one primary metric
Every metric you read at a 5% false-positive rate has a 5% chance of "winning" even when the change does nothing. One metric, one 5% risk. Several metrics that can each declare a win multiply the chances.
For independent metrics the chance that at least one wins by accident is:
P(at least one false win) = 1 − 0.95^k
where k is the number of metrics that can trigger a decision.
- k = 1: 5%;
- k = 2: 1 − 0.95² = 1 − 0.9025 ≈ 9.8%;
- k = 3: 1 − 0.95³ = 1 − 0.857375 ≈ 14.3%;
- k = 10: 1 − 0.95¹⁰ ≈ 40.1%.
Real metrics are usually correlated, so the true figure is somewhat lower, but the direction holds: more ways to win means more false wins. That's why the plan names one primary metric and calls the rest secondary, guardrail or exploratory.
If a decision genuinely needs two outcomes, there are formal corrections that tighten each threshold. When you see a report with many metrics and one "significant" result among them, name the multiple comparisons before anyone celebrates.
- Do1 − 0.95³ = 1 − 0.857 ≈ 14.3%
- Don't3 × 5% = 15%, or "still 5%, each metric is tested at 5%"
Adding overstates slightly; ignoring the multiplication understates a lot.
Guardrails: a margin set in advance
A guardrail metric protects something the change might break. A pushier paywall could annoy people who only want to split the rent, so the paywall test guards the share of users who still add an expense in days 8–14.

A guardrail needs a margin: the largest loss you'd accept in exchange for the gain. Here it's 3 percentage points. Choosing 3 rather than 1 is a business call, but when you choose it matters more than the number: after the test, any drop looks small to someone who wants to ship.
The guardrail is read with its interval, like the primary. It passes only when the whole 95% interval for treatment − control sits above −3 pp, so that even the worst plausible drop is within the margin.
"The drop wasn't significant" is not a pass. Not significant only means the interval includes zero. An interval from −4.5 to +0.5 pp is not significant, and it still allows a drop of 4.5 points, beyond the margin. A small test can easily miss real harm; the interval shows how much harm it could have missed.
- DoGuardrail interval −2.0 to +0.4 pp, margin −3 pp → passes
- Don'tInterval −4.5 to +0.5 pp: "not significant, so no harm"
A 4.5-point drop is still plausible, beyond the 3-point margin.
Checking an interval against a margin
To check a guardrail you need two things: its margin from the plan and its 95% interval for treatment − control. Then look at one end of the interval only: the lower bound, the worst plausible effect.
- Lower bound above the margin: even the worst case is acceptable. The guardrail passes.
- Lower bound below the margin: a harmful drop is plausible. The guardrail fails, whatever the point estimate says.
Two examples with a −3 pp margin:
- −2.0 to +0.4 pp: the worst case is a 2.0-point drop, inside the margin. Pass.
- −3.6 to +0.2 pp: the point estimate is about −1.7 pp and the interval includes zero, so the result is "not significant". But a 3.6-point drop is plausible. Fail.
Notice that the second result looks reassuring on a dashboard: small negative estimate, no significance flag. It's still a fail, because the plan asked whether harm beyond 3 points can be ruled out, and this test can't rule it out.
A wide guardrail interval usually means the test is too small for the margin. That's a planning problem to fix before launch, not after.
- DoLower bound −2.0 > −3 → pass
- Don'tEstimate −1.7 pp, interval −3.6 to +0.2: "small and not significant, pass"
The lower bound is past the margin.
The decision rule: three branches
The decision rule says in advance what happens for every possible result. It's written in terms of the effect, treatment − control in percentage points, its 95% interval, and the smallest effect worth shipping (here +1 pp: smaller gains aren't worth the change).
Test plan: trial-first paywall · shown above
For the primary metric, the interval falls into one of three cases:
- Entirely above 0 (and the guardrail passes): ship. The paywall helps.
- Includes 0 and stays below +1 pp: don't ship. Whatever the effect is, it's too small to matter.
- Anything else, typically an interval that includes both 0 and +1 pp: inconclusive. Keep the current version and decide whether a larger test is worth running.
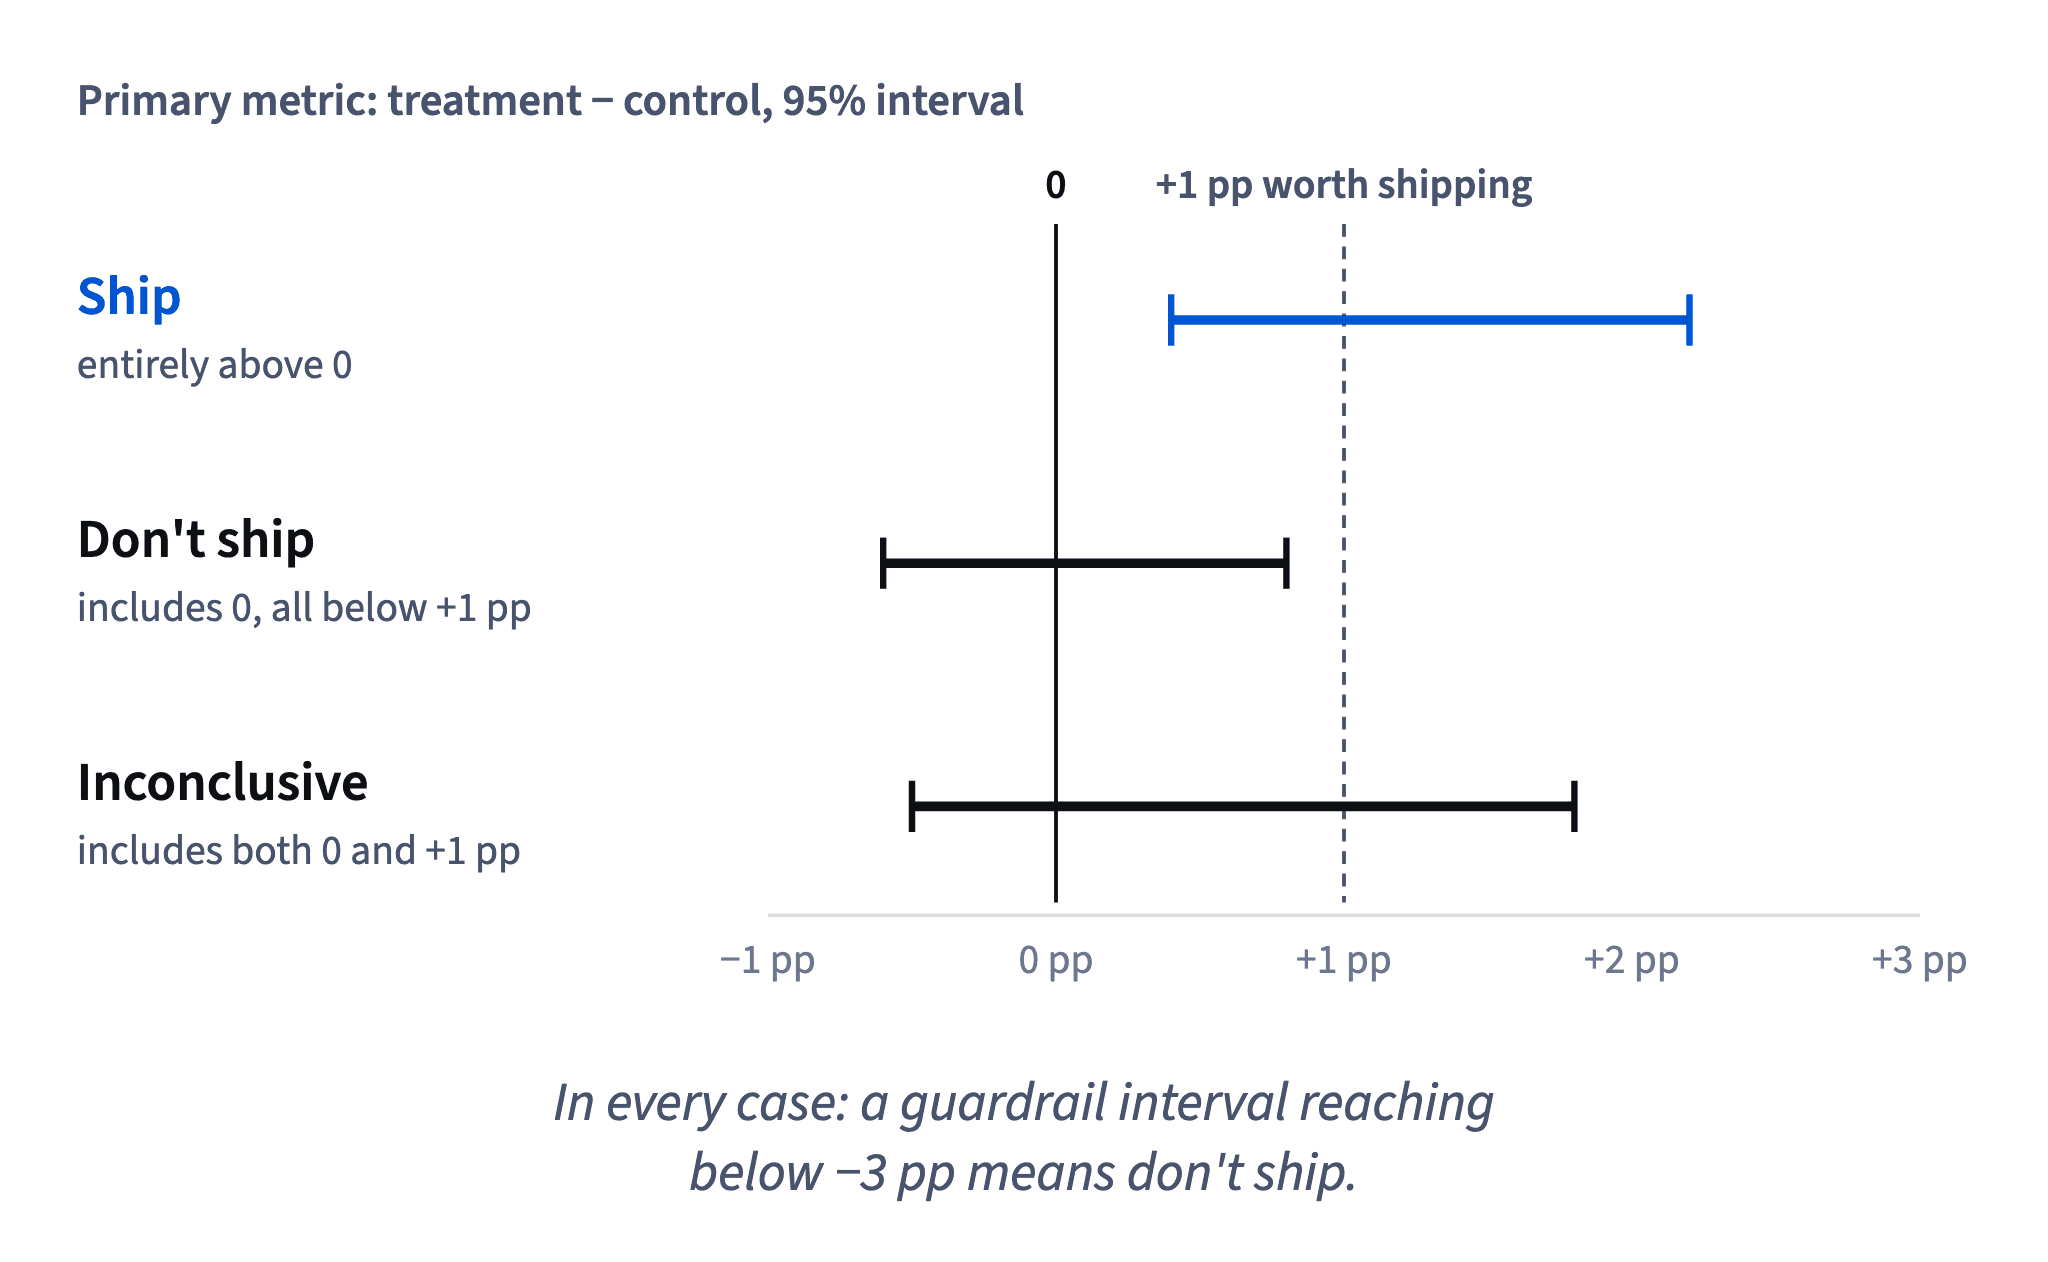
Take +0.4 pp with an interval from −0.5 to +1.3 pp. The interval includes 0, so you can't say the paywall helps. It also reaches +1.3, so you can't say the effect is too small. That's inconclusive.
Two misreadings are common. "Not significant, so no effect" ignores that the interval still allows a worthwhile gain. "+0.4 is positive, ship it" ignores that the interval allows a loss. The rule reads the whole interval, never the point estimate alone.
- Do+0.4 pp, −0.5 to +1.3 → includes 0 and +1 → inconclusive
- Don't"p > 0.05, the new paywall has no effect."
The interval still allows a gain of up to 1.3 pp.
The guardrail can veto a win
The ship branch needs both conditions: the primary's interval is entirely above 0 and the guardrail's interval is entirely above its margin. A clear win on the primary doesn't override a failed guardrail.
Suppose the paywall test ends with:
- primary, treatment − control: +1.8 pp, interval +0.6 to +3.0 pp: a clear gain;
- guardrail: −2.1 pp, interval −3.8 to −0.4 pp: a drop that may exceed the 3-point margin.
The rule says don't ship. More people pay, but the test can't rule out that more than 3 points of users stop adding expenses, a harm agreed in advance as unacceptable. Reopening that agreement with a winning number on the table is what the plan exists to prevent.
A surprise failure calls for a new version and a new plan, not a reinterpretation of this one. And the result is read once, at the planned size (How big and how long explains why).
How it fits together: a hypothesis that could lose, one primary metric, guardrails with margins and a three-branch rule, all dated before launch, turn a result into a decision, not a debate. Next, How big and how long sizes the test.
- DoPrimary +0.6 to +3.0, guardrail −3.8 to −0.4 (margin −3) → don't ship
- Don't"Payers are clearly up; −2.1 pp of usage is a fair price."
Renegotiates the margin after seeing the result, and ignores the −3.8 bound.
Ready to practise?
Answer the lesson's exercises and earn 250 points the first time you finish it.
Start the exercises