

Theory
Retention: day N, rolling or bracket
Three ways to measure retention and which fits a product people use weekly or monthly.
~10 min read · 9 exercises · 250 points
Before you start
Do people come back?
You're on the product team at Halves, a bill-splitting app for flatmates, couples and trips, with a paid plan, Halves Plus. Signing people up is only half the story: an app nobody opens a month later isn't growing, it's leaking. This module answers one business question, whether people come back, and shows how to read the answer honestly: which retention measure to use, how to read a cohort table, what a flattening curve says about product-market fit, and how to judge each segment by its own rhythm. This first lesson starts with the word itself: three different numbers that are all called "retention".
Day-N retention: active on exactly that day
"Retention" is not one number. Before you compare two retention figures, find out which of three measurements each one is.

The strictest is day-N retention: the share of a cohort that was active exactly on day N after sign-up.
Day-N retention = users active on day N ÷ all users in the cohort
Day 0 is the sign-up day itself, so day 7 is one week later. The denominator is everyone who signed up, including people who never came back.
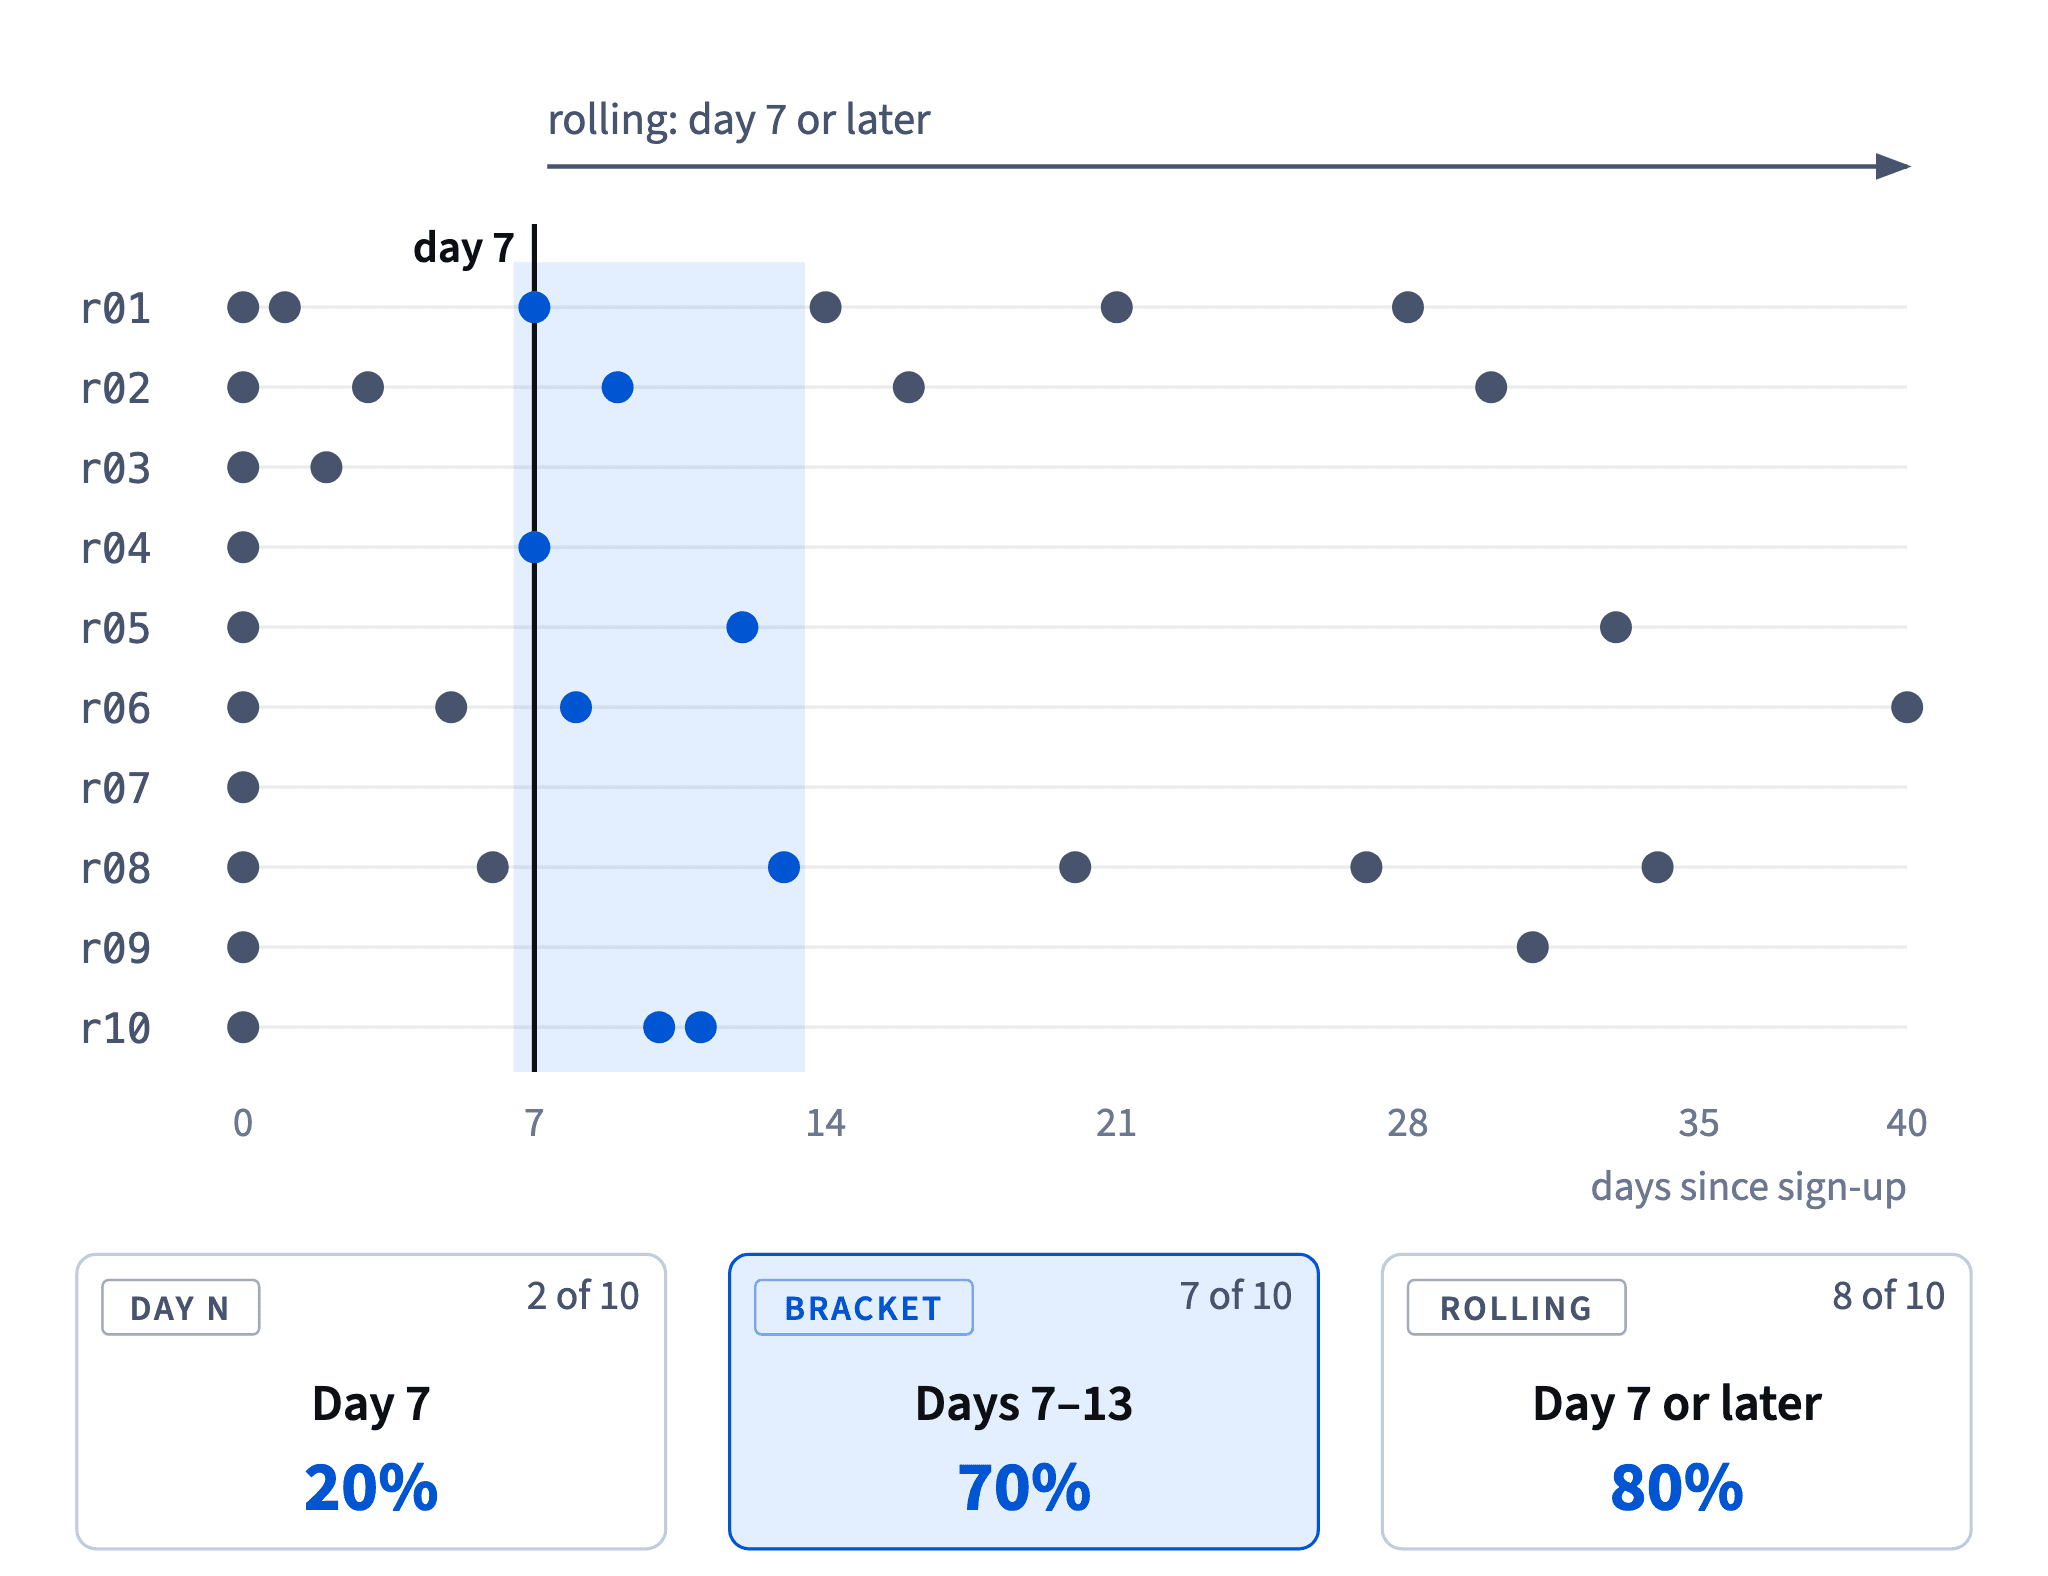
In the ten-user table, only r01 and r04 opened Halves on day 7 itself: 2 ÷ 10 = 20%. Someone who came back on day 9 counts as not retained on day 7, even though they are clearly still using the app.
Dataset · 10 rows
Ten Halves users and their active days
Days since sign-up with `app_opened`, separated by `;`. Observed to day 40.
First 5 of 10 rows
That strictness suits products people need every day, such as games, messengers or habit trackers, where missing a day really means something. For a product used a few times a week or a month it adds a lot of noise: the number depends on which exact day people happened to open the app.
- DoDay-7 retention = 2 active on day 7 ÷ 10 signed up = 20%
- Don'tCounting r02 (back on day 9) as day-7 retained
That's a later day, so it belongs to rolling or bracket retention, not day-N.
Rolling retention: "not gone yet"
Rolling retention counts a user as retained on day N if they were active on day N or on any later day. The question it answers is "has this person not left yet?"
Rolling retention on day N = users active on day N or later ÷ all users in the cohort
In the ten-user table, eight people have some activity on day 7 or after: r01, r02, r04, r05, r06, r08, r09 and r10. Only r03 (last seen on day 2) and r07 (day 0 only) drop out, so rolling day-7 retention is 8 ÷ 10 = 80%. Note r09: one visit on day 31 is enough to count as retained on day 7.
Dataset: Ten Halves users and their active days · shown above
Because any later visit counts, rolling retention is always at least as high as day-N retention for the same day, and usually much higher. That makes it the most flattering of the three measures.

It has one honest use: telling users who might still come back from users who are gone for good. As a headline number in a report it overstates how many people actually use the product in a given period.
- DoRolling day 7: anyone with a day ≥ 7 → 8 of 10 = 80%
- Don't"80% of users were active in week 2."
Rolling includes r09, who was only seen on day 31; in week 2 itself 70% were active.
Bracket retention: active within a window
Bracket retention is the share of a cohort that was active at least once within a window of days, for example days 7–13 (the second week) or days 30–59 (the second month).
Bracket retention = users with at least one active day in the window ÷ all users in the cohort
In the ten-user table, seven people have a day between 7 and 13: r01 (7), r02 (9), r04 (7), r05 (12), r06 (8), r08 (13) and r10 (10 and 11). r03 and r07 never came back, and r09's only later visit, on day 31, is outside the window. So bracket retention for days 7–13 is 7 ÷ 10 = 70%.
Dataset: Ten Halves users and their active days · shown above
A bracket sits between the other two measures. It forgives the exact day, so a user who comes back on day 9 instead of day 7 still counts. But unlike rolling retention it still asks a real question about a period: did this person show up in week 2 or not?
One more detail: a user counts once per window, however many days they were active. r10 has two days in the bracket and still adds 1 to the numerator.
- DoDays 7–13: r01, r02, r04, r05, r06, r08, r10 → 7 ÷ 10 = 70%
- Don'tCounting active days instead of users: r10 adds 2
Each user counts once per window, or the share can pass 100%.
Computing a bracket step by step
To compute bracket retention by hand or in a query, go user by user:
- Fix the window, with both ends included: days 14–20 means 14, 15, 16, 17, 18, 19 and 20.
- For each user, ask one yes/no question: is there at least one active day inside the window?
- Count the yeses and divide by everyone in the cohort, not only by those who came back at all.
For days 14–20 in the ten-user table: r01 has day 14, r02 has day 16, r08 has day 20. Everyone else either stopped earlier or jumped over the window (r05 from 12 to 33, r09 from 0 to 31). That gives 3 ÷ 10 = 30%.
Dataset: Ten Halves users and their active days · shown above
Two slips are common. The first is quietly switching to rolling logic and counting anyone seen after the window: that would add r05, r06 and r09 and give 60%. The second is dropping users who never returned after day 0 from the denominator, which makes every bracket look better than it is.
- DoDays 14–20: r01 (14), r02 (16), r08 (20) → 3 ÷ 10 = 30%
- Don'tAdding r05 (33), r06 (40) and r09 (31) → 6 ÷ 10 = 60%
That's rolling retention from day 14, not the week-3 bracket.
Pick the measure by the natural usage rhythm
The same ten users give 20% (day 7), 70% (days 7–13) and 80% (rolling). None of these is wrong; they answer different questions. Choose by the product's natural usage rhythm, how often a happy user would open it (DAU, WAU, MAU and stickiness shows how to find it in the data). Each rhythm has its own retention measure:
- A daily product (a puzzle game, a chat app) should be used every day, so day-N retention fits: missing day 1 is a real signal.
- Halves couples and friends on a trip split bills a few times a week, so a weekly bracket (days 7–13, 14–20…) fits them.
- Flatmates who log rent and utilities come back about once a month, so a monthly bracket (days 30–59) fits them.
- Rolling retention fits one question only: has this user gone for good?
A measure stricter than the rhythm reports people who still use the product as lost. A measure looser than the rhythm, like rolling, counts people who stopped long ago.
- DoHalves flatmates logging rent → monthly bracket, days 30–59
- Don'tJudging a monthly rent feature by day-1 retention
Nobody pays rent the day after signing up; the measure is stricter than the rhythm.
Name the measure and the window next to every number
Theo's blog said good apps keep 25% on day 7; Halves has 20% on day 7 and 70% in week 2. Comparing 70% with 25% would look like a triumph, and comparing 20% with 25% like a failure. Both comparisons are broken in the same way: they put two numbers side by side without checking that they measure the same thing.
A retention number is only readable with three labels:
- the measure: day-N, bracket or rolling;
- the window: day 7, days 7–13, days 30–59;
- the cohort: who signed up when.
Picture: The same ten users give 20% day-7 retention, 70% bracket retention for days 7–13 and 80% rolling retention: name the measure next to every number. · shown above
A benchmark you found online is only comparable if it uses the same measure and window, and ideally a product with a similar rhythm. Most published benchmarks don't say which measure they use, and then they are not usable at all.
So the honest sentence is: "Week-2 bracket retention (days 7–13) of the June cohort: 70%." It is longer than "retention is 70%", and it is the only version that nobody can misread.
- Do"Week-2 bracket retention (days 7–13): 70%; day-7 retention: 20%."
- Don't"Our retention is 70%, far above the 25% benchmark."
A bracket compared with a day-N benchmark: two different measurements.
Rolling retention keeps changing after you report it
Day-N and bracket retention become final as soon as their day or window has passed. Bracket retention for days 28–34 can only change while days 28 to 34 are still happening; after day 34 nothing a user does can change it.
Rolling retention never closes. It counts activity on day N or any later day, so every future return rewrites it.
In the ten-user table, rolling day-28 retention computed on day 35 is 50%: r01, r02, r05, r08 and r09 have been back since day 28. On day 40 r06 opens the app, and the same metric for the same cohort becomes 6 ÷ 10 = 60%. Nothing about the product changed; the report did.

Dataset: Ten Halves users and their active days · shown above
That causes two practical problems. A number in last month's deck no longer matches the dashboard, and a recent cohort always looks worse than an old one, simply because the old one has had more time to collect late visits. If you must use rolling retention, write the date it was computed on and compare cohorts only at the same age.
- Do"Bracket retention, days 28–34: 50% (final)."
- Don't"Rolling day-28 retention: 50%" with no date, compared with an older cohort
It will grow as late users return, and the older cohort has had longer to grow.
A number is final only once its window has passed
Before you report any retention number, check the calendar: has every user in the cohort lived through the whole window? A window that hasn't ended yet is right censoring (Reading a funnel: right censoring and date ranges covers it in depth): a missing return may simply not have happened yet.
On day 35 after sign-up, the picture for the ten users is:
- Day-28 retention and bracket retention for days 28–34 are final. Those days are over.
- Bracket retention for days 30–59 is not ready. Days 35 to 59 haven't happened, so today's figure counts part of the window and will grow. Reporting it now understates retention.
- Any rolling retention is never final, as the r06 example showed.
Dataset: Ten Halves users and their active days · shown above
With real cohorts, count only users old enough for the window, and say so next to the number.
How it fits together: pick the measure by the product's rhythm, label measure, window and cohort, and report only windows that have ended. Next, Reading a cohort table puts many cohorts side by side.
- DoOn day 35: report the days 28–34 bracket (50%), final
- Don'tOn day 35: report a days 30–59 bracket as month-2 retention
Most of the window is still in the future, so the number is too low.
Ready to practise?
Answer the lesson's exercises and earn 250 points the first time you finish it.
Start the exercises