

Theory
Case: reading a finished test
Effect, interval, guardrails and the decision.
~10 min read · 10 exercises · 250 points
Before you start
Case: six weeks later
Six weeks on, the Halves paywall test is over. Maya is ready to put a big jump in trials into the all-hands deck, and Theo wants to ship on iOS first because one platform looks better. The product team is waiting for your reading.
This case closes the module. You'll read the finished test in the order the plan fixed before launch: the split, the primary metric with its interval, the guardrail and the decision rule.
First check: is the split what you asked for?
Before reading any metric, check that the test assigned users the way the plan said. With a 50/50 split the two variants should be close in size, but never exactly equal: random assignment wobbles.
A quick test is a chi-square check on the counts. With N users in total, each variant is expected to get E = N ÷ 2. Then:
χ² = (n₁ − E)² ÷ E + (n₂ − E)² ÷ E
For the paywall test: N = 6,897 + 6,792 = 13,689, E = 6,844.5. Each variant is 52.5 users from E, so χ² = 2 × 52.5² ÷ 6,844.5 ≈ 0.81. The threshold for one degree of freedom at 5% is 3.84; 0.81 is well under it, so the split is fine.
A split like 7,400 against 6,300 gives χ² ≈ 88: far too lopsided to be chance. That's a sample ratio mismatch (SRM), and it almost always means a bug: one variant crashes on older phones, logs some users twice, or loses users on a redirect. The bug usually hits a particular kind of user, so the two groups are no longer comparable. Fix it and rerun; don't interpret the result.

- Do6,897 vs 6,792: χ² ≈ 0.81 < 3.84 → split OK, read on
- Don't7,400 vs 6,300: "close enough, let's see the conversion"
χ² ≈ 88: a broken assignment, not a result.
Pool the counts, then divide
A variant's rate comes from pooling, the rule for any ratio built from parts: add up its counts across all rows, then divide once. Here the dataset has one row per enrollment week, platform and variant, eight rows per variant:
Dataset · 16 rows
Halves paywall test: control vs trial_first
Users enrolled at their first paywall view, 3–30 August 2026, each followed for 14 days. One row per enrollment week, platform and variant.
First 5 of 16 rows
Rate = Σ paid_14d ÷ Σ users
Control: paid_14d = 43 + 27 + 39 + 23 + 39 + 27 + 40 + 22 = 260; users = 1,002 + 715 + 1,009 + 714 + 1,041 + 709 + 992 + 715 = 6,897. Rate: 260 ÷ 6,897 = 3.77%. trial_first: 345 ÷ 6,792 = 5.08%.
Don't average the eight row rates. Rows have different sizes (iOS rows hold about 1,000 users, Android rows about 700), so a simple mean of row rates gives a small Android row the same weight as a large iOS row. The pooled rate counts each user once, which is what the plan's metric ("share of test users who paid within 14 days") means.
Keep enough decimals in the intermediate steps. 260 ÷ 6,897 = 3.7697%; rounding to 3.8% before subtracting would shift the effect by a few hundredths of a point.
- DoControl: 260 ÷ 6,897 = 3.77%
- Don'tAverage of the eight weekly-platform rates for control
Gives small Android rows the same weight as large iOS rows.
The effect: treatment − control, in points
A test's effect is always reported as treatment − control, and for a rate that difference is in percentage points (pp).
5.0795% − 3.7697% = +1.31 pp
The sign carries meaning: positive means the new version is higher. Writing control − treatment flips the sign and confuses every reader who compares it with the plan.
The ratio of the two rates gives a relative lift: 5.0795 ÷ 3.7697 − 1 = +34.7%. It's a correct number, but a different one, and it must be labelled as relative. "+34.7%" on its own invites the reader to think conversion went from 3.77% to about 38%, or simply sounds bigger than the business change it describes.
The plan was written in points (the smallest effect worth shipping is +1 pp), so the decision is read in points too. A good habit is to give the baseline, the new rate and the difference together, then the relative lift in brackets if someone needs it: "3.77% → 5.08%, +1.31 pp (relative +34.7%)". That one line can't be misread.
- Do5.0795 − 3.7697 = +1.31 pp
- Don't5.08 ÷ 3.77 = 1.35 → "effect: 1.35"
A ratio presented as if it were the effect, with no unit.
An interval for the difference of two rates
For each rate, take the Wilson 95% interval: it stays sensible for small rates like 4%, where the simple "p ± 1.96 × standard error" misleads. Control (260 of 6,897): 3.35% to 4.25%. trial_first (345 of 6,792): 4.58% to 5.63%.
For the effect d = p_T − p_C, combine the two intervals. Each bound of the effect uses the distances that push it the same way:
- lower bound: trial_first could be lower (p_T − L_T = 5.08 − 4.58 = 0.50) and control higher (U_C − p_C = 4.25 − 3.77 = 0.48). L = 1.31 − √(0.50² + 0.48²) = 1.31 − 0.693 = +0.62 pp.
- upper bound: trial_first higher (U_T − p_T = 0.55) and control lower (p_C − L_C = 0.42). U = 1.31 + √(0.55² + 0.42²) = 1.31 + 0.692 = +2.00 pp.
So: +1.31 pp, 95% interval +0.62 to +2.00 pp. The common slip is subtracting the bounds directly (4.58 − 4.25 = 0.33), as if both rates sat at their extremes at once.

- DoL = 1.31 − √(0.50² + 0.48²) = 1.31 − 0.693 = +0.62 pp
- Don'tL = 4.58 − 4.25 = +0.33 pp
Treats both worst cases as happening together, so the interval is too wide.
A headline that can't be misread
The first line of a test readout is the one people quote. It should carry everything needed to judge the result, so nobody has to dig for it:
- the primary metric by name, as defined in the plan;
- both rates, so the baseline is visible;
- the effect in points, treatment − control;
- its 95% interval;
- the relative lift only if useful, labelled as relative.
For the paywall: "Paid within 14 days: 3.77% → 5.08%, +1.31 pp (95% interval +0.62 to +2.00 pp); relative lift +34.7%."
Compare "Paid conversion +35%". It drops the baseline, the unit and the uncertainty, and "+35%" sounds like a different, bigger change than the one that happened. Worse still is leading with a secondary metric, like "Trials +74%": that's not the number the decision was made on.
The headline isn't the place for adjectives ("huge", "almost significant"). The numbers, with their unit and interval, already say how big and how sure.
- Do"Paid within 14 days: 3.77% → 5.08%, +1.31 pp (+0.62 to +2.00)."
- Don't"Paid conversion +35%!"
No baseline, no unit, no interval, and it reads as a bigger change.
Applying the rule you wrote before launch
Reading a planned test is mostly checking numbers against the plan, in its order:
- Split: balanced (χ² ≈ 0.81).
- Size and power: 6,897 and 6,792 users against 6,735 planned per variant, full 4 weeks plus the 14-day window. The test had the power it was built for.
- Primary: +1.31 pp, 95% interval +0.62 to +2.00 pp, entirely above 0.
- Guardrail: expense added in days 8–14, 60.53% → 60.60%, +0.07 pp, interval −1.57 to +1.70 pp, entirely above the −3 pp margin.
- Rule: both ship conditions hold, so ship trial_first to all users.
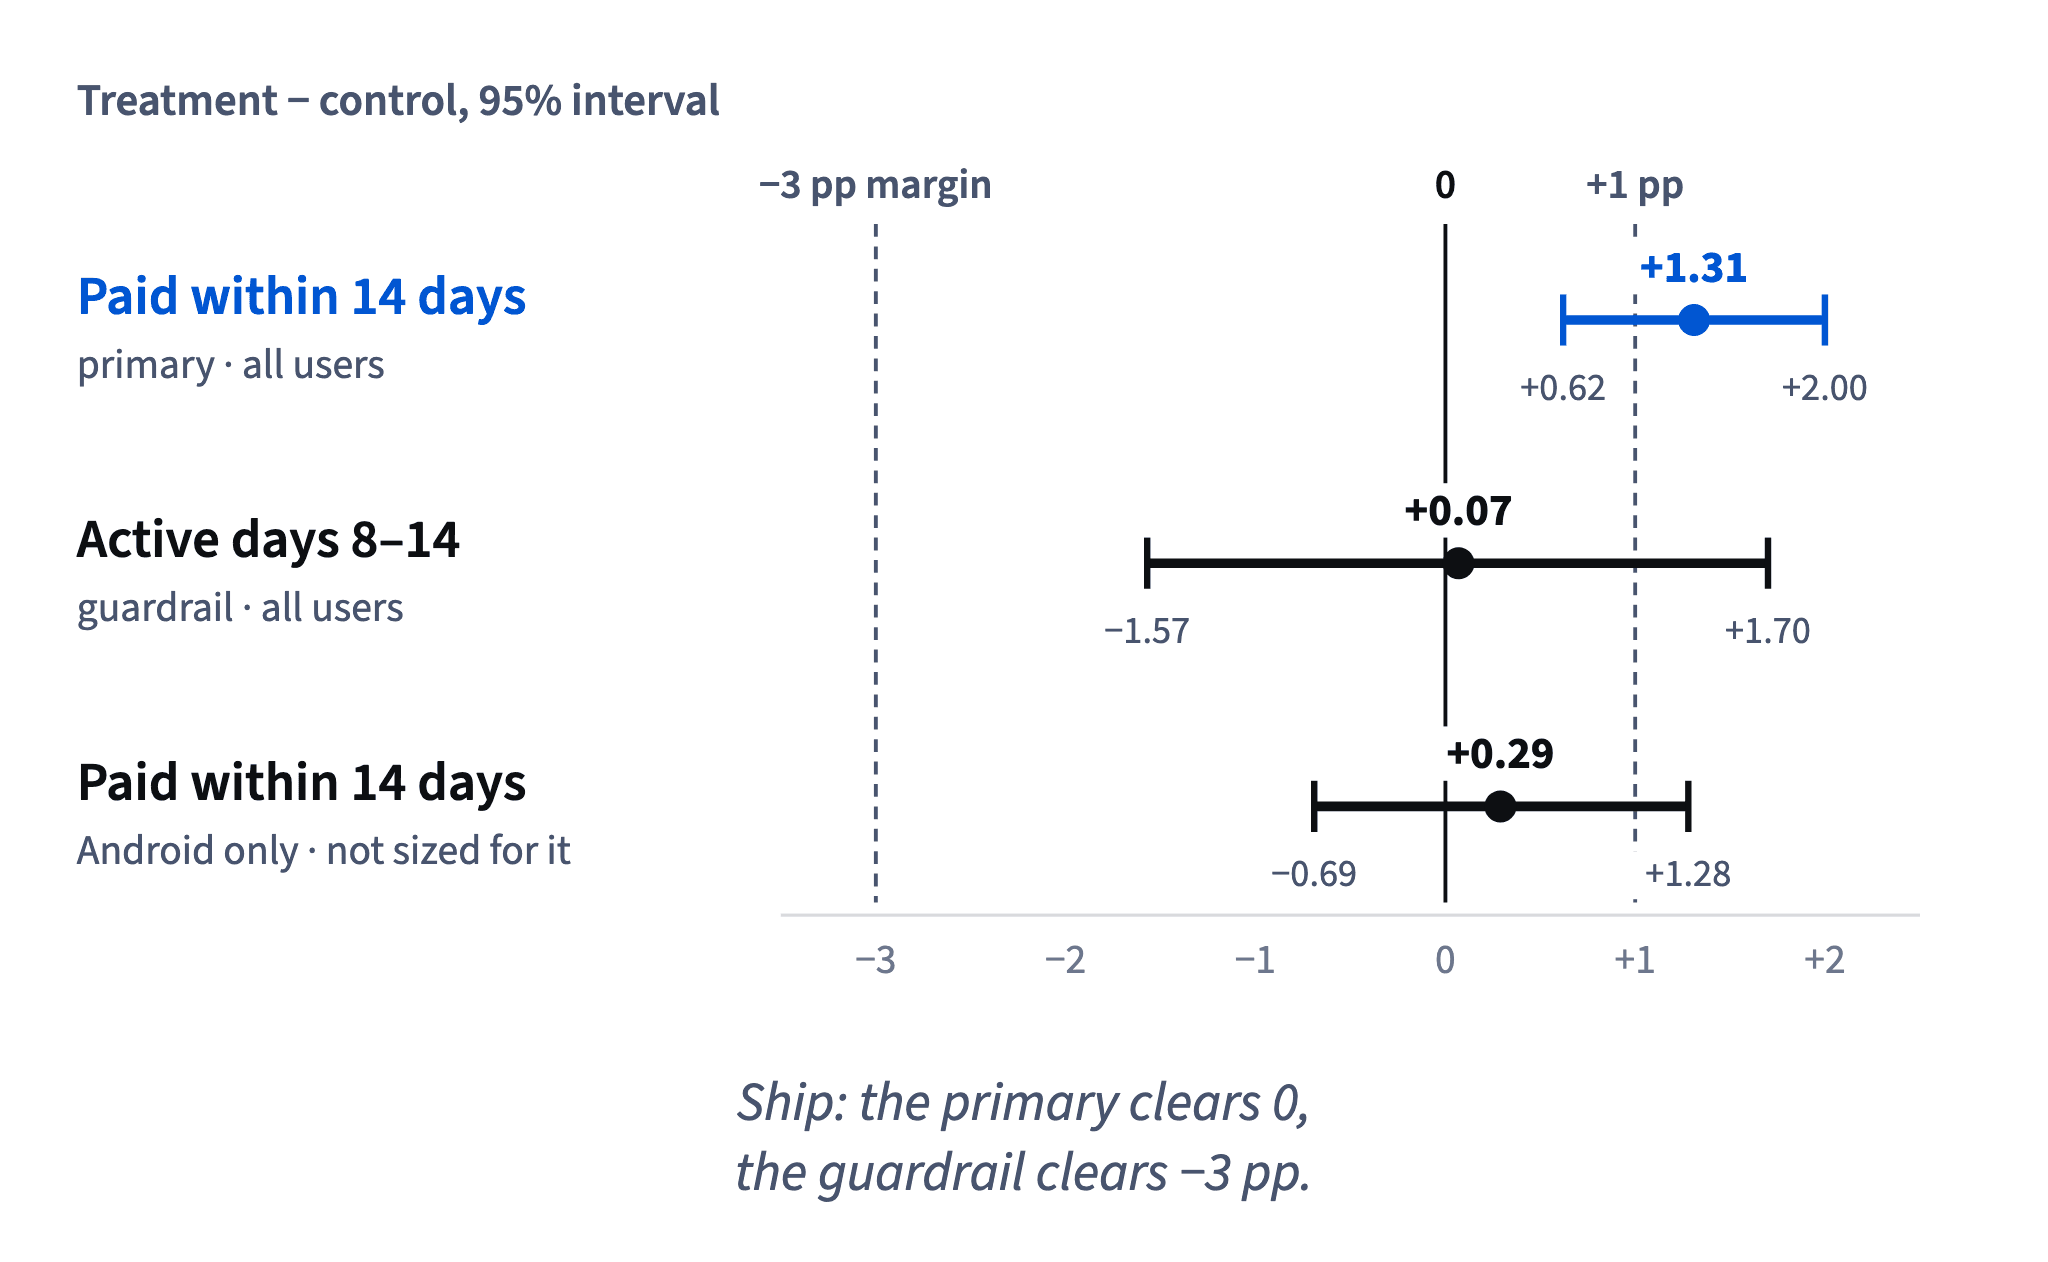
Two points often trip people up. First, the primary's interval includes +1 pp, the smallest effect worth shipping. That doesn't block the decision: the rule asks for an interval above zero, and the point estimate is above +1. Second, the guardrail difference isn't significant, and that is exactly the hoped-for outcome: the interval rules out harm beyond the margin. "Not significant" on a guardrail is only a problem when its interval also reaches past the margin.
- DoPrimary +0.62 to +2.00 > 0; guardrail −1.57 > −3 → ship to all
- Don't"The interval includes +1 pp, so the test must be rerun."
The rule asks for an interval above 0, which this one is.
Secondary metrics explain, they don't decide
Trials are the most exciting number in this test. Pooled across rows: control 587 of 6,897 = 8.51%, trial_first 1,004 of 6,792 = 14.78%. The effect is 14.78 − 8.51 = +6.27 pp; as a relative lift, 14.78 ÷ 8.51 − 1 = +73.7%, which is where "Trials +74%" comes from.
Dataset: Halves paywall test: control vs trial_first · shown above
It's still a secondary metric. It tells you how the paywall worked: leading with a trial got far more people to try Plus, and some of them paid. It doesn't tell you whether the paywall worked for the business. That's the primary metric, +1.31 pp of paid users, and it is much smaller than the jump in trials: many of the extra trials never turned into payments.
Three rules keep secondary metrics in their place:
- report them after the primary, never as the headline;
- give them the same treatment: points, labelled relative lift, and ideally an interval;
- remember they were not the basis of the decision, and each extra metric is another chance of a lucky difference.
The honest all-hands slide says "more users tried Plus, and paid conversion rose by 1.31 points".
- DoTrials 8.51% → 14.78%, +6.27 pp (relative +74%), reported after the primary
- Don'tHeadline: "Trials +74%"
A secondary metric as a relative lift, presented as the result.
Subgroups found after the test
After a test it's tempting to slice the result by platform, country, channel or week. The slices weren't planned or sized, and each is another chance to find a difference by luck, so they generate questions, not decisions.
The paywall test shows how slices mislead in both directions:
- Android: +0.29 pp, interval −0.69 to +1.28 pp. It includes both 0 and +1 pp, so it's inconclusive, not "no effect": with under 3,000 users per variant, the test can't tell.
- iOS: the primary looks great, +2.00 pp (+1.05 to +2.96), but the iOS guardrail interval, −3.66 to +0.60 pp, reaches past the −3 pp margin. Judged as its own test, iOS would fail the guardrail.
The decision stays with the pre-written rule on all users: ship to everyone. If a platform matters, watch it after launch or plan a test sized for it.
How it fits together: check the split, pool, subtract treatment − control, put an interval on it, apply the written rule, then explain with secondary metrics and treat slices as questions. Module 5 answered whether the change worked; the next module asks what you can learn without a test.

- Do"Android: +0.29 pp (−0.69 to +1.28), inconclusive; we'll watch its paid conversion after launch."
- Don't"iOS is +2 pp, Android shows nothing: ship on iOS only."
Decides on unplanned slices; iOS alone would even fail the guardrail.
Ready to practise?
Answer the lesson's exercises and earn 250 points the first time you finish it.
Start the exercises