

Theory
Price testing case: price or paywall?
Price testing in practice: read a price test and a paywall before-and-after honestly, then recommend what Halves Plus should do next.
~10 min read · 10 exercises · 250 points
Before you start
Case: price or paywall?
Next quarter's plan at Halves has room for one idea. Theo wants Halves Plus prices up 20%; the design team wants to show the paywall at a different moment. Maya wants you to pick one with data.
This case closes the module. You'll read a real price test and a before-and-after comparison of the paywall honestly, weigh how strong each piece of evidence is, and recommend what Halves Plus should do next.
The primary metric of a price test
A price test needs a primary metric that sees both sides of the trade a price rise makes: a few buyers lost for more money from each. As A/B test plan: hypothesis, metrics, guardrails sets out, one metric decides and the others guard it.
- Conversion to paid only sees the loss: a higher price is expected to lower it, so a drop doesn't mean failure.
- Revenue per paying user only sees the gain: it rises almost automatically, because the same plan costs more, and it ignores everyone who walked away.
- Trial starts see neither: they measure interest, not money.
Revenue per exposed user (here, first-payment revenue per paywall viewer) combines the two: fewer payers times more per payer, divided by everyone who saw the price. That's the metric Halves wrote down before the June test.
Conversion to paid and trial starts still matter, as guardrails: they show how the primary metric moved and warn about damage that revenue hides, such as fewer future subscribers to sell to. Choose all of this before launch, together with the decision rule, so the result can't pick its own metric afterwards.
- DoPrimary: first-payment revenue per paywall viewer. Guardrails: conversion to paid, trial starts.
- Don'tPrimary: revenue per paying user.
Rises with any price increase, even one that drives most buyers away.
Revenue per viewer with two plans
With more than one plan, revenue per viewer has to add up every plan at its own price before dividing:
revenue per viewer = (monthly payers × monthly price + yearly payers × yearly price) ÷ paywall viewers
Halves June price test, higher-price arm: 166 monthly payers at $5.99 and 62 yearly payers at $47.99, 2,988 viewers. Revenue $994.34 + $2,975.38 = $3,969.72, per viewer $1.3286. Control: 187 × $4.99 + 74 × $39.99 = $3,892.39, per viewer $1.2923.
Dataset · 2 rows
Halves Plus price test, June 2026
Randomized by user; read on 5 July, when every trial had ended.
Three details matter:
- the denominator is every viewer in the arm, including the ones who never paid, because the randomization happened at the paywall;
- yearly plans arrive as one big payment, so a handful of yearly buyers moves the total a lot: in control they are 28% of payers but 76% of first-payment revenue;
- "first payment" means the metric stops before any renewal, which needs saying next to the number.
Keep four decimals until you compare the arms; the gap between them is only about four cents.
- Do(166 × $5.99 + 62 × $47.99) ÷ 2,988 viewers = $3,969.72 ÷ 2,988 = $1.33.
- Don't$3,969.72 ÷ 228 payers = $17.41 per viewer.
Divides by payers, so everyone the price drove away disappears.
Reading an effect with its interval
A test result has three parts, and all three go into the reading: the effect (treatment − control), its 95% interval, and the decision rule written before launch.
Halves price test: effect on revenue per viewer +$0.036 (+2.8% relative lift), interval −$0.30 to +$0.37. Against control's $1.29, that interval runs from about a 23% loss to a 29% gain. The rule was "raise prices only if the whole interval is above zero", so the rule isn't met.
What this does not mean:
- not "the price rise worked": +2.8% is the point estimate, and the data fits a large loss just as well;
- not "almost significant": there's no such category, and the phrase assumes the direction;
- not "no effect": the test simply couldn't tell a few percent from zero. Yearly plans arrive as $40 lumps, so revenue per viewer is noisy, and about 3,000 viewers per arm aren't enough.
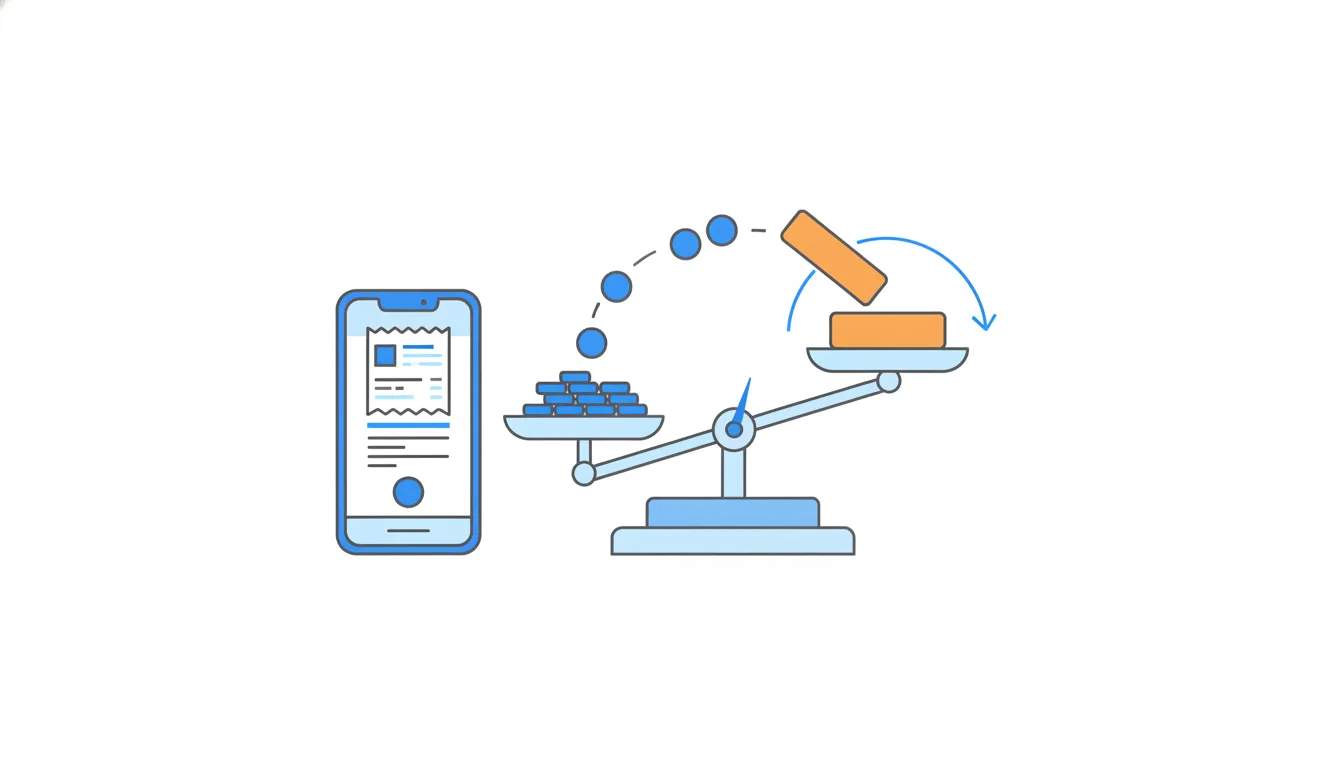
The honest summary: effect, interval, rule not met, and the test lacked the power to detect an effect of the size that matters.
- Do“+$0.036 per viewer, 95% interval −$0.30 to +$0.37: rule not met; the test can’t tell a loss from a gain.”
- Don't“Not significant, so price doesn’t affect revenue.”
Absence of proof read as proof of absence.
Don’t run a test “until it’s significant”
An inconclusive test is information for a better test, not a reason to keep watching. Running it on and checking every few days until the interval clears zero is peeking, which How big and how long explains: repeated looks make a false win far more likely than 5%.
Three steps turn it into a better test:
- Pick the smallest effect worth acting on (the minimum detectable effect, MDE), for example the gain that would pay for the risk of a price change.
- Size the test for it: how many viewers per arm give enough power to detect that MDE with the metric's noise. A noisy metric such as revenue per viewer needs many more viewers than a conversion rate.
- Fix the length in advance, in whole weeks, and read the result once, at the end, against the rule.
If a test of that size is impossible for Halves, say so: the price decision then rests on judgement, and the memo should say that too.
- Do“Size a new test for the smallest gain worth a price change, fix its length in weeks, read it once.”
- Don't“Leave it running and check every Monday; we’ll stop as soon as it turns significant.”
Repeated looks inflate the false-positive rate.
Break-even conversion for a price change
A price rise loses some buyers on purpose. The question is how many it can lose before revenue per viewer falls. Revenue per viewer = conversion to paid × revenue per payer. If every price rises by the same factor and the plan mix stays the same, revenue per payer rises by that factor, so:
break-even conversion = current conversion ÷ price factor
Halves: control converted 261 of 3,012 viewers, 8.67%. Prices up 20%, factor 1.2: break-even = 8.67% ÷ 1.2 = 7.22%. Above 7.22%, the higher price earns more per viewer; below, less.
For a price cut, the same formula gives the conversion needed to break even, which is higher than today's.
Two cautions. The formula assumes the same plan mix; if more buyers switch to the cheaper-per-month yearly plan, revenue per payer grows by less than 20%. And comparing the observed conversion (7.63%) with break-even isn't enough: its interval, −2.42 to +0.35 points around control, reaches below 7.22%.
- DoBreak-even = 8.67% ÷ 1.2 = 7.22%.
- Don'tBreak-even = 8.67% − 20% of it ≈ 6.9%.
Dividing by 1.2 is not the same as taking 20% off.
Guardrails: split conversion to see where buyers left
Conversion to paid at Halves passes through two steps, and each can react to a price differently:
conversion to paid = trial start rate (trials ÷ viewers) × trial-to-paid (payers ÷ trials)
In the June price test:
- control: 548 ÷ 3,012 = 18.19% started a trial, 261 ÷ 548 = 47.63% of trials paid, so 8.67% overall;
- higher price: 509 ÷ 2,988 = 17.03% started a trial, 228 ÷ 509 = 44.79% paid, so 7.63% overall.
Both steps fell a little, so the higher price put off some people at the paywall and a few more at the end of the trial, when the card is charged. That's why trial starts and conversion to paid are guardrails here: they tell you where buyers were lost, and a trial-to-paid drop is an early hint about price sensitivity that renewals may show again later.
Read guardrails the same way as the primary metric, as differences with intervals. Each arm's step rates rest on a few hundred trials, so differences of a few points can be noise.
- DoHigher price: 17.03% start a trial × 44.79% pay = 7.63%; control 18.19% × 47.63% = 8.67%.
- Don'tTrial-to-paid, higher price = 228 ÷ 2,988 = 7.63%.
That divides by viewers: it’s conversion to paid, not trial-to-paid.
A test and a before-and-after are different evidence
A randomized test and a before-and-after comparison are different kinds of evidence, and they don't weigh the same. Maya's two ideas come with one of each.

The price test was randomized: viewers were assigned to an arm by chance, so the arms differ only in price, plus noise. Its difference is an estimate of the price effect, however uncertain. Its weakness is precision: the interval is too wide to act on.
The paywall redesign has a before-and-after comparison: paywall-to-trial 13.39% in April, 16.79% in June. Between those months almost everything else changed too: trip season, the currency trigger's share of viewers (11.79% → 39.35%), the audience. Held at April's trigger mix (the adjustment in How to calculate ARPU and ARPPU), June converts at 12.71%, below April. A before-and-after can't separate the design from the season, whatever the size of the jump.
So a weak test still beats a strong-looking chart for telling cause from coincidence, and the honest next step for the paywall is a test of its own. Neither piece of evidence says anything about renewals, which the price test stopped before.
- Do“The price test is randomized but too imprecise; the paywall evidence is a before-and-after that a mix shift explains.”
- Don't“The paywall gained 25% more trials, the price test only 2.8%, so the paywall is the stronger idea.”
Compares a confounded jump with a test estimate as if they were the same kind of number.
What a first-payment metric can’t see
The June price test measured first-payment revenue per viewer, read on 5 July when every trial had ended. It's clean and early, but it stops at the first charge. For a subscription most of the money comes later, and a price change can move it either way:
- monthly subscribers at $5.99 might cancel sooner than at $4.99, so a first-payment gain can shrink or reverse over a year;
- yearly buyers at $47.99 renew only after twelve months, so their renewals stay invisible for a year.
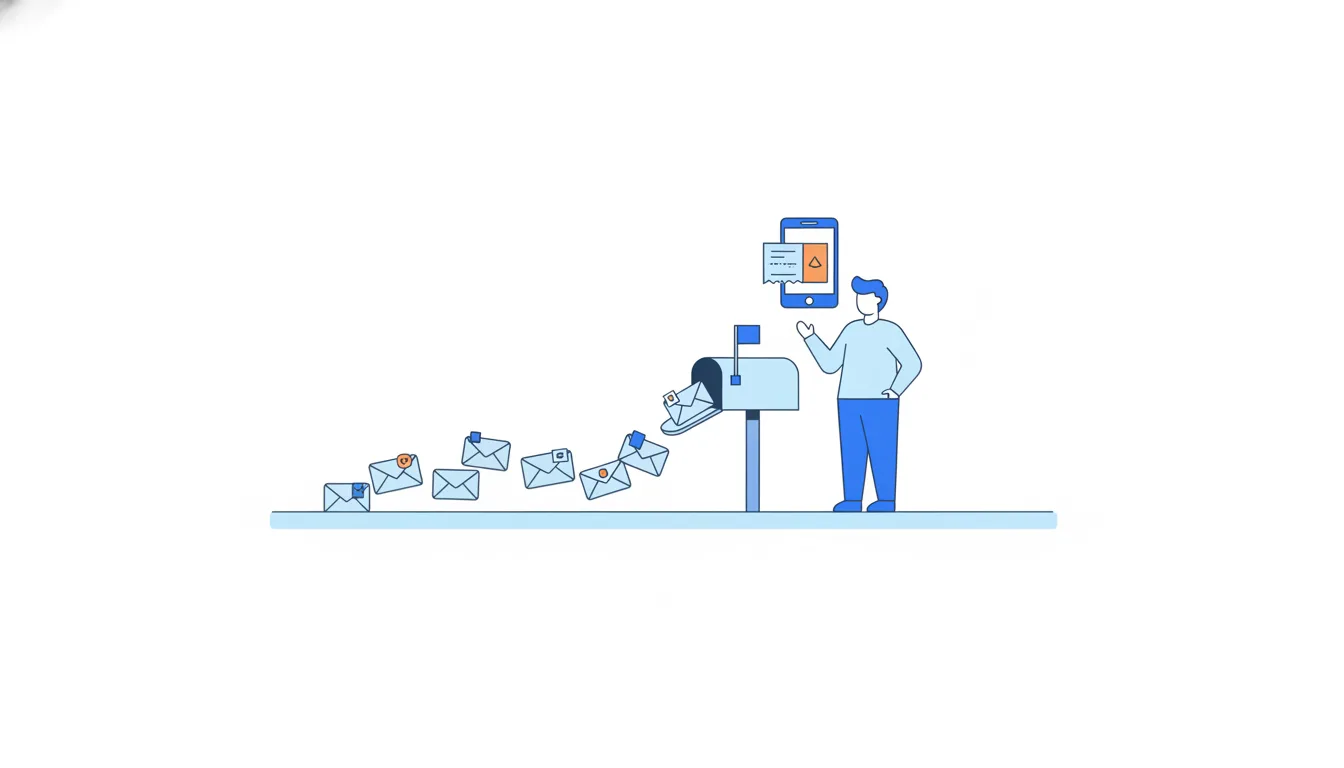
So even a clear win would support "the higher price raises first-payment revenue", not "it raises lifetime revenue". Plan the follow-up: keep the arms apart and compare renewals and cumulative gross profit per viewer at months 1, 3 and 6. For a decision as costly to undo as a price, that follow-up is part of the decision.
How it fits together: an underpowered price test, a confounded paywall chart and a metric that stops at the first payment: neither change is proven yet. Say what each piece supports and which test comes next. Module 7 answered whether Halves makes money on Plus; the next module asks how it grows.
- Do“First-payment revenue per viewer +2.8% (inconclusive); renewals at $5.99 not yet observed, we’ll compare months 1, 3 and 6.”
- Don't“Revenue per viewer is up, so the higher price will earn more over the year.”
The metric stops at the first payment; the year is unobserved.
Ready to practise?
Answer the lesson's exercises and earn 250 points the first time you finish it.
Start the exercises