

Theory
Case: fix the onboarding funnel
Find where new Halves users drop off and what to fix first.
~10 min read · 10 exercises · 250 points
Before you start
Case: one sprint, one fix
Planning time on the Halves product team. The onboarding team has one sprint in September, and Maya needs to know where new users drop off and what to fix first, with numbers.
This case closes the module. You'll build the onboarding funnel by the rules from the last lessons, turn the counts into step conversions, find the biggest leak and recommend the fix for the sprint.
Step conversions show where people drop
A funnel built for a decision starts with its rules, written down: who enters (self-signups, since invitees skip the first steps), complete cohorts only (sign-ups 6 July to 23 August, so everyone has had 7 days), and a step counts if it happened on days 0–6 and every earlier step was reached.
With those rules Halves has 119 → 100 → 71 → 37 → 29: sign-up → group created → member invited → invite accepted → first expense.
Then read the step conversions from Funnels: conversion window, step order and who counts, each step divided by the one before:
- group: 100 ÷ 119 ≈ 84.0%;
- invite: 71 ÷ 100 = 71.0%;
- accepted: 37 ÷ 71 ≈ 52.1%;
- first expense: 29 ÷ 37 ≈ 78.4%.
The weakest step is acceptance: about half of the invitations never bring in a second member.

Dividing every step by the top instead (37 ÷ 119 ≈ 31.1%) shows how many get that far, but it mixes every earlier loss into the number and hides which step is weak.
- DoInvited → accepted: 37 ÷ 71 = 52.1%
- Don'tInvited → accepted: 37 ÷ 119 = 31.1%
Divides by the top of the funnel, not by the previous step.
Overall conversion and the step product
The overall conversion of a funnel is the last step divided by the first: 29 ÷ 119 = 0.244 ≈ 24.4% of self-signups reach a first expense within 7 days.
It equals the product of the step conversions:
0.840 × 0.710 × 0.521 × 0.784 ≈ 0.244
That identity is a free arithmetic check, and it explains why funnels behave the way they do:
- a change at any step moves the overall rate by the same relative amount. Lifting acceptance from 52.1% to 62.5% (×1.2) lifts the overall rate by ×1.2 too;
- in absolute terms, the gain depends on how many people reach that step, which is why fixing a late step with few users can matter less than it looks, and fixing a weak step with many users can matter more.
The overall rate answers "how many get through?" and is the right headline for a dashboard. The step conversions answer "where are the others lost?" and are what you act on. Report both, and never average step conversions: their average (about 71%) is not any real rate.
- DoOverall: 29 ÷ 119 = 24.4% = 0.840 × 0.710 × 0.521 × 0.784
- Don'tOverall: average of the steps, (84.0 + 71.0 + 52.1 + 78.4) ÷ 4 ≈ 71.4%
Step rates multiply; they don't average.
Split the weak step before you decide
The weakest step tells you where people drop. It doesn't tell you whose drop it is. Before choosing a fix, split the funnel by the dimensions that could plausibly matter: platform, channel, country, app version.
By platform:
- iOS: 61 → 50 → 34 → 26 → 19;
- Android: 58 → 50 → 37 → 11 → 10.
Step by step the platforms are close until the invite: groups 82.0% vs 86.2%, invites 68.0% vs 74.0%. Then acceptance splits: iOS 26 ÷ 34 ≈ 76.5%, Android 11 ÷ 37 ≈ 29.7%.
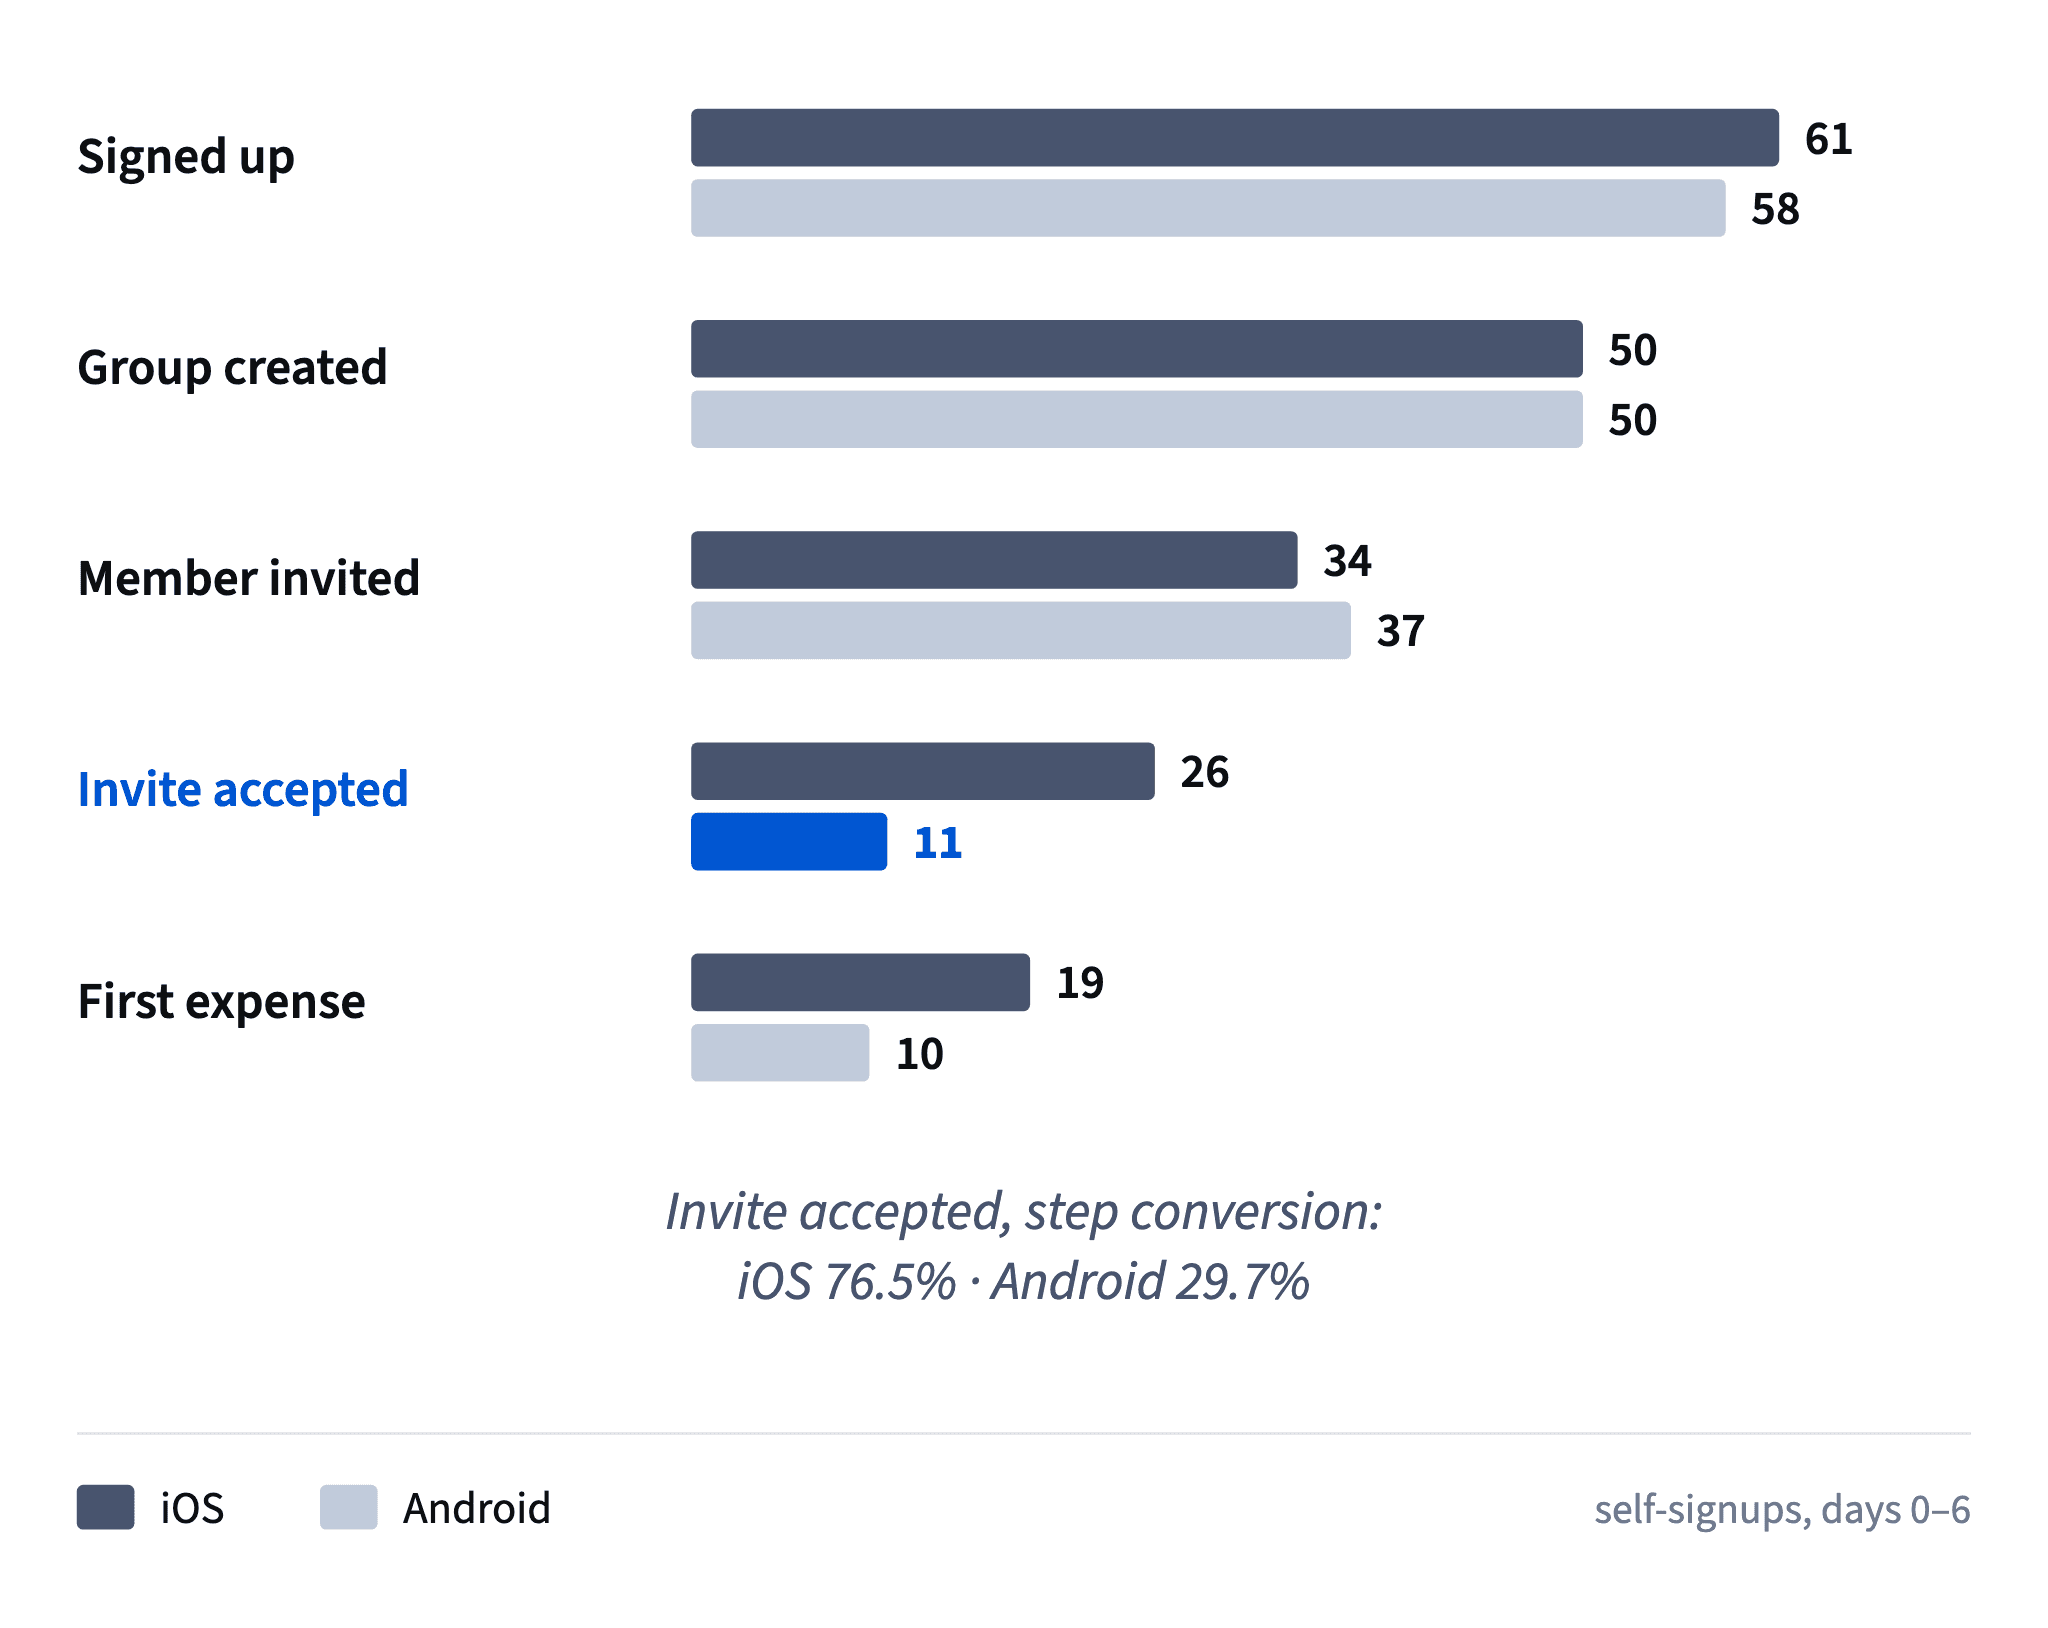
Think about who acts at that step. The people accepting an invite are the inviter's friends, the same kind of people whichever phone the inviter has. What differs is the inviter's platform, so the suspicion falls on how the invite link behaves when sent from Android.
The same split by channel shows no such gap: acceptance is 48.7% for store search and 56.3% for paid social. So the drop isn't about paid users.
A split that turns one average weak step into one broken segment and several healthy ones is the most useful thing a funnel can do.
- DoAcceptance by platform: iOS 26 ÷ 34 = 76.5%, Android 11 ÷ 37 = 29.7%.
- Don't“Acceptance is 52%: let's rewrite the invite message for everyone.”
Acts on the average before checking whose drop it is.
A split points to a cause; it doesn't prove it
Android's acceptance of 29.7% against iOS's 76.5% is a strong lead. It is not yet a diagnosis.
What the split supports: the drop sits at one step, on one platform, while the people acting at that step (the friends receiving invites) shouldn't differ by the inviter's phone. That makes the Android invite flow the prime suspect.

What the split can't do:
- say what is wrong: a link that opens the store instead of the app, a broken deep link on some Android versions, a share sheet that strips the link, or something else;
- rule out another Android-only difference: a different app version shipped at the same time, a different invite button placement, or Android users in these weeks inviting different kinds of contacts.
So the memo should say "points to" and name the next steps:
- ask the engineers and reproduce the invite flow on a few Android phones;
- after the fix, check acceptance on the next complete cohorts, with the same rules, or run a test if the change is risky.
That keeps the claim as strong as the evidence, and no stronger.
- Do“The drop points to the Android invite flow; engineers to confirm, then we recheck the next cohorts.”
- Don't“Data proves the Android invite link is broken.”
A funnel split locates a drop; it can't name the bug.
Small counts need intervals: use Wilson
11 of 37 and 26 of 34 are small numbers, so it's fair to ask whether the gap could be chance. Put an interval on each rate.
For proportions with small counts, or rates near 0% or 100%, use the Wilson interval, not the normal approximation (rate ± 1.96 × standard error). The normal one can run past 0% or 100% and is too narrow at small n; Wilson stays inside the possible range and behaves well with few users.
95% Wilson intervals for invite acceptance:
- iOS: 26 of 34, 76.5%, interval 60.0–87.6%;
- Android: 11 of 37, 29.7%, interval 17.5–45.8%.
How to read them: the intervals are wide, as small samples always are, but they don't overlap. Even Android's upper bound sits below iOS's lower bound. So Android's acceptance is very likely lower; the exact size of the gap is uncertain.
Two readings to avoid. "Too few users to conclude anything" ignores what the intervals show. And "almost significant" isn't a result: report the effect, its interval, and what that means for the decision.
- Do“Android 29.7% (95% Wilson 17.5–45.8%) vs iOS 76.5% (60.0–87.6%): very likely lower.”
- Don't“Android is almost significantly worse; let's watch it another month.”
“Almost significant” hides an interval that's already clear.
Size the prize before choosing a fix
The biggest drop isn't automatically the best fix. Before choosing, estimate what each fix would give, in users, at the same point of the funnel.
For the Android problem, assume Android invites were accepted at iOS's rate, 26 of 34:
- 37 Android inviters × 26 ÷ 34 ≈ 28.3 accepted;
- they actually got 11;
- the prize: 28.3 − 11 ≈ 17.3 more users past acceptance in these seven weeks.
The method is "what if this segment converted like the healthy one?". It needs three things stated: the base (37 inviters, not all Android sign-ups), the target rate (iOS's, which is itself an estimate with an interval) and the period (seven weeks of cohorts).
Treat the result as an order of magnitude, not a promise. With Wilson intervals as wide as these, the true gain could be noticeably smaller or larger. But a prize of about 17 users past the weakest step, out of 37 who acted, is large enough to compare with alternatives, which is exactly what it's for.
- Do37 × 26 ÷ 34 − 11 ≈ 17.3 more Android users past acceptance
- Don't58 × 26 ÷ 34 − 11 ≈ 33.4 more
Applies the acceptance rate to all sign-ups, not to those who invited.
Follow every fix to the same finish line
Two fixes can only be compared if they're measured at the same point. Gains at the top of a funnel shrink on the way down, because every later step loses part of them.
Theo's alternative is to improve group creation from 84% to 90%:
- extra groups: 119 × (0.90 − 0.84) = 7.14;
- they still have to pass invite (71.0%), acceptance (52.1%) and first expense (78.4%);
- 7.14 × 0.710 × 0.521 × 0.784 ≈ 2.1 more first expenses.
The Android fix, followed to the same finish: 17.3 more users past acceptance × 78.4% ≈ 13.6 more first expenses.
So at the finish line it's roughly 14 against 2. The early step looks attractive because it touches everyone, but six points at 84% are a small change, and three more steps eat most of it.
The method assumes later steps keep their current rates for the extra users. That's an approximation: extra users won by a better first screen may be less committed and convert worse later. Say so, and the comparison still holds when the gap is this wide.
- DoGroup creation +6 pts: 7.14 × 0.710 × 0.521 × 0.784 ≈ 2.1 first expenses
- Don't“Group creation +6 pts = 7 more users, so it's almost half the Android prize.”
Compares groups at the top with users past acceptance.
Choosing the fix: impact, certainty, next check
With one sprint, take the fix with the largest sized impact that the evidence supports.
Put the pieces side by side:
The Android fix wins on impact by a wide margin, and the evidence that something is wrong there is strong. Group creation is the first step every user sees, but it already works for most.

A good recommendation adds two things:
- how sure we are: the drop is very likely real, the exact prize uncertain, and the cause a suspect until engineers confirm it;
- how we'll know it worked: same funnel rules, Android acceptance for the next complete cohorts, against the 29.7% baseline and its interval.
How it fits together: set the rules first, find the weak step, ask whose step it is, how sure you are and how big the gain is at the finish line, then say how you'll know. This module answered where new users get stuck; the next one asks whether people come back.
- Do“Fix Android acceptance first (≈ 14 vs ≈ 2 extra first expenses); recheck on the next complete cohorts.”
- Don't“Redesign group creation: it's the first thing everyone sees.”
Chooses by position in the funnel, not by sized impact.
Ready to practise?
Answer the lesson's exercises and earn 250 points the first time you finish it.
Start the exercises