

Theory
Totals, unique users and counting traps
Why the same week of data gives different numbers of 'active users', and how to count them right.
~10 min read · 10 exercises · 250 points
Before you start
How many people were active?
Back on the Halves product team. Maya's board deck is due on Friday, and she has counted last week's export: 22 active users. The same file has 147 rows, and she wants you to check which number belongs on the slide.
In this lesson you'll learn to tell event totals from unique users, see who hides inside a count of "everyone with a row", and avoid the traps that make the same week give different numbers.
Event total vs unique users
Two counts come out of the same log, and they answer different questions.
- The event total counts rows: every event, repeats included. Last week's Halves export has 147 rows.
- Unique users count people: everyone with at least one row, each counted once. The same export has 22.
Dataset · 147 rows
Halves event log, 1–7 June (147 rows)
Every event from last week, in time order. Times are UTC.
First 5 of 147 rows
The gap comes from heavy users. u014 has 12 rows this week and u005 has one. In the event total, u014 weighs twelve times more; in unique users they weigh the same.
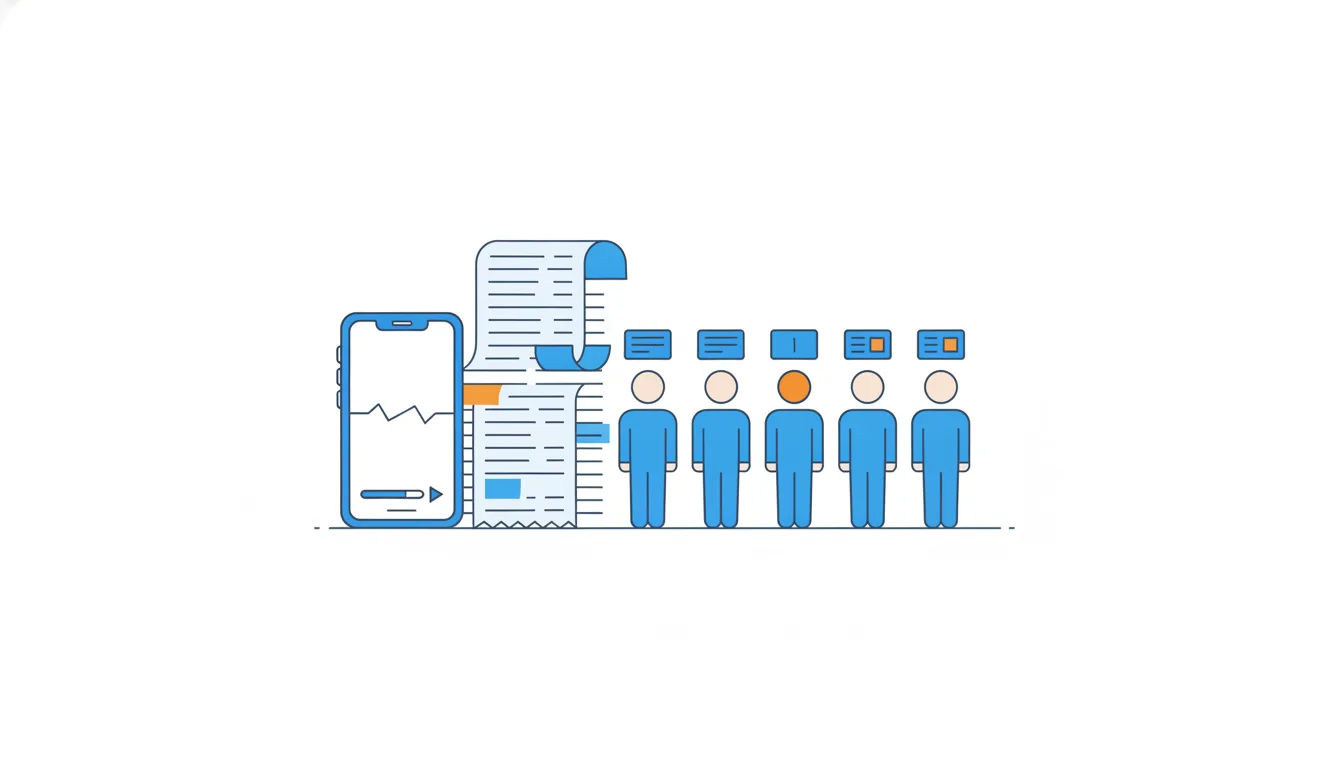
That's why an event total can grow while the user base stands still. If one person opens the app ten extra times, the total rises by 10 and unique users don't move. A chart of "events per week" going up says the product was used more, not that more people used it.
Before you count, decide whether the question is about people ("how many used it?") or actions ("how much was it used?"). "Active users" is always a question about people.
- Do“22 people appear in the log; together they logged 147 events.”
- Don't“Events grew from 147 to 160, so we gained users.”
A few heavy users can add rows without adding people.
Active means the person did something
Activity should mean the person did something, and "users with any row in the log" is not that number. As Events, properties and users showed, some rows are written by the server with nobody involved.
Last week's log has 22 distinct user_id. Three of them, u001, u005 and u015, appear only through Monday's recurring bills (platform = server, entry_method = recurring): they never opened the app all week. They still matter as paying Plus subscribers, but they weren't active.
A simple, checkable rule for Halves is: opened the app at least once in the week (app_opened). Counting distinct user_id among app_opened rows gives 19, and so does 22 − 3.
Before you call a count "active", look at what kinds of rows each person has. Someone who appears only through automatic events, reminders sent to them or emails delivered to them hasn't been active, whatever the log says.
- DoActive this week = distinct
user_idwithapp_opened= 19. - Don'tActive this week = distinct
user_idin the log = 22.Counts three people whose only rows are recurring bills added by the server.
Internal traffic and incomplete flags
Internal traffic is activity from your own team: QA testers, developers, support staff checking a bug. It doesn't belong in product metrics, and it's often the busiest traffic in a small app.
It has a recognisable pattern. In last week's Halves log two accounts have 20 rows each, and every expense is exactly $1: testers adding tiny amounts to check that the app works.
The obvious fix is the is_internal flag. But flags are set by people, and people forget. The flag catches u019; u002 has an empty is_internal. Its acquisition_channel = staff and its behaviour give it away.
Dataset · 22 rows
Halves users in the log (22 rows)
One row per account that appears in the event log.
First 5 of 22 rows
So the count goes 19 people who opened the app, 18 after removing the flagged account, and 17 after removing every staff account. Reporting 18 wouldn't look wrong, which is exactly why it's dangerous.
One week, four counts · shown above
Treat any hand-set flag as incomplete until you've checked it against a second signal: the sign-up channel, an email domain, round test amounts or an account list from the team.
- DoDrop u019 (flag) and u002 (channel
staff, twenty $1 rows): 17 real users. - Don'tFilter
is_internal = trueand report 18.Trusts a hand-set flag that missed one account.
Making the staff filter last
Finding the staff accounts once is not enough. The report runs every week, new testers join, and someone will forget a flag again.
A durable exclusion rule has three parts:
- Several signals, joined with OR. At Halves:
is_internal = trueoracquisition_channel = staff. Each catches what the other misses. - A written list. Keep the excluded
user_ids and the reason for each in one place everyone uses, so two analysts don't filter differently. - A regular check. Once a week or month, look for new accounts with the QA pattern: many tiny round expenses, sign-up from the office network, team email domains. Add them to the list.
The rule then becomes part of the metric's exclusions, written next to the number: "excludes staff accounts (flag or staff channel)". A reader who recounts with the same rule gets the same result.
When in doubt, report how many accounts the filter removed. "17 users, 2 staff accounts excluded" invites the right questions; a silent 18 doesn't.
- Do“WAU 17; excludes staff (
is_internal = trueor channelstaff): 2 accounts this week.” - Don'tEach analyst removes the test accounts they happen to know about.
Two people, two filters, two different numbers.
Counting events: when rows are right
The traps that distort user counts also distort event counts, but the fix is different.
Theo wants "expenses added last week" for the store page. The log has 60 expense_added rows. Two groups of them were not added by customers in the app:
- 5 recurring rows created by the server (u001 twice, u005, u015 twice);
- 20 rows from the two staff accounts, 10 each.
Dataset: Halves event log, 1–7 June (147 rows) · shown above
The groups don't overlap, so 60 − 5 − 20 = 35 expenses added by people.
Notice what changed and what didn't. Here counting rows is correct, because each expense is logged exactly once. You don't need distinct ids; you need to remove the rows that no customer created. Whether rows or distinct ids are right depends on how the event is logged, not on the type of number.
One more check: if two exclusions could overlap (a staff account with a recurring bill, say), subtract the overlap once. Counting the remaining rows after both filters is the safest way to avoid subtracting the same row twice.
- Do60 rows − 5 recurring − 20 staff = 35 expenses added by people
- Don't60 − 5 = 55 expenses added last week
Removes the server rows but keeps the QA testers' $1 expenses.
A typical value: mean or median?
A mean (average) adds every value and divides by the count, so a few huge values pull it far from where most values sit. A median is the middle value once the values are sorted: half lie below it, half above, and extreme values barely move it.
Halves's expenses show the gap. With staff removed, last week's 40 expense_added amounts start at $6 and stay near or below $100, plus three recurring bills the server added at $420, $420 and $650. The mean is $3,251 ÷ 40 = $81.28; the median, between the 20th and 21st values, is $40.50. Most people never add an $81 expense.
Pick the summary by the question. For "a typical expense" or "a typical user", report the median. When the total matters (money moved through the app, cost per expense), the mean is right, because mean × count gives back the total. Either way, say which one it is and what was counted: dropping the server rows too leaves 35 expenses people added, median $39, mean $47.66.
- DoTypical expense last week: $39 (median of 35 expenses people added).
- Don'tAverage expense: $81.
A mean pulled up by three server bills, with no word on what was counted.
Two-sided events: count the ids
Some actions are logged by more than one person. At Halves the payer records a settle-up, and when the receiver confirms it, their phone logs settle_up_recorded again with the same settlement_id.
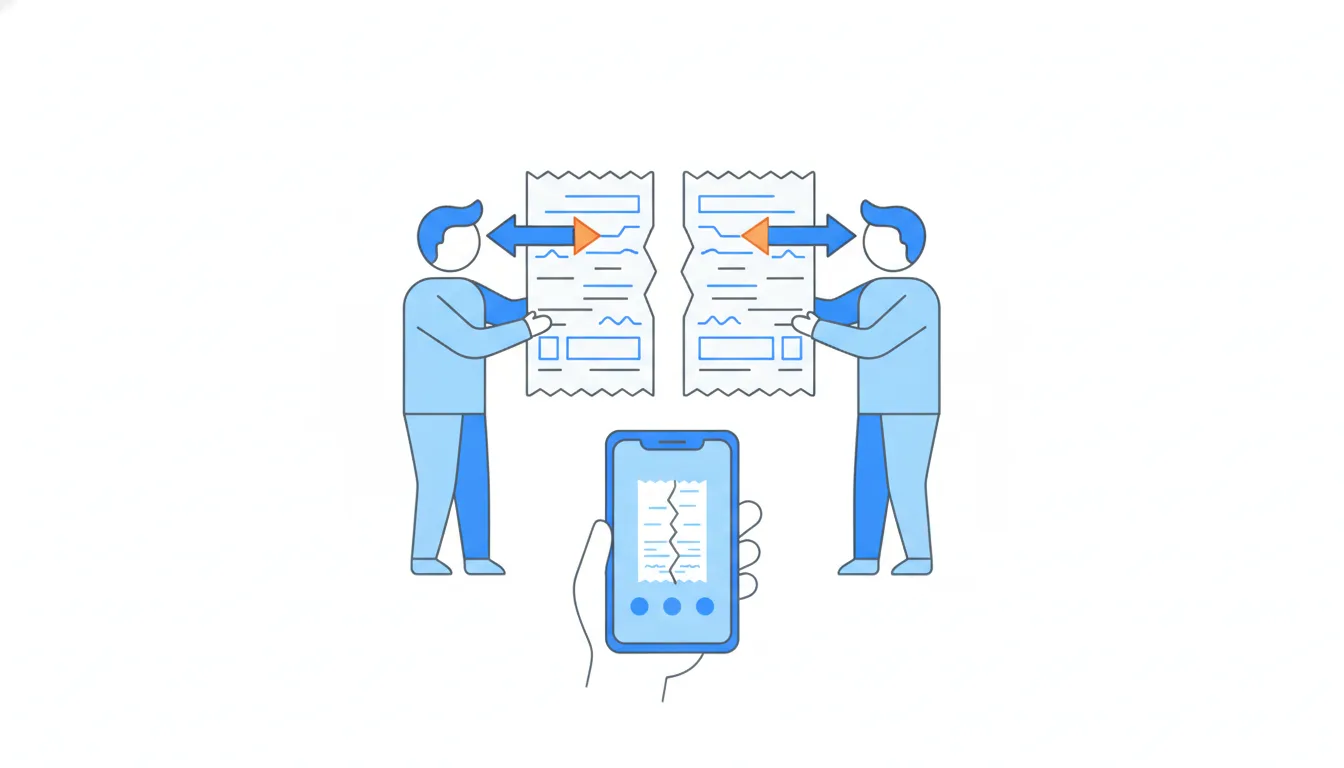
Last week's log has 11 settle-up rows. The distinct ids run from s001 to s008, so there were 8 payments; three of them (s003, s004, s007) were confirmed and appear twice. Check: 8 + 3 = 11.
Dataset: Halves event log, 1–7 June (147 rows) · shown above
Here rows overcount, so the fix is the opposite of the expense case: count distinct settlement_id, not rows.
The same applies to money. Summing amount_usd over all 11 rows gives $1,484, but the eight payments total $1,010. The confirmed payments were added twice.
How to spot a two-sided event before it bites: look for an id column that repeats across different user_ids with the same amount, and ask the developers which side logs what. Then write the rule into the tracking plan, so the next analyst counts payments the same way.
- DoPayments = distinct
settlement_id= 8, worth $1,010. - Don'tPayments =
settle_up_recordedrows = 11, worth $1,484.Counts each confirmed payment twice.
Payments or people: say which one
The same 11 settle-up rows give three honest numbers:
- 11 rows: what the log recorded, useful only for debugging;
- 8 payments: distinct
settlement_id, the answer to "how many settle-ups happened?"; - 9 people: distinct
user_idon either side, the answer to "how many people took part in a settle-up?"
People can be more than payments because one payment involves two people, and fewer when the same person settles up several times; at Halves this week u013 and u014 each appear twice. Neither number is better. They answer different questions.
The trap is a phrase like "settle-ups per user". It can mean payments divided by active users, or the share of active users who settled up, or payments credited only to the payer. Each gives a different number from the same data.
So when Maya asks, ask back which reading she needs, then write it down: the unit counted (payment or person) and, for people, whether payer, receiver or either side counts.
- Do“8 settle-ups this week; 9 different people took part, as payer or receiver.”
- Don't“Settle-ups per user: 0.5”, with no unit or side defined.
Nobody can recount it, because nobody knows what was divided by what.
Rows or distinct ids: a quick rule
Every count from an event log starts with one choice: count rows, or count distinct values of some id.
- Counting people (active users, people who settled up, people who saw a paywall): count distinct
user_id. One person, one count, however many rows. - Counting things that can be logged more than once (settle-ups confirmed by both sides, retried purchases): count distinct values of the thing's own id, such as
settlement_id. - Counting actions logged exactly once (expenses added, app opens): count rows, after removing rows no customer caused.
Then filter: drop server-side rows when you mean human activity, and drop every staff account, flagged or not. For Halves last week this gives 17 weekly active users, 35 expenses added by people, 8 settle-ups and 9 people who settled up.
How it fits together: decide whether you count people or actions, name the unit, apply the filters, and say how you summarize (the median for "typical", the mean for totals). Next, Metric definition: one rule, one number writes those choices down so two people get the same number.
- DoWAU: distinct
user_id. Settle-ups: distinctsettlement_id. Expenses: rows, cleaned. - Don'tCount distinct
user_idfor “expenses added”.That counts people who added expenses, not expenses.
Ready to practise?
Answer the lesson's exercises and earn 250 points the first time you finish it.
Start the exercises