

Theory
Channels and marketing attribution
Channel capacity and marginal CAC, a break-even cost that values the invitees a paid user brings, marketing attribution through the stores' privacy frameworks, and incrementality from a geo holdout.
~10 min read · 9 exercises · 250 points
Before you start
Where does the next dollar go?
In August Theo ran a budget experiment at Halves: he raised paid social spend week by week to see what happens. Now he'd like to put much more into the channel and wants your reading of the results.
In this lesson you'll look past the average cost per user to what the last dollars bought, value the invitees a paid user brings along, see what store privacy rules do to attribution, and measure what ads really add.
Channel capacity and marginal CAC
Every paid channel has a channel capacity: a spend level beyond which each extra dollar buys much less, because the first dollars reach the people most likely to install and later ones reach the less interested. You see it as a ramp of installs against spend, read through the marginal CAC from CAC, payback and ROI: extra spend ÷ extra installs, the price of the next users.

Halves's paid-social ramp in August 2026, one week at each level:
- $1,000 → 1,149 installs (average $0.87);
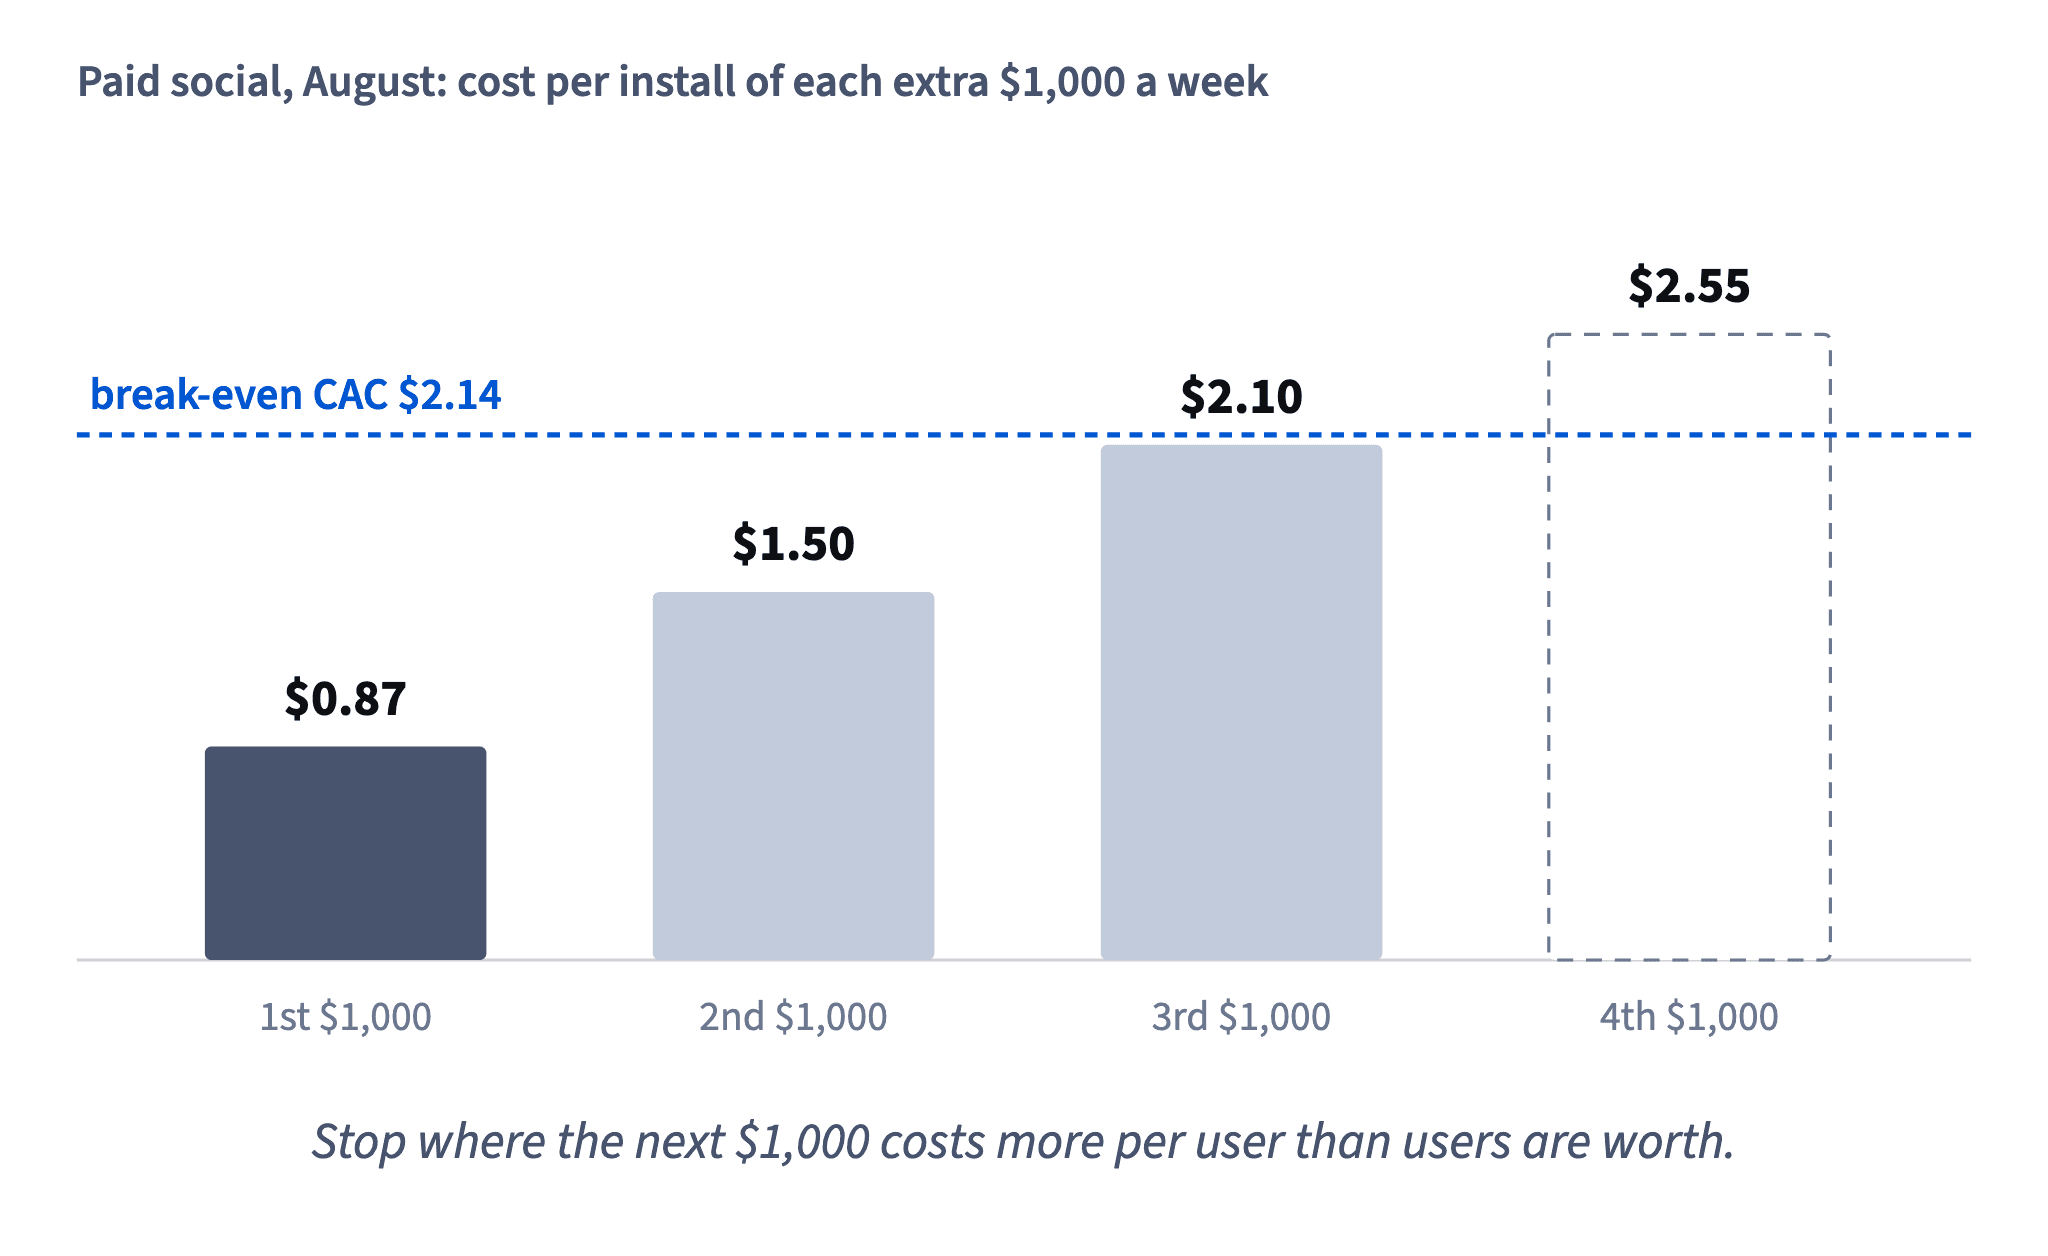
- $2,000 → 1,815: the second $1,000 bought 666, marginal $1.50;
- $3,000 → 2,291: the third bought 476, marginal $2.10;
- $4,000 → 2,683: the fourth bought 392, marginal $2.55.
The average at $4,000 is only $1.49, which looks fine. But the last $1,000 paid $2.55 per install, almost three times the first step. Raise budgets in steps like this and compute the marginal cost at each one; a single "CAC" for the whole budget will always tell you to spend more.
- DoMarginal CAC, $3,000 → $4,000 = $1,000 ÷ (2,683 − 2,291) = $1,000 ÷ 392 = $2.55.
- Don'tCAC at $4,000 = $4,000 ÷ 2,683 = $1.49, so the fourth $1,000 was cheap.
The average blends in the cheap first installs.
Break-even CAC, counting the invitees
The break-even CAC is the most you can pay for an install and still get the money back within a stated horizon. Its base is the value of what the install brings, in gross profit.
In a product with invites, a paid install brings more than one user. With k = 0.31, each paid user sets off a chain of 0.31 + 0.31² + … = 0.31 ÷ (1 − 0.31) = 0.4493 invited users over all generations. So:
break-even CAC = LTV₁₂ of a paid user + k ÷ (1 − k) × LTV₁₂ of an invited user
Halves: paid-social users earn $1.46 of gross profit in 12 months; invite users, measured on cohorts split by channel, $1.52. Break-even = $1.46 + 0.4493 × $1.52 = $1.46 + $0.68 = $2.14. Without invites the ceiling would be only $1.46.
Value invitees with their own measured LTV, not an assumption. Here the two are close, so assuming equal values gives a similar $2.12; in another product invitees could be worth much less. Stopping at 12 months keeps the ceiling cautious.
- DoBreak-even CAC = $1.46 + (0.31 ÷ 0.69) × $1.52 = $1.46 + $0.68 = $2.14.
- Don'tBreak-even CAC = $1.46 + 0.31 × $1.52 = $1.93.
Counts only the first generation of invitees.
Spend up to where the next dollar breaks even
The budget rule combines marginal CAC with the break-even CAC: keep adding budget while the marginal CAC of the next step stays below the break-even CAC, and stop at the first step that crosses it.
Halves, attributed installs against the $2.14 break-even:
- second $1,000: $1.50 per install, well inside;
- third $1,000: $2.10, inside by only four cents;
- fourth $1,000: $2.55, outside.
Dataset · 4 rows
Paid-social budget ramp, August 2026
One week at each spend level; installs as reported by attribution.
So on these numbers the data supports $3,000 a week, not $4,000. The average CAC at $4,000, $1.49, would say "keep going", which is exactly the error the marginal view prevents.
Two cautions belong next to the answer. A margin of four cents is thin, so any error in the inputs (LTV, k, or how many installs the ads really caused) can flip the third step. And each step ran for one week in August, so seasonality and noise sit inside the curve. Treat the result as the best current estimate and re-check it when the inputs improve, especially with a holdout test.
- Do“Third $1,000: $2.10 < $2.14, keep; fourth: $2.55 > $2.14, stop at $3,000 (thin margin, re-check).”
- Don't“The average CAC at $4,000 is $1.49, under $2.14, so spend the full $4,000.”
Judges the last dollar by the average of all of them.
Each channel against its own users’ value
Comparing channels by CAC alone rewards the cheapest clicks, not the best users. Users from different channels behave differently: at Halves, people who search the app store for a bill-splitting app arrive with a need and subscribe more often than people who saw an ad between other posts. Their 12-month gross profit is higher, so they can cost more and still pay back.
The fair rule: a channel fits when its marginal CAC stays below the break-even CAC built from its own users' value, with its own invitees counted. Each channel gets its own curve (how the marginal cost rises with spend) and its own ceiling (what its users are worth).
That's why "store search costs more per install than paid social did at $1,000, so drop it" is the wrong comparison: it puts one channel's cost against another channel's cost and ignores value on both sides. Compare each channel's margin with its own line, then put the next dollar where the gap between value and marginal cost is largest.
- Do“Keep store search ads while their marginal CAC stays under their own users’ break-even.”
- Don't“Store search costs more per install than paid social, so cut it.”
Compares costs and ignores what each channel’s users are worth.
Attribution through the stores’ privacy frameworks
Attribution answers "which campaign gets the credit for this install?". For mobile apps, it now comes mostly from the app stores' privacy-preserving frameworks, and they set clear limits:
- results arrive aggregated per campaign, not per user;
- they arrive late, a day or more after the install, sometimes with coarse values;
- there is no user-level trail, so you can't join an attributed install to that person's later subscription payments or build an LTV curve per ad.
So channel value has to come from cohorts measured another way (by sign-up month and channel where the app knows it, or from tests), not from joining ad clicks to revenue.
The deeper limit is about causation. Attribution says an ad came before an install. It doesn't say the install needed the ad: some of those people would have installed anyway, from the store, a friend or a group invite. An accurate count can still overstate what the ads added. Only switching ads off for a comparable group, a holdout, measures that.
- Do“The framework credits 2,219 installs to paid social in September; how many were extra needs a holdout.”
- Don't“Join each attributed install to its payments and build an LTV curve per ad.”
The frameworks give no user-level data to join.
Incrementality from a geo holdout
Incrementality is what a channel adds beyond what would have happened without it. A geo holdout measures it: keep ads running in some regions, pause them in similar ones, and compare.
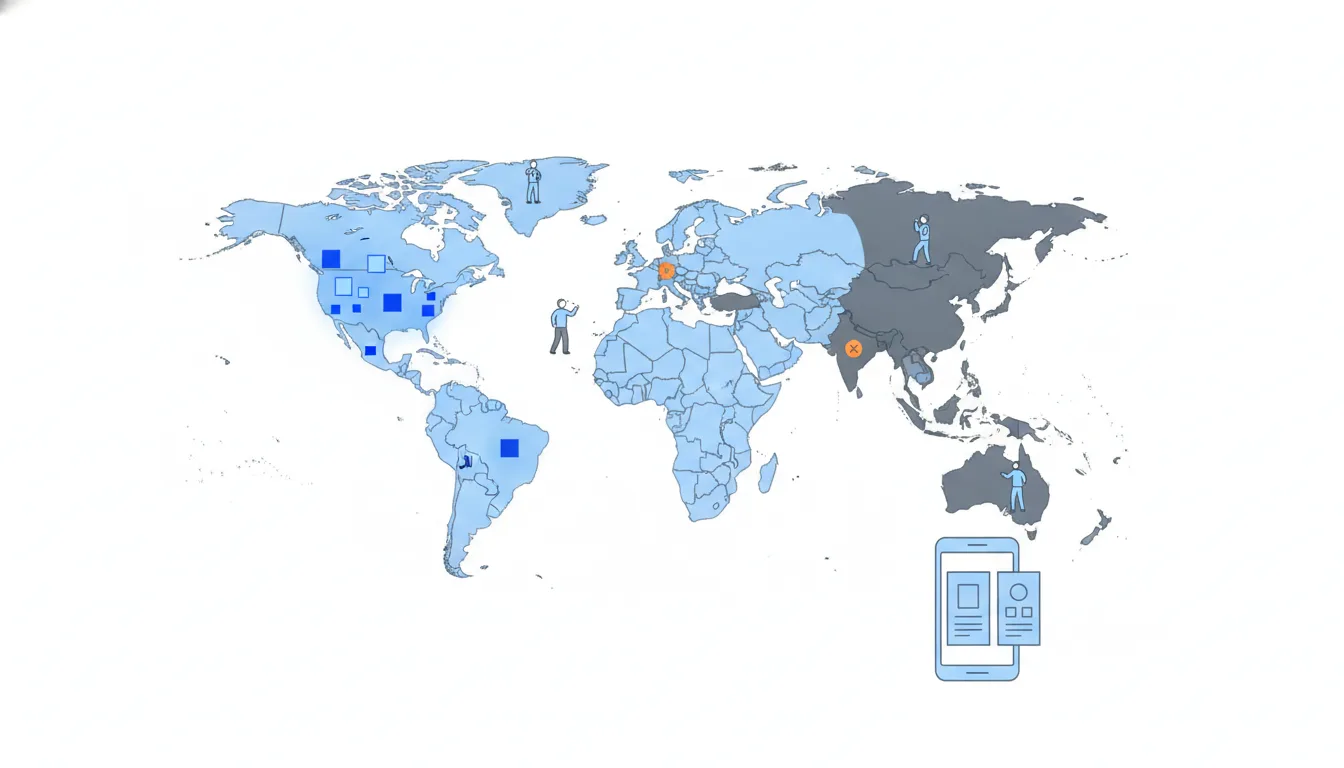
The holdout regions show the baseline trend. At Halves, the four holdout regions had 5,000 installs in the four weeks before and 3,651 during the test: a ratio of 0.7302, the drop that the season and everything else caused without ads.
Then:
- expected without ads in the test regions = their pre-period installs × the holdout ratio = 5,000 × 0.7302 = 3,651;
- incremental installs = actual − expected = 5,172 − 3,651 = 1,521;
- incremental CAC = spend ÷ incremental installs = $2,101 ÷ 1,521 = $1.38.
Attribution credited the same ads with 2,219 installs ($0.95 each), so only 1,521 ÷ 2,219 = 69% of them were extra.
Pick test and holdout regions that looked alike before the test, assign them at random where you can, and remember the result holds for the spend level tested.
- DoIncremental CAC = $2,101 ÷ (5,172 − 5,000 × 0.7302) = $2,101 ÷ 1,521 = $1.38.
- Don'tIncremental CAC = $2,101 ÷ (5,172 − 5,000) = $2,101 ÷ 172 = $12.22.
A plain before-and-after ignores the drop the holdout regions show.
Marginal CAC per incremental install
The ramp's marginal CAC was computed on attributed installs. If only part of them are incremental, every step really costs more per extra user:
marginal CAC per incremental install ≈ marginal CAC on attributed installs ÷ incremental share
With the geo test's share, 1,521 ÷ 2,219 = 0.6854:
- second $1,000: $1.50 ÷ 0.6854 = $2.19, now just above the $2.14 break-even;
- third $1,000: $2.10 ÷ 0.6854 = $3.07, far above;
- fourth $1,000: $2.55 ÷ 0.6854 = $3.72.
On this view the case for $3,000 a week disappears, and even $2,000 sits on the line.
The big caveat: the geo test ran at about $2,101 over four weeks in four regions, a lower spend than the ramp's top steps, and the incremental share can change with spend (at higher budgets, ads may reach more people who would have come anyway, or fewer). So this is a hypothesis to test, not a fact: the next step is a holdout at the budget level you're actually deciding about.
- DoThird $1,000: ($1,000 ÷ 476) ÷ (1,521 ÷ 2,219) = $2.10 ÷ 0.6854 = $3.07.
- Don'tThird $1,000: $2.10 × 0.6854 = $1.44.
Fewer real users per dollar make each one dearer, so divide, don’t multiply.
Five numbers for a channel decision
A budget decision for one channel rests on five numbers, each answering its own question:
- Channel capacity: how far can the channel scale before each dollar buys much less? A curve of installs against spend.
- Marginal CAC: what do the next users cost? Extra spend ÷ extra installs at the current step.
- Break-even CAC: what can a user cost and still pay back? Their own 12-month gross profit plus the invitees they bring.
- Attribution: which campaign gets the credit? Counts from the stores' frameworks, aggregated and late.
- Incrementality: how many of those installs needed the ads? Measured with a holdout.
Bad channel calls use one number for another's question: the average CAC for the next dollar, attributed installs for caused ones, the cheapest channel's CAC for every channel's ceiling.
How it fits together: find the marginal CAC at each step, correct it for incrementality, compare it with that channel's own break-even and stop at the first step that crosses the line. Next, Capstone: the unexplained spike.
- Do“Marginal CAC per incremental install, against this channel’s own break-even.”
- Don't“Attributed installs went up 21%, so the ads drove 21% more users.”
Credit is not cause.
Ready to practise?
Answer the lesson's exercises and earn 250 points the first time you finish it.
Start the exercises